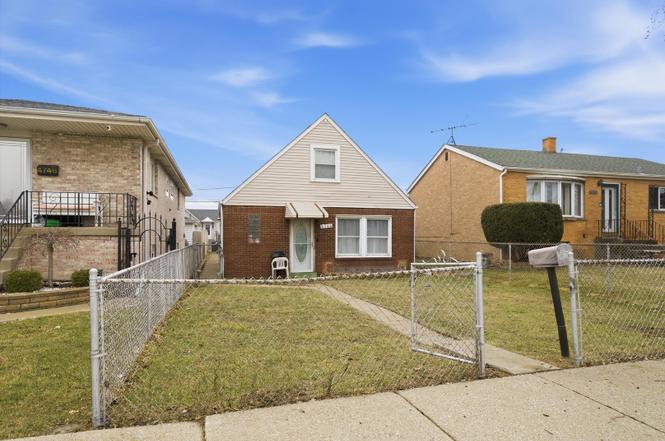
4744 S Lorel St · Forest View, IL
Flood risk 6/10 · Moderate
- FEMA flood zone
- X (unshaded)
- Chance of flooding over 30 yrs
- 0.74%
- Est. flood insurance / yr
- $507 – $1,088
Fire risk 1/10 · Minimal
- Est. fire insurance / yr
- $804 – $1,492
Heat risk 3/10 · Minor
- Hot days now (above 100°F)
- 7 days/yr
- Hot days in 30 yrs
- 15 days/yr
Wind risk 2/10 · Minimal
- Chance of severe wind over 30 yrs
- 0.0%
Air-quality risk 4/10 · Minor
- Unhealthy air days now
- 3 days/yr
- Unhealthy air days in 30 yrs
- 5 days/yr
Risk factors via First Street. Map © Google.
Why this score? — see what drove the C- grade
The composite is a weighted blend of 9 inputs, each scored 0–100. Each bar is that input's sub-score; the figure is the points it added to the 100-point composite (weight × sub-score).
- Cash flow +16.3/30.0
- ARV discount +15.0/15.0
- DSCR +5.0/10.0
- 1% rule +4.7/10.0
- Livability +4.0/5.0
- Rent growth +2.8/5.0
- Condition / age +2.5/5.0
- Schools +1.8/10.0
- Appreciation +0.0/10.0
$230,000
🖨 Deal sheet 📄 Offer letter ✓ Due diligence
Listing remarks MLS
Best deal as a starter or investment! NEW CONSTRUCTIONS AROUND! Priced for a quick sale. HOUSE IN DESIRABLE STICKNEY LOCATION/ACROSS FROM PARK & MINUTES FROM 55' HWY. BRICK 2 BEDROOMS & 1.5 BATHS PROPERTY FEATURES: SEPARATE DINING ROOM, KITCHEN W/ ACCESS TO THE YARD, 1 ST FL. LAUNDRY, NEWER WINDOWS, NEW WATER HEATER and brand new FURNACE. Property needs your cosmetic touches and updating. SOLD AS IS . VERY NICE/PRIVATE/FENCED BACKYARD & 2 CAR GARAGE. PRICED TO SELL !
Key facts
- Functional kitchen
- Convenient access
- Good neighborhood
Tags
Neighborhood map
What this means for you Summary
Snapshot
- This is a 3-bed/1.5-bath single-family listed at $230k.
Deal economics
- At list price, monthly cash flow is $125 ($1k/yr) — positive.
- The deal already cash-flows at list — no discount required.
- To meet the 1% rule (rent ≥ 1% of price), the offer needs to be $223k (2.9% below list).
- Recommended offer: $223k (2.9% below list) — sets the bar for 1% rule.
Location & tenants
- Location reads 80/100 on livability (#109 in IL, #1,778 nationally) — a professional / high-income tenant draw. Strengths: crime A+, commute A+, employment A+; Watch: health & safety D+, schools F, amenities F.
- Reavis Twp Hsd 220 (suburban): math 18% / reading 21% proficiency, ranked #420 of 620 in IL (top 68%) — low school quality limits family demand, transient renter base, plan for 1-2y turnover.
- Market conditions: Rents rising (+1.3%/yr); 11 active listings in the ZIP; 1 comparable units currently listed for rent nearby; solid renter incomes; 6,272 units permitted in Cook County in 2024 (4,658 in 5+ unit buildings).
Forward outlook
- Local home prices are declining (-3.0%/yr); year-one equity from $2k of loan paydown is wiped out by about $7k of value loss. Plan a longer hold.
Negotiation context
- Only 11 days on market — expect competitive offers; lowballing is unlikely to land.
- 9 sale attempts since 19y ago with the ask held roughly flat each time — persistent listings suggest the price (not the market) is what's stuck; bring a comps-based counter.
- Current owner paid $135k; list at $230k implies a 70% gain — meaningful room to come down on a strong offer.
Risks & watch-outs
- Climate carrying-cost: major flood risk — expect insurance premiums to compound above CPI over the hold.
Questions for the listing agent
- Built in 1978 — when were the roof, HVAC, electrical panel, plumbing, and water heater last replaced?
- Is there a deadline driving the sale (1031 exchange, divorce, estate, relocation)? That informs how much negotiation room exists.
- Schools are F-rated, which usually means shorter tenancies and higher turnover. Who's the typical renter profile here, and what's been the actual vacancy rate?
- What's the average days-on-market for RENTAL listings here right now (not sales)? A rising rental-DOM trend means longer vacancies and softer asking-rent achievability than the comps imply.
- What's the recent tenant-quality profile in this submarket — average credit score on applications, eviction rate, late-payment / NSF rate, and stable-employment percentage? A property-management company in the area should have these aggregated.
- How much new for-sale + rental construction is in the pipeline within 1–3 miles? Heavy new supply typically softens prices + rents 12–24 months out; constrained supply supports both.
Investment metrics
- 1% rule
- 0.97% ✗
- Cap rate
- 6.94%
- Cash-on-cash
- 2.33%
- DSCR
- 1.10
- GRM
- 8.6
CMA / ARV
- ARV (on-the-fly)
- $311,902
- Comps found
- 12
Show comp detail 12 sales within ~0.75 mi
| Address | Dist | Beds/Ba | Sqft | Sold | Price | $/sf | Match |
|---|---|---|---|---|---|---|---|
| 4744 S Lorel St | 0.00mi | 3/1.5 | 1,126 (0%) | 1mo | $230,000 | $204 | 100 |
| 4901 S Lorel Ave | 0.18mi | 3/1.0 | 1,120 (-0%) | 1mo | $285,000 | $254 | 88 |
| 4805 S Latrobe Ave | 0.17mi | 3/2.0 | 1,080 (-4%) | 0mo | $310,000 | $287 | 83 |
| 4737 S Leamington Ave | 0.28mi | 3/1.0 | 1,092 (-3%) | 1mo | $241,500 | $221 | 79 |
| 4857 S Lorel Ave | 0.16mi | 3/1.0 | 1,050 (-7%) | 2mo | $255,000 | $243 | 78 |
| 5123 S Lotus Ave | 0.48mi | 3/2.0 | 1,040 (-8%) | 2mo | $340,000 | $327 | 61 |
| 4727 S Lavergne Ave | 0.47mi | 4/2.0 (+1) | 1,067 (-5%) | 2mo | $300,000 | $281 | 61 |
| 5024 S Lockwood Ave | 0.37mi | 4/1.5 (+1) | 1,012 (-10%) | 2mo | $243,000 | $240 | 59 |
| 4412 S Leamington Ave | 0.50mi | 3/1.5 | 988 (-12%) | 1mo | $320,000 | $324 | 56 |
| 4452 S Lawler Ave | 0.52mi | 3/2.0 | 1,008 (-10%) | 3mo | $265,000 | $263 | 54 |
| 5006 S La Crosse Ave | 0.71mi | 4/2.0 (+1) | 1,075 (-4%) | 3mo | $345,000 | $321 | 50 |
| 5216 S Major Ave | 0.73mi | 3/2.0 | 1,280 (+14%) | 3mo | $355,000 | $277 | 38 |
Match score weights: distance 35% · size 25% · config 20% · recency 20%. Top-matched comps best support the ARV.
Projected returns pro-forma
-3.0% appreciation · 1.32% rent growth · sell at horizon
- IRR
- -14.5%
- Equity multiple
- 0.49×
- Total profit
- $-32,969
- Equity at exit
- $34,294
- IRR
- -8.9%
- Equity multiple
- 0.49×
- Total profit
- $-32,943
- Equity at exit
- $19,886
Cash invested: $64,400 (down + closing). Projections, not guarantees.
Landlord ↔ Tenant lean methodology
- Overall (STATE)
- 43 Moderately Tenant-Leaning
- State Illinois
- 43 Moderately Tenant-Leaning · D+7
- County
- — inherits STATE
- City
- — inherits STATE
ZIP-level market 60638
- Rents YoY
- 1.3%
- Active inventory
- 11
- Price-to-rent
- 8.6×
Monthly cashflow live
- Estimated rent
- $2,234 medium interval (Pro) →
- Mortgage (P&I)
- −$1,206
- Tax from tax record
- −$338 /mo · $4,056/yr
- Insurance
- −$96
- HOA
- −$0
- Vacancy / Maint / Mgmt
- −$469
- Net cashflow
- $125
Break-even live
UW: 25.0% down · 7.5% · 30yr · 1.5% tax · 5.0% vac · 8.0% maint · 8.0% mgmt
Financing live
Cash to close
- Down payment
- $57,500
- Closing costs
- $6,900
- Reserves months
- —
- Total cash needed
- —
Loan-product check · same deal, 3 products live
Conventional
25% down · 7.5% · 30yr
- Down + closing
- —
- Monthly P&I
- —
- Monthly cashflow
- —
- DSCR
- —
- Eligible?
- —
Personal DTI + credit; lowest rate.
DSCR
20% down · 8.5% · 30yr
- Down + closing
- —
- Monthly P&I
- —
- Monthly cashflow
- —
- DSCR
- —
- Eligible?
- —
No personal income docs; deal must DSCR.
Hard money
10% down · 12.0% · 12mo
- Down + closing
- —
- Monthly P&I
- —
- Monthly cashflow
- —
- DSCR
- —
- Eligible?
- —
Short-term bridge; refi at stabilization.
Rent comps 1 comps
| Address | Beds | Baths | Sqft | Rent | $/sqft | DOM | Units | Dist |
|---|---|---|---|---|---|---|---|---|
| 4824 S Lotus Ave Unit G Chicago, IL | 2.0 | 1.0 | 750 | $1,400 | $1.87 | 4d | 1 | 0.15mi |
Listing history 28 events
-
2026-03-20status Pending
-
2026-03-09$230,000 Active
-
2020-10-06soldstatus $135,000
-
2020-08-18soldstatus $135,000 Closed Sale 491-char remark
Show marketing remark (491 chars)
Best deal as a starter or investment! NEW CONSTRUCTIONS AROUND! Priced for a quick sale. HOUSE IN DESIRABLE STICKNEY LOCATION/ACROSS FROM PARK & MINUTES FROM 55' HWY. BRICK 2 BEDROOMS & 1.5 BATHS PROPERTY FEATURES: SEPARATE DINING ROOM, KITCHEN W/ ACCESS TO THE YARD, 1 ST FL. LAUNDRY, NEWER WINDOWS, NEW WATER HEATER and brand new FURNACE. Property needs your cosmetic touches and updating. SOLD AS IS . VERY NICE/PRIVATE/FENCED BACKYARD & 2 CAR GARAGE. PRICED TO SELL !
-
2020-07-10$142,000 491-char remark
Show marketing remark (491 chars)
Best deal as a starter or investment! NEW CONSTRUCTIONS AROUND! Priced for a quick sale. HOUSE IN DESIRABLE STICKNEY LOCATION/ACROSS FROM PARK & MINUTES FROM 55' HWY. BRICK 2 BEDROOMS & 1.5 BATHS PROPERTY FEATURES: SEPARATE DINING ROOM, KITCHEN W/ ACCESS TO THE YARD, 1 ST FL. LAUNDRY, NEWER WINDOWS, NEW WATER HEATER and brand new FURNACE. Property needs your cosmetic touches and updating. SOLD AS IS . VERY NICE/PRIVATE/FENCED BACKYARD & 2 CAR GARAGE. PRICED TO SELL !
-
2020-07-10historical 491-char remark
Show marketing remark (491 chars)
Best deal as a starter or investment! NEW CONSTRUCTIONS AROUND! Priced for a quick sale. HOUSE IN DESIRABLE STICKNEY LOCATION/ACROSS FROM PARK & MINUTES FROM 55' HWY. BRICK 2 BEDROOMS & 1.5 BATHS PROPERTY FEATURES: SEPARATE DINING ROOM, KITCHEN W/ ACCESS TO THE YARD, 1 ST FL. LAUNDRY, NEWER WINDOWS, NEW WATER HEATER and brand new FURNACE. Property needs your cosmetic touches and updating. SOLD AS IS . VERY NICE/PRIVATE/FENCED BACKYARD & 2 CAR GARAGE. PRICED TO SELL !
-
2020-05-27status Contingent
-
2020-05-25historical
-
2020-01-03New
-
2019-12-26historical
-
2019-10-29price
-
2019-06-26New
-
2019-06-26historical
-
2019-03-21New
-
2019-03-17historical
-
2019-03-10historical Contingent
-
2018-12-12New
-
2018-12-12historical
-
2018-08-25price
-
2018-08-08price
-
2018-08-01price
-
2018-07-12New
-
2018-07-12historical
-
2018-07-10price
-
2018-07-01New
-
2008-07-19historical
-
2007-07-18
-
2002-06-27soldstatus $123,000
ⓘ Source: listings_history table (triggers on properties + properties_extension) + one-shot
backfill from property_details.listing_events for pre-trigger history.
Tax reassessment forecast IL · Partial reset (capped growth)
- Current annual tax
- $4,056 · $338/mo
- Projected year-2 tax
- $4,639 · $387/mo
- Expected delta
- +$582/yr (+$49/mo · 14.4%)
ⓘ Screening estimate from a state-policy table — verify with the county assessor before closing.
Climate risk First Street
- Flood 6/10 Major FEMA zone X (unshaded) · 74% chance over 30 yrs
- Wildfire 1/10 Low
- Heat 3/10 Moderate 7 d/yr ≥100°F today · 15 d/yr by 30 yrs out
- Wind 2/10 Low 0% chance of damaging wind over 30 yrs
- Air quality 4/10 Moderate 3 unhealthy d/yr today · 5 by 30 yrs out
Nearby sold comps map
Loading sold comps map…
Walkable amenities ~0.75 mi
Loading nearby amenities…
Taxation est. · year 1
- Rental income
- $26,808
- − Mortgage interest
- −$12,884
- − Property taxes
- −$4,056
- − Insurance
- −$1,150
- − Repairs & maintenance
- −$2,145
- − Management
- −$2,145
- − Depreciation
- −$6,691
- Taxable loss
- −$2,262
- Est. tax savings @ 24.0%
- +$543
- After-tax cash flow
- $2,041/yr
For passive investors: Depreciation is non-cash, so a rental often shows a tax loss while cash-flowing — sheltering income. Rental losses are passive: they offset passive income freely, and up to $25,000/yr can offset ordinary (W-2) income if you actively participate and your MAGI is under $100k (phasing out to $0 by $150k); unused losses carry forward. On sale, claimed depreciation is recaptured at up to 25%, and gains may owe capital-gains tax (a 1031 exchange can defer both). Figures are a year-1 estimate at your 24.0% rate — not tax advice; consult a CPA.
Schools (NCES district)
- District
- Reavis Twp Hsd 220
- NCES district ID
- 1733270
- Math proficiency
- 18% ▼ -3.00%
- Reading proficiency
- 21% ▼ -4.00%
- Median HH income
- $54,732
- Composite
- 17.94/100
- National rank
- #8994
- State rank
- #420 of 620 in IL
Livability — Forest View
- Score
- 80/100
- State rank
- #109
- US rank
- #1778
Category grades
Schools grade is shown separately in the Schools card above.
Census & demographics
- County
- Cook County · 4,486,803 people
- Metro
- Chicago-Naperville-Elgin, IL-IN-WI
- Population (ZIP)
- 57,074
- Household income
- $91,070
- Rent vs Own
- Severe rent burden
- 912.0
Population outlook (Cook County) Hauer SSP2
- Today (2025)
- 5,347,519 people
- By 2030
- 5,357,703 · +0.2%
- By 2040
- 5,324,924 · -0.4%
- By 2050
- 5,230,762 · -2.2%
- By 2075
- 4,785,735 · -10.5%
- By 2100
- 4,188,836 · -21.7%
Race, ethnicity, and origin ACS 2023
- Neighborhood character
- Majority Hispanic (60%)
- Race & ethnicity
- Hispanic / Latino 60% White 36% Two or more races 21% Black 2% Native American 2%
- Hispanic origin (detail)
- Mexican 54% Puerto Rican 3%
- Common ancestry
- Romanian 16% Scotch-Irish 1% Lithuanian 1%
- Foreign-born
- 24% · Canada, China
- Languages at home
- 44% English-only · Spanish 45% Russian/Polish/Slavic 9% Other Indo-European 1%
Political lean MEDSL · Cook
- 2024 margin
- Solid D (+42.0) · D 70.4% · R 28.4% · Other 1.2%
- 2008→2024 swing
- -11.4pp toward R · 2008: 53.4pp · 2024: 42.0pp
- All cycles
- 2024: D+42.0 2020: D+50.3 2016: D+53.0 2012: D+49.4 2008: D+53.4
Not yet ingested
- Civics
- —
Market trends
- HPI YoY
- ▼ -276.94%
- Current HPI
- 233.5662
- Rent YoY
- ▲ 1.32%
- Metro
- Chicago-Naperville-Elgin, IL-IN-WI
- State GDP YoY
- ▲ 1.59%
- F500 in state
- 60
Industry mix (Fortune 500 HQ in IL)
| Industry | F500 HQs | Revenue |
|---|---|---|
| Insurance | 4 | $201B |
|
||
| Consumer Goods | 4 | $87B |
|
||
| Industrial Machinery | 3 | $64B |
|
||
| Healthcare | 2 | $55B |
|
||
| Retail / Pharmacy | 1 | $148B |
|
||
| Agriculture / Food | 1 | $86B |
|
||
Price history
+87.0% since first listed28 events — show timeline
- 2026-03-20 Pending — MRED as Distributed by MLS Grid
- 2026-03-09 Listed $230,000 MRED as Distributed by MLS Grid
- 2020-10-06 Sold (Public Records) $135,000 Public Records
- 2020-08-18 Sold (MLS) $135,000 MRED as Distributed by MLS Grid
- 2020-07-10 Listing Removed — MRED as Distributed by MLS Grid
- 2020-07-10 Listed $142,000 MRED as Distributed by MLS Grid
- 2020-05-27 Pending — MRED as Distributed by MLS Grid
- 2020-05-25 Listing Removed — MRED as Distributed by MLS Grid
- 2020-01-03 Listed — MRED as Distributed by MLS Grid
- 2019-12-26 Listing Removed — MRED as Distributed by MLS Grid
- 2019-10-29 Price Changed — MRED as Distributed by MLS Grid
- 2019-06-26 Listing Removed — MRED as Distributed by MLS Grid
- 2019-06-26 Listed — MRED as Distributed by MLS Grid
- 2019-03-21 Listed — MRED as Distributed by MLS Grid
- 2019-03-17 Listing Removed — MRED as Distributed by MLS Grid
- 2019-03-10 Contingent — MRED as Distributed by MLS Grid
- 2018-12-12 Listing Removed — MRED as Distributed by MLS Grid
- 2018-12-12 Listed — MRED as Distributed by MLS Grid
- 2018-08-25 Price Changed — MRED as Distributed by MLS Grid
- 2018-08-08 Price Changed — MRED as Distributed by MLS Grid
- 2018-08-01 Price Changed — MRED as Distributed by MLS Grid
- 2018-07-12 Listing Removed — MRED as Distributed by MLS Grid
- 2018-07-12 Listed — MRED as Distributed by MLS Grid
- 2018-07-10 Price Changed — MRED as Distributed by MLS Grid
- 2018-07-01 Listed — MRED as Distributed by MLS Grid
- 2008-07-19 Listing Removed — MRED as Distributed by MLS Grid
- 2007-07-18 Listed — MRED as Distributed by MLS Grid
- 2002-06-27 Sold (Public Records) $123,000 Public Records
Property tax history
-1.5%/yrLatest (2023): $4,056 · +10.3% YoY. Source: county tax records.
Cash-flow waterfall
monthlySold comps — $/sqft
last 12 mo · ≤1 miLoading sold comps…