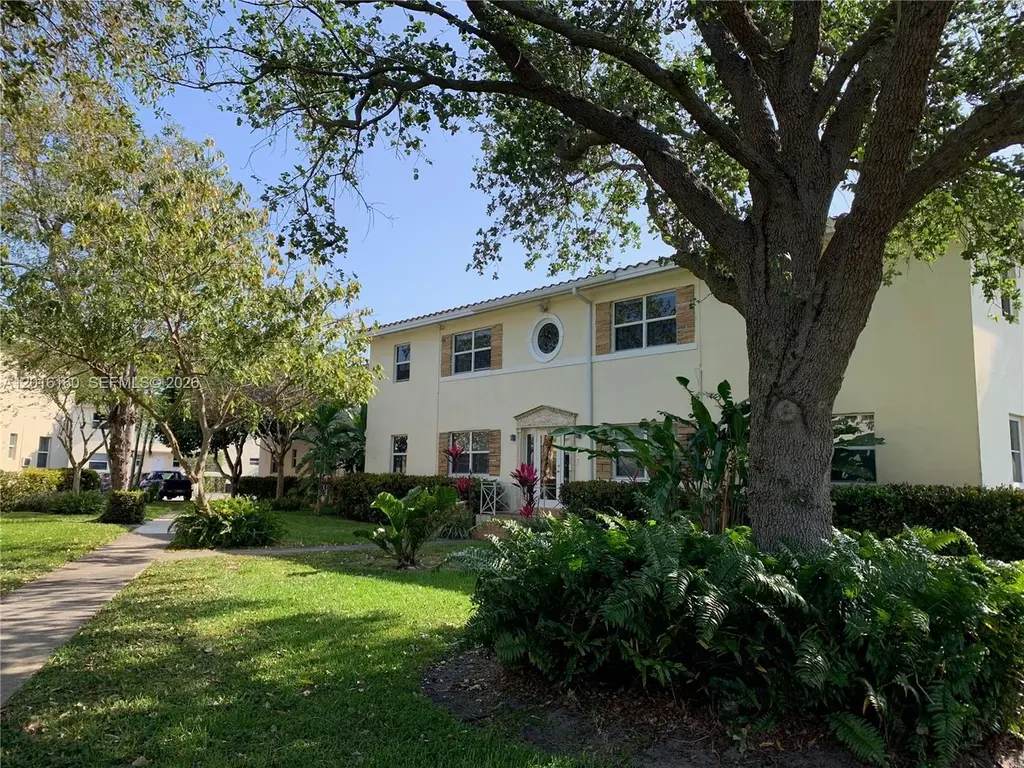
723 NE 91st St #3 · Miami Shores, FL
Flood risk 6/10 · Moderate
- FEMA flood zone
- X (unshaded)
- Chance of flooding over 30 yrs
- 0.56%
- Est. flood insurance / yr
- $507 – $1,088
Fire risk 1/10 · Minimal
- Est. fire insurance / yr
- $947 – $1,759
Heat risk 10/10 · Severe
- Hot days now (above 103°F)
- 5 days/yr
- Hot days in 30 yrs
- 19 days/yr
Wind risk 10/10 · Severe
- Chance of severe wind over 30 yrs
- 99.0%
Air-quality risk 2/10 · Minimal
- Unhealthy air days now
- 1 days/yr
- Unhealthy air days in 30 yrs
- 2 days/yr
Risk factors via First Street. Map © Google.
Why this score? — see what drove the C- grade
The composite is a weighted blend of 9 inputs, each scored 0–100. Each bar is that input's sub-score; the figure is the points it added to the 100-point composite (weight × sub-score).
- Cash flow +18.4/30.0
- ARV discount +7.5/15.0
- 1% rule +7.0/10.0
- DSCR +5.8/10.0
- Schools +4.2/10.0
- Livability +4.0/5.0
- Condition / age +3.8/5.0
- Rent growth +2.6/5.0
- Appreciation +0.0/10.0
$265,000
🖨 Deal sheet (PDF) 📄 Offer letter ✓ Due diligence
Listing remarks
Investor's dream opportunity in the heart of Miami Shores. Income-producing 2BR/1BA top-floor residence currently leased at $1,990/month through June 30, 2027, offering immediate and stable cash flow. Low maintenance fees. This large 2/1 top-floor unit is located in the appealing & beautiful Miami Shores. The building is extremely well-kept, with a new roof and impact windows, overlooking lush landscaping. The unit has great character, including a living room, formal dining area, wood floors, lots of natural light, and 5 large closets! Prime location just one block from Biscayne Blvd and directly across from Publix, restaurants, banks, shops, and everyday conveniences. Residents als
Key facts
- Living room
- Formal dining area
- Lush landscaping
Tags
Property features AI
Finance
- Other: Annual tax information available
- Financial info: Lease considered; Pets not allowed
- HOA & community: Monthly association fee of $434; HOA covers association management, common areas, insurance, grounds maintenance, structure maintenance, trash and water
Exterior
- Parking: Detached garage (1 covered space)
- Security: Secured lobby
- Home design: 2-story building; Entry on second floor
- Construction: Block construction; Resale property
- Exterior features: Fruit trees; Property is attached
Interior
- Kitchen: Gas range; Refrigerator; Some gas appliances
- Flooring: Hardwood; Wood
- Bathrooms: 1 full bathroom
- Heating & cooling: Wall furnace heating; Wall/window air conditioning units
- Interior features: Impact glass windows; Second floor entry; Living/dining room; Walk-in closet(s); Unfurnished
Neighborhood map
What this means for you Summary
Snapshot
- This is a 2-bed/1.0-bath condo listed at $265k. Condition is rated good.
Deal economics
- At list price, monthly cash flow is $250 ($3k/yr) — positive.
- The deal already cash-flows at list — no discount required.
- Meets the 1% rule at list price ($3k rent vs $265k).
- Recommended offer: $261k (1.5% below list) — sets the bar for market timing.
Location & tenants
- Location reads 80/100 on livability (#130 in FL, #1,936 nationally) — a professional / high-income tenant draw. Strengths: commute A+, employment A+, housing A+; Watch: crime D, amenities F, cost of living F.
- Miami-Dade (suburban): math 45% / reading 54% proficiency, ranked #40 of 73 in FL (top 55%) — families likely to look elsewhere, expect single-tenant / working-renter base with shorter leases; 64% free/reduced lunch — lower-income household profile, screen leases tightly.
- Zoned schools: Miami Shores Elementary School (math 39% / reading 55%, grade D-, #1,191 of 2,144 statewide, top 57%, 559 students, 59% FRL); Horace Mann Middle School (math 23% / reading 31%, grade F, #497 of 571 statewide, top 88%, 528 students, 76% FRL); Miami Edison Senior High School (math 19% / reading 15%, grade F, #597 of 667 statewide, top 90%, 623 students, 72% FRL).
- Zoned-school proficiency averages 30% at this address vs 50% district-wide (-19 pts) — the specific schools serving this property underperform the Miami-Dade average; the district grade overstates school quality for this exact location.
- Market conditions: Rents flat; 369 active listings in the ZIP; solid renter incomes; 10,051 units permitted in Miami-Dade County in 2024 (7,758 in 5+ unit buildings).
- At $3,184/mo this rent would consume 51% of the median local household income ($75k/yr) (locally 2049% of renters already pay >50% of income on rent) — very limited rent-growth headroom before tenants either downsize or default.
Forward outlook
- Local home prices are declining (-3.0%/yr); year-one equity from $2k of loan paydown is wiped out by about $8k of value loss. Plan a longer hold.
- Miami-Dade County population projected at +28% by 2050 — long-run rental-demand tailwind backs the buy-and-hold thesis.
Negotiation context
- It's been on market 23 days — a 2% lower offer ($261k) is reasonable based on typical stale-listing flexibility.
Risks & watch-outs
- Watch-outs: built in 1949 — expect roof / HVAC / electrical / plumbing capex.
- Climate carrying-cost: major flood risk; severe wind risk, 99% chance of damaging wind over 30y; extreme-heat days projected 5→19/yr by 2055 (HVAC capex compounding) — expect insurance premiums to compound above CPI over the hold.
Questions for the listing agent
- Built in 1949 — when were the roof, HVAC, electrical panel, plumbing, and water heater last replaced?
- What does the HOA fee cover, when was the last increase, and are there any pending special assessments or reserve-fund shortfalls?
- Any open or pending special assessments — roof, HVAC, plumbing, elevator, façade? What's the per-unit balance and payoff schedule, and is the seller paying it off at close or rolling it to the buyer?
- Is there a deadline driving the sale (1031 exchange, divorce, estate, relocation)? That informs how much negotiation room exists.
- Schools are A-rated — typically a magnet for longer-tenancy family renters. What's the average tenant stay here, and is there a school-zone premium baked into asking?
- Crime grade is D in this area — have there been break-ins, vandalism, or insurance claims at this property in the last 3 years? What carrier currently insures it and at what premium?
- What's the average days-on-market for RENTAL listings here right now (not sales)? A rising rental-DOM trend means longer vacancies and softer asking-rent achievability than the comps imply.
- What's the recent tenant-quality profile in this submarket — average credit score on applications, eviction rate, late-payment / NSF rate, and stable-employment percentage? A property-management company in the area should have these aggregated.
- How much new apartment / multifamily construction is in the pipeline within 1–3 miles? Heavy new supply (>2% of stock underway) typically softens rents 12–24 months out; light construction supports rent growth.
Investment metrics
- 1% rule
- 1.20% ✓
- Cap rate
- 7.42%
- Cash-on-cash
- 4.04%
- DSCR
- 1.18
- GRM
- 6.9
CMA / ARV
No comps found within radius.
Projected returns pro-forma
-3.0% appreciation · 0.33% rent growth · sell at horizon
- IRR
- -13.6%
- Equity multiple
- 0.53×
- Total profit
- $-35,049
- Equity at exit
- $39,512
- IRR
- -10.7%
- Equity multiple
- 0.45×
- Total profit
- $-41,163
- Equity at exit
- $22,912
Cash invested: $74,200 (down + closing). Projections, not guarantees.
Landlord ↔ Tenant lean methodology
- Overall (STATE)
- 87 Strongly Landlord-Friendly
- State Florida
- 87 Strongly Landlord-Friendly · R+3
- County
- — inherits STATE
- City
- — inherits STATE
ZIP-level market 33138
- Rents YoY
- 0.3%
- Active inventory
- 369
- Price-to-rent
- 6.9×
Monthly cashflow live
- Estimated rent
- $3,184 medium interval (Pro) →
- Mortgage (P&I)
- −$1,390
- Tax est. 1.5%
- −$331 /mo · $3,975/yr
- Insurance
- −$110
- HOA
- −$434
- Vacancy / Maint / Mgmt
- −$669
- Net cashflow
- $250
Break-even live
Sensitivity live
| Price | -10% $433 | -5% $341 | +0% $250 | +5% $158 | +10% $67 |
|---|---|---|---|---|---|
| Rent | -10% $-2 | -5% $124 | +0% $250 | +5% $376 | +10% $501 |
| Rate | -1.0pp $383 | -0.5pp $317 | base $250 | +0.5pp $181 | +1.0pp $111 |
UW: 25.0% down · 7.5% · 30yr · 1.5% tax · 5.0% vac · 8.0% maint · 8.0% mgmt
Financing live
Cash to close
- Down payment
- $66,250
- Closing costs
- $7,950
- Reserves months
- —
- Total cash needed
- —
Loan-product check · same deal, 3 products live
Conventional
25% down · 7.5% · 30yr
- Down + closing
- —
- Monthly P&I
- —
- Monthly cashflow
- —
- DSCR
- —
- Eligible?
- —
Personal DTI + credit; lowest rate.
DSCR
20% down · 8.5% · 30yr
- Down + closing
- —
- Monthly P&I
- —
- Monthly cashflow
- —
- DSCR
- —
- Eligible?
- —
No personal income docs; deal must DSCR.
Hard money
10% down · 12.0% · 12mo
- Down + closing
- —
- Monthly P&I
- —
- Monthly cashflow
- —
- DSCR
- —
- Eligible?
- —
Short-term bridge; refi at stabilization.
HOA detail condo
- Monthly dues
- $434 · $5,208/yr
- Likely covers
- landscaping
- Assessments
- None detected in remarks — confirm with the listing agent.
Listing history 3 events
-
2026-06-01days on market $265,000 Active 23 DOM
-
2026-05-31days on market $265,000 Active 22 DOM
-
2026-05-09$265,000 Active
ⓘ Source: listings_history table (triggers on properties + properties_extension) + one-shot
backfill from property_details.listing_events for pre-trigger history.
Climate risk First Street
- Flood 6/10 Major FEMA zone X (unshaded) · 56% chance over 30 yrs
- Wildfire 1/10 Low
- Heat 10/10 Extreme 5 d/yr ≥103°F today · 19 d/yr by 30 yrs out
- Wind 10/10 Extreme 99% chance of damaging wind over 30 yrs
- Air quality 2/10 Low 1 unhealthy d/yr today · 2 by 30 yrs out
Nearby sold comps map
Loading sold comps map…
Walkable amenities ~0.75 mi
Loading nearby amenities…
Taxation est. · year 1
- Rental income
- $38,205
- − Mortgage interest
- −$14,844
- − Property taxes
- −$3,975
- − Insurance
- −$1,325
- − Repairs & maintenance
- −$3,056
- − Management
- −$3,056
- − HOA
- −$5,208
- − Depreciation
- −$7,709
- Taxable loss
- −$969
- Est. tax savings @ 24.0%
- +$233
- After-tax cash flow
- $3,230/yr
For passive investors: Depreciation is non-cash, so a rental often shows a tax loss while cash-flowing — sheltering income. Rental losses are passive: they offset passive income freely, and up to $25,000/yr can offset ordinary (W-2) income if you actively participate and your MAGI is under $100k (phasing out to $0 by $150k); unused losses carry forward. On sale, claimed depreciation is recaptured at up to 25%, and gains may owe capital-gains tax (a 1031 exchange can defer both). Figures are a year-1 estimate at your 24.0% rate — not tax advice; consult a CPA.
Condition & rehab AI · 12 photos
This investor-friendly townhouse in Miami Shores is in good condition with minimal updates needed to maximize its value. The property is currently leased, offering immediate cash flow and potential for rental appreciation.
Value-add opportunities
- Both Painting and updating appliances — Enhances curb appeal and interior aesthetics, attracting more buyers/renters.
- Both Landscaping improvements — Enhances curb appeal and adds value to the property.
Renovation cost estimate screening
Value-add ROI direction
- Both Painting and updating appliances — Enhances curb appeal and interior aesthetics, attracting more buyers/renters. ↑
- Both Landscaping improvements — Enhances curb appeal and adds value to the property. ↑
ⓘ Cost ranges are severity-bucket heuristics (US national rule-of-thumb). Get contractor quotes + a written scope before underwriting a rehab budget.
Schools (NCES district)
- District
- Miami-Dade
- NCES district ID
- 1200390
- Math proficiency
- 45% ▼ -16.00%
- Reading proficiency
- 54% ▼ -5.00%
- Median HH income
- $43,928
- Composite
- 41.76/100
- National rank
- #3397
- State rank
- #40 of 73 in FL
Livability — Miami Shores
- Score
- 80/100
- State rank
- #130
- US rank
- #1936
Category grades
Schools grade is shown separately in the Schools card above.
Census & demographics
- Census place
- Miami Shores, FL
- County
- Miami-Dade County · 2,697,751 people
- Metro
- Miami-Fort Lauderdale-Pompano Beach, FL
- Population (ZIP)
- 28,980
- Household income
- $75,051
- Rent vs Own
- Severe rent burden
- 2049.0
Population outlook (Miami-Dade County) Hauer SSP2
- Today (2025)
- 3,126,439 people
- By 2030
- 3,325,765 · +6.4%
- By 2040
- 3,697,561 · +18.3%
- By 2050
- 4,012,134 · +28.3%
- By 2075
- 4,605,612 · +47.3%
- By 2100
- 4,866,598 · +55.7%
Race, ethnicity, and origin ACS 2023
- Neighborhood character
- Highly diverse neighborhood (Simpson 0.70)
- Race & ethnicity
- Hispanic / Latino 36% White 29% Black 29% Two or more races 21% Asian 1%
- Hispanic origin (detail)
- Puerto Rican 3% Cuban 11% Dominican 2% Salvadoran 3%
- Common ancestry
- Hispanic 16% Estonian 2% Lithuanian 2%
- Foreign-born
- 41% · Canada, Jamaica, Dominican Republic
- Languages at home
- 36% English-only · Spanish 39% French/Haitian/Cajun 19% Other Indo-European 4%
Political lean MEDSL · Miami-Dade
- 2024 margin
- R (+11.4) · D 43.9% · R 55.4%
- 2008→2024 swing
- -27.6pp toward R · 2008: 16.1pp · 2024: -11.4pp
- All cycles
- 2024: R+11.4 2020: D+7.3 2016: D+29.6 2012: D+23.7 2008: D+16.1
Not yet ingested
- Civics
- —
Market trends
- HPI YoY
- ▼ -890.01%
- Current HPI
- 551.4791
- Rent YoY
- ▲ 0.33%
- Metro
- Miami-Fort Lauderdale-Pompano Beach, FL
- State GDP YoY
- ▲ 3.28%
- F500 in state
- 36
Industry mix (Fortune 500 HQ in FL)
| Industry | F500 HQs | Revenue |
|---|---|---|
| Industrial Technology | 2 | $29B |
|
||
| Insurance | 2 | $17B |
|
||
| Retail | 1 | $60B |
|
||
| Technology Distribution | 1 | $58B |
|
||
| Homebuilding | 1 | $35B |
|
||
| Technology Manufacturing | 1 | $35B |
|
||
Price history
1 event — show timeline
- 2026-05-09 Listed $265,000 MARMLS
Cash-flow waterfall
monthlySold comps — $/sqft
last 12 mo · ≤1 miLoading sold comps…