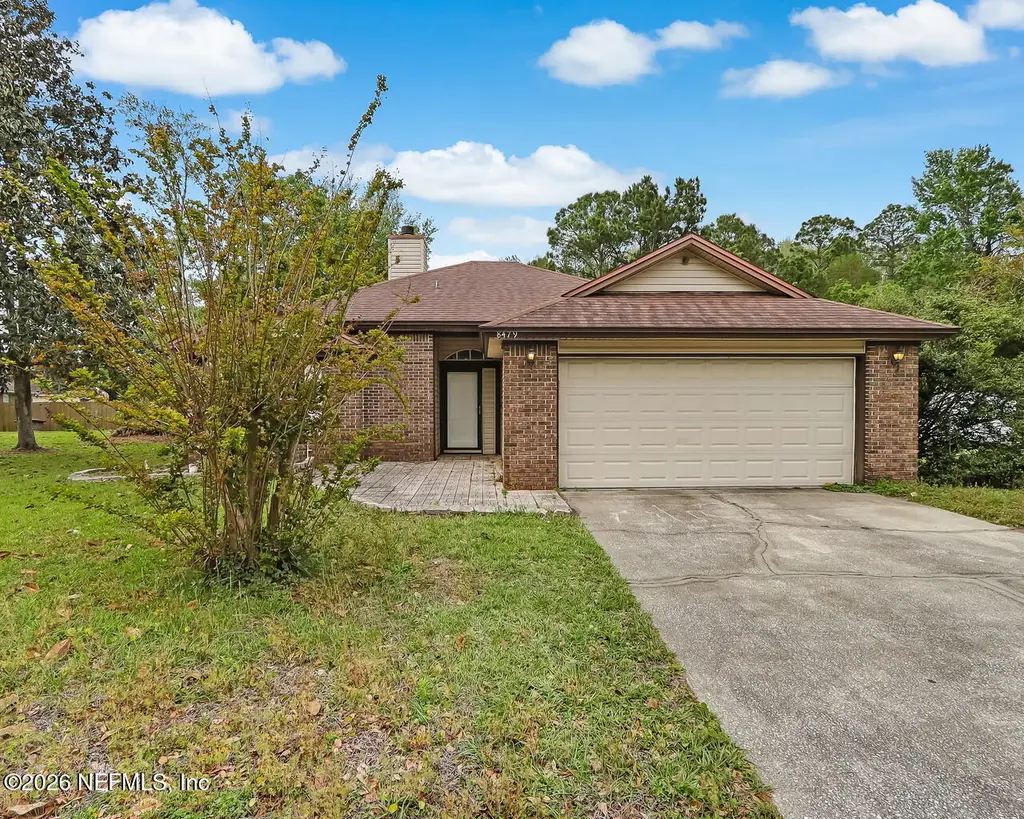
8479 Three Creeks Blvd · Jacksonville, FL
Flood risk 1/10 · Minimal
- FEMA flood zone
- X (unshaded)
- Chance of flooding over 30 yrs
- 0.0%
- Est. flood insurance / yr
- $507 – $1,088
Fire risk 4/10 · Minor
- Est. fire insurance / yr
- $947 – $1,759
Heat risk 8/10 · Major
- Hot days now (above 107°F)
- 7 days/yr
- Hot days in 30 yrs
- 20 days/yr
Wind risk 9/10 · Severe
- Chance of severe wind over 30 yrs
- 99.0%
Air-quality risk 5/10 · Moderate
- Unhealthy air days now
- 6 days/yr
- Unhealthy air days in 30 yrs
- 7 days/yr
Risk factors via First Street. Map © Google.
Why this score? — see what drove the D+ grade
The composite is a weighted blend of 9 inputs, each scored 0–100. Each bar is that input's sub-score; the figure is the points it added to the 100-point composite (weight × sub-score).
- Cash flow +15.3/30.0
- ARV discount +11.3/15.0
- DSCR +4.7/10.0
- Livability +4.2/5.0
- 1% rule +4.0/10.0
- Schools +3.9/10.0
- Rent growth +2.5/5.0
- Condition / age +2.5/5.0
- Appreciation +0.0/10.0
$209,000
🖨 Deal sheet 📄 Offer letter ✓ Due diligence
Listing remarks MLS
Gorgeous! Spacious floor plan, large lot and a beautiful water front deck await! Beautiful fireplace and fabulous kitchen! This 2 bedroom to bath is too good to last- Come see it today! Property eligible under Freddie Mac First Look Initiative through 5/15/16. Sold As-Is. Seller/Agent makes no representations/warranties expressed/implied as to condition of property.
Key facts
- Spacious yard
- Move-in ready
- Waterfront pond view
Tags
Property features AI
Finance
- HOA & community: Homeowners association with an annual fee of $176; Not a senior community
Exterior
- Parking: Attached garage; 2 garage spaces; Off-street parking; On-street parking
- Utilities: Public sewer; Electricity connected; Sewer connected; Water connected
- Home design: Single-family residence; One story; Entry level: 1
- Construction: Brick and vinyl siding construction; Shingle roof
- Exterior features: Covered patio; Deck; Rear porch; Screened porch; Wood fencing in back yard; Pond on the property; Shed(s)
Interior
- Kitchen: Dishwasher; Electric range; Refrigerator; Eat-in kitchen
- Bedrooms: 2 bedrooms
- Flooring: Vinyl flooring
- Bathrooms: 2 full bathrooms
- Heating & cooling: Central electric heating; Central air conditioning
- Interior features: Breakfast bar; Built-in features; Ceiling fans; Open floorplan; Pantry; Primary bathroom with tub/shower
- Laundry & utility: In-unit laundry with washer and electric dryer hookups
Neighborhood map
What this means for you Summary
Snapshot
- This is a 3-bed/2.0-bath single-family listed at $209k.
Deal economics
- At list price, monthly cash flow is $77 ($928/yr) — positive.
- The deal already cash-flows at list — no discount required.
- To meet the 1% rule (rent ≥ 1% of price), the offer needs to be $188k (9.9% below list).
- Recommended offer: $188k (9.9% below list) — sets the bar for 1% rule.
- Cap rate 6.7% vs local median 4.0% in Jacksonville — top-decile yield for the area; either an underpriced asset or a hidden risk that comps aren't pricing in. Stress-test before assuming the spread holds.
Location & tenants
- Location reads 83/100 on livability (#50 in FL, #911 nationally) — a professional / high-income tenant draw. Strengths: amenities A+, commute A+, housing A+.
- Duval (urban): math 46% / reading 45% proficiency, ranked #48 of 73 in FL (top 66%) — families likely to look elsewhere, expect single-tenant / working-renter base with shorter leases.
- Market conditions: 107 active listings in the ZIP; 5 comparable units currently listed for rent nearby; rentals at typical pace (median 17d on market — plan ~3-4 weeks tenant-placement turnaround); solid renter incomes; 6,503 units permitted in Duval County in 2024 (1,131 in 5+ unit buildings).
Forward outlook
- Local home prices are declining (-3.0%/yr); year-one equity from $1k of loan paydown is wiped out by about $6k of value loss. Plan a longer hold.
- Duval County population projected at +19% by 2050 — long-run rental-demand tailwind backs the buy-and-hold thesis.
Negotiation context
- It's been on market 27 days — a 2% lower offer ($206k) is reasonable based on typical stale-listing flexibility.
- 2 sale attempts since 10y ago with the ask held roughly flat each time — persistent listings suggest the price (not the market) is what's stuck; bring a comps-based counter.
- Current owner paid $170k; 23% above their basis — modest negotiation headroom, anchor on the comps not their cost.
Risks & watch-outs
- Climate carrying-cost: severe wind risk, 99% chance of damaging wind over 30y; extreme-heat days projected 7→20/yr by 2055 (HVAC capex compounding) — expect insurance premiums to compound above CPI over the hold.
Questions for the listing agent
- What does the HOA fee cover, when was the last increase, and are there any pending special assessments or reserve-fund shortfalls?
- Is there a deadline driving the sale (1031 exchange, divorce, estate, relocation)? That informs how much negotiation room exists.
- Schools are B-rated — typically a magnet for longer-tenancy family renters. What's the average tenant stay here, and is there a school-zone premium baked into asking?
- The area grade is low — what's the realistic commute time and amenity access for the typical tenant pool here? Any planned neighborhood developments (good or bad) we should know about?
- What's the average days-on-market for RENTAL listings here right now (not sales)? A rising rental-DOM trend means longer vacancies and softer asking-rent achievability than the comps imply.
- What's the recent tenant-quality profile in this submarket — average credit score on applications, eviction rate, late-payment / NSF rate, and stable-employment percentage? A property-management company in the area should have these aggregated.
- How much new for-sale + rental construction is in the pipeline within 1–3 miles? Heavy new supply typically softens prices + rents 12–24 months out; constrained supply supports both.
Investment metrics
- 1% rule
- 0.90% ✗
- Cap rate
- 6.74%
- Cash-on-cash
- 1.59%
- DSCR
- 1.07
- GRM
- 9.2
CMA / ARV
- ARV (on-the-fly)
- $228,126
- Comps found
- 12
Show comp detail 12 sales within ~0.75 mi
| Address | Dist | Beds/Ba | Sqft | Sold | Price | $/sf | Match |
|---|---|---|---|---|---|---|---|
| 8479 Three Creeks Blvd | 0.00mi | 2/2.0 (-1) | 1,182 (0%) | 1mo | $214,000 | $181 | 94 |
| 107 Devoe St | 0.11mi | 3/2.0 | 1,190 (+1%) | 6mo | $210,000 | $176 | 88 |
| 152 Devoe St | 0.05mi | 3/2.0 | 1,280 (+8%) | 10mo | $275,000 | $215 | 75 |
| 8551 Lori Ann Ct | 0.16mi | 3/2.0 | 1,294 (+10%) | 3mo | $280,000 | $216 | 75 |
| 8471 Three Creeks Blvd | 0.01mi | 3/2.0 | 1,332 (+13%) | 5mo | $230,000 | $173 | 74 |
| 8131 Oklahoma St | 0.55mi | 3/2.0 | 1,209 (+2%) | 8mo | $245,020 | $203 | 64 |
| 8051 Driggers St | 0.64mi | 3/2.0 | 1,200 (+2%) | 7mo | $213,303 | $178 | 62 |
| 8045 Driggers St | 0.65mi | 3/2.0 | 1,209 (+2%) | 10mo | $244,900 | $203 | 58 |
| 8057 Driggers St | 0.63mi | 3/2.0 | 1,209 (+2%) | 11mo | $244,900 | $203 | 58 |
| 8341 Colville St | 0.59mi | 3/1.0 | 1,254 (+6%) | 3mo | $130,000 | $104 | 56 |
| 461 Hammond Blvd | 0.57mi | 3/2.0 | 1,032 (-13%) | 2mo | $199,000 | $193 | 51 |
| 8146 Hammond Blvd | 0.60mi | 2/1.0 (-1) | 1,116 (-6%) | 4mo | $170,000 | $152 | 50 |
Match score weights: distance 35% · size 25% · config 20% · recency 20%. Top-matched comps best support the ARV.
Projected returns pro-forma
-3.0% appreciation · 3.0% rent growth · sell at horizon
- IRR
- -13.8%
- Equity multiple
- 0.51×
- Total profit
- $-28,933
- Equity at exit
- $31,163
- IRR
- -4.9%
- Equity multiple
- 0.68×
- Total profit
- $-18,819
- Equity at exit
- $18,071
Cash invested: $58,520 (down + closing). Projections, not guarantees.
Landlord ↔ Tenant lean methodology
- Overall (STATE)
- 87 Strongly Landlord-Friendly
- State Florida
- 87 Strongly Landlord-Friendly · R+3
- County
- — inherits STATE
- City
- — inherits STATE
ZIP-level market 32220
- Home prices YoY
- -18.1%
- Active inventory
- 107
- Price-to-rent
- 9.2×
Monthly cashflow live
- Estimated rent
- $1,884 high interval (Pro) →
- Mortgage (P&I)
- −$1,096
- Tax from tax record
- −$213 /mo · $2,554/yr
- Insurance
- −$87
- HOA
- −$15
- Vacancy / Maint / Mgmt
- −$396
- Net cashflow
- $77
Break-even live
UW: 25.0% down · 7.5% · 30yr · 1.5% tax · 5.0% vac · 8.0% maint · 8.0% mgmt
Financing live
Cash to close
- Down payment
- $52,250
- Closing costs
- $6,270
- Reserves months
- —
- Total cash needed
- —
Loan-product check · same deal, 3 products live
Conventional
25% down · 7.5% · 30yr
- Down + closing
- —
- Monthly P&I
- —
- Monthly cashflow
- —
- DSCR
- —
- Eligible?
- —
Personal DTI + credit; lowest rate.
DSCR
20% down · 8.5% · 30yr
- Down + closing
- —
- Monthly P&I
- —
- Monthly cashflow
- —
- DSCR
- —
- Eligible?
- —
No personal income docs; deal must DSCR.
Hard money
10% down · 12.0% · 12mo
- Down + closing
- —
- Monthly P&I
- —
- Monthly cashflow
- —
- DSCR
- —
- Eligible?
- —
Short-term bridge; refi at stabilization.
Rent comps 5 comps
| Address | Beds | Baths | Sqft | Rent | $/sqft | DOM | Units | Dist |
|---|---|---|---|---|---|---|---|---|
| 8331 Old Plank Rd Jacksonville, FL | 3.0 | 2.0 | 1080 | $1,595 | $1.48 | 17d | 1 | 0.58mi |
| 8054 Paschal St Jacksonville, FL | 4.0 | 1.0 | 1192 | $1,850 | $1.55 | 23d | 1 | 0.81mi |
| 7847 Mariner St Jacksonville, FL | 3.0 | 2.0 | 1209 | $1,599 | $1.32 | 23d | 1 | 0.98mi |
| 7841 Mariner St Jacksonville, FL | 3.0 | 2.0 | 1209 | $1,625 | $1.34 | 17d | 1 | 0.99mi |
| 8054 Graff Ln Jacksonville, FL | 3.0 | 2.0 | 1117 | $1,699 | $1.52 | 1d | 1 | 1.37mi |
HOA detail
- Monthly dues
- $15 · $180/yr
- Likely covers
- water
Listing history 9 events
-
2026-05-18status Pending
-
2026-05-03historical Active Under Contract
-
2026-04-21$209,000 Active
-
2025-05-29soldstatus $170,200
-
2016-07-29soldstatus $112,000 Sold 368-char remark
Show marketing remark (368 chars)
Gorgeous! Spacious floor plan, large lot and a beautiful water front deck await! Beautiful fireplace and fabulous kitchen! This 2 bedroom to bath is too good to last- Come see it today! Property eligible under Freddie Mac First Look Initiative through 5/15/16. Sold As-Is. Seller/Agent makes no representations/warranties expressed/implied as to condition of property.
-
2016-06-03status Pending 368-char remark
Show marketing remark (368 chars)
Gorgeous! Spacious floor plan, large lot and a beautiful water front deck await! Beautiful fireplace and fabulous kitchen! This 2 bedroom to bath is too good to last- Come see it today! Property eligible under Freddie Mac First Look Initiative through 5/15/16. Sold As-Is. Seller/Agent makes no representations/warranties expressed/implied as to condition of property.
-
2016-04-26$114,900 Active 368-char remark
Show marketing remark (368 chars)
Gorgeous! Spacious floor plan, large lot and a beautiful water front deck await! Beautiful fireplace and fabulous kitchen! This 2 bedroom to bath is too good to last- Come see it today! Property eligible under Freddie Mac First Look Initiative through 5/15/16. Sold As-Is. Seller/Agent makes no representations/warranties expressed/implied as to condition of property.
-
1992-08-13soldstatus $61,000
-
1992-05-01soldstatus $10,500
ⓘ Source: listings_history table (triggers on properties + properties_extension) + one-shot
backfill from property_details.listing_events for pre-trigger history.
Tax reassessment forecast FL · Resets to sale price
- Current annual tax
- $2,554 · $213/mo
- Projected year-2 tax
- $2,554 · $213/mo
- Expected delta
- $0/yr ($0/mo · 0.0%)
ⓘ Screening estimate from a state-policy table — verify with the county assessor before closing.
Climate risk First Street
- Flood 1/10 Low FEMA zone X (unshaded) · 0% chance over 30 yrs
- Wildfire 4/10 Moderate
- Heat 8/10 Severe 7 d/yr ≥107°F today · 20 d/yr by 30 yrs out
- Wind 9/10 Extreme 99% chance of damaging wind over 30 yrs
- Air quality 5/10 Major 6 unhealthy d/yr today · 7 by 30 yrs out
Nearby sold comps map
Loading sold comps map…
Walkable amenities ~0.75 mi
Loading nearby amenities…
Taxation est. · year 1
- Rental income
- $22,606
- − Mortgage interest
- −$11,707
- − Property taxes
- −$2,554
- − Insurance
- −$1,045
- − Repairs & maintenance
- −$1,809
- − Management
- −$1,809
- − HOA
- −$180
- − Depreciation
- −$6,080
- Taxable loss
- −$2,577
- Est. tax savings @ 24.0%
- +$618
- After-tax cash flow
- $1,547/yr
For passive investors: Depreciation is non-cash, so a rental often shows a tax loss while cash-flowing — sheltering income. Rental losses are passive: they offset passive income freely, and up to $25,000/yr can offset ordinary (W-2) income if you actively participate and your MAGI is under $100k (phasing out to $0 by $150k); unused losses carry forward. On sale, claimed depreciation is recaptured at up to 25%, and gains may owe capital-gains tax (a 1031 exchange can defer both). Figures are a year-1 estimate at your 24.0% rate — not tax advice; consult a CPA.
Schools (NCES district)
- District
- Duval
- NCES district ID
- 1200480
- Math proficiency
- 46% ▼ -11.00%
- Reading proficiency
- 45% ▼ -4.00%
- Median HH income
- $48,987
- Composite
- 38.97/100
- National rank
- #4076
- State rank
- #48 of 73 in FL
Livability — Jacksonville
- Score
- 83/100
- State rank
- #50
- US rank
- #911
Category grades
Schools grade is shown separately in the Schools card above.
Census & demographics
- Census place
- Jacksonville, FL
- County
- Duval County · 1,015,274 people
- City population
- 979,034
- Metro
- Jacksonville, FL
- Population (ZIP)
- 12,298
- Household income
- $81,792
- Rent vs Own
- Severe rent burden
- 177.0
Population outlook (Duval County) Hauer SSP2
- Today (2025)
- 1,013,010 people
- By 2030
- 1,059,228 · +4.6%
- By 2040
- 1,141,439 · +12.7%
- By 2050
- 1,205,258 · +19.0%
- By 2075
- 1,324,282 · +30.7%
- By 2100
- 1,319,620 · +30.3%
Race, ethnicity, and origin ACS 2023
- Neighborhood character
- Diverse neighborhood (Simpson 0.58)
- Race & ethnicity
- White 61% Black 19% Hispanic / Latino 11% Two or more races 11% Asian 5%
- Hispanic origin (detail)
- Cuban 7%
- Common ancestry
- Italian 2% Slovak 1% Portuguese 1%
- Foreign-born
- 8% · Canada
- Languages at home
- 95% English-only · Spanish 4% Arabic 1%
Political lean MEDSL · Duval
- 2024 margin
- Toss-up / Even · D 48.7% · R 50.1% · Other 1.2%
- 2008→2024 swing
- +0.4pp no change · 2008: -1.9pp · 2024: -1.5pp
- All cycles
- 2024: R+1.5 2020: D+3.8 2016: R+1.5 2012: R+3.6 2008: R+1.9
Not yet ingested
- Civics
- —
Market trends
- HPI YoY
- ▼ -64.90%
- Current HPI
- 293.7943
- Rent YoY
- —
- Metro
- Jacksonville, FL
- State GDP YoY
- ▲ 3.28%
- F500 in state
- 36
Industry mix (Fortune 500 HQ in FL)
| Industry | F500 HQs | Revenue |
|---|---|---|
| Industrial Technology | 2 | $29B |
|
||
| Insurance | 2 | $17B |
|
||
| Retail | 1 | $60B |
|
||
| Technology Distribution | 1 | $58B |
|
||
| Homebuilding | 1 | $35B |
|
||
| Technology Manufacturing | 1 | $35B |
|
||
Price history
+1890.5% since first listed9 events — show timeline
- 2026-05-18 Pending — realMLS
- 2026-05-03 Contingent — realMLS
- 2026-04-21 Listed $209,000 realMLS
- 2025-05-29 Sold (Public Records) $170,200 Public Records
- 2016-07-29 Sold (MLS) $112,000 realMLS
- 2016-06-03 Pending — realMLS
- 2016-04-26 Listed $114,900 realMLS
- 1992-08-13 Sold (Public Records) $61,000 Public Records
- 1992-05-01 Sold (Public Records) $10,500 Public Records
Property tax history
+10.1%/yrLatest (2025): $2,554 · +10.0% YoY. Source: county tax records.
Cash-flow waterfall
monthlySold comps — $/sqft
last 12 mo · ≤1 miLoading sold comps…