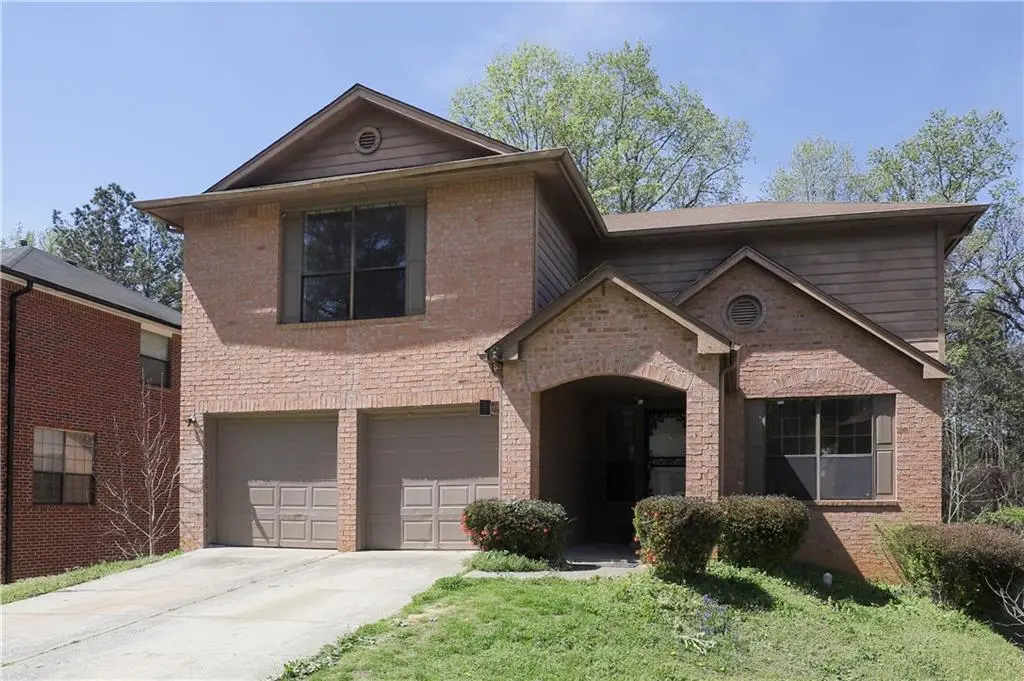
7043 Ivy Pointe Row · Lithia Springs, GA
Flood risk 4/10 · Minor
- FEMA flood zone
- X (unshaded)
- Chance of flooding over 30 yrs
- 0.22%
- Est. flood insurance / yr
- $473 – $860
Fire risk 1/10 · Minimal
- Est. fire insurance / yr
- $963 – $1,789
Heat risk 6/10 · Moderate
- Hot days now (above 103°F)
- 7 days/yr
- Hot days in 30 yrs
- 19 days/yr
Wind risk 5/10 · Moderate
- Chance of severe wind over 30 yrs
- 25.0%
Air-quality risk 4/10 · Minor
- Unhealthy air days now
- 4 days/yr
- Unhealthy air days in 30 yrs
- 5 days/yr
Risk factors via First Street. Map © Google.
Why this score? — see what drove the D- grade
The composite is a weighted blend of 9 inputs, each scored 0–100. Each bar is that input's sub-score; the figure is the points it added to the 100-point composite (weight × sub-score).
- ARV discount +15.0/15.0
- Cash flow +8.2/30.0
- Schools +3.8/10.0
- Livability +3.1/5.0
- Rent growth +2.7/5.0
- Condition / age +2.5/5.0
- 1% rule +2.3/10.0
- DSCR +2.2/10.0
- Appreciation +0.0/10.0
$309,000
🖨 Deal sheet 📄 Offer letter ✓ Due diligence
Listing remarks MLS
Spacious Single Family Home featuring 5 bedrooms and 3.5 bathrooms, totaling approximately 3100+ sqft, a fully finished basement with a kitchenette and a full bathroom. Large master suite with walk-in closet in the upper level with two other spacious secondary bedrooms. Three side brick, two car garage, fenced in backyard for privacy. No HOA. perfect home for first time buyer, large families or investors. Close to transportation and I-20. Sold AS-IS with no disclosures.
Key facts
- 7,871 sq ft lot
- 2 garage spots
- Built 1988
Neighborhood map
What this means for you Summary
Snapshot
- This is a 4-bed/3.5-bath single-family listed at $309k.
Deal economics
- At list price, monthly cash flow is $-292 ($-4k/yr) — negative.
- To cash-flow at today's rent, offer at most $257k (16.7% below list).
- To meet the 1% rule (rent ≥ 1% of price), the offer needs to be $227k (26.7% below list).
- Recommended offer: $227k (26.7% below list) — sets the bar for 1% rule.
Location & tenants
- Location reads 62/100 on livability (#311 in GA) — a middle-class / working-renter tenant base. Strengths: cost of living A+, housing A+; Watch: crime C-, employment C-, schools F.
- Cobb County (suburban): math 39% / reading 45% proficiency, ranked #25 of 174 in GA (top 14%) — families likely to look elsewhere, expect single-tenant / working-renter base with shorter leases.
- Market conditions: Rents flat; 126 active listings in the ZIP; 10 comparable units currently listed for rent nearby; rentals at typical pace (median 25d on market — plan ~3-4 weeks tenant-placement turnaround); 1,625 units permitted in Cobb County in 2024 (389 in 5+ unit buildings).
- This rent runs 42% of the median local income ($64k/yr) — at the standard rent-burdened threshold; future hikes will face affordability resistance.
Forward outlook
- Local home prices are declining (-3.0%/yr); year-one equity from $2k of loan paydown is wiped out by about $9k of value loss. Plan a longer hold.
- Cobb County population projected at +33% by 2050 — long-run rental-demand tailwind backs the buy-and-hold thesis.
Negotiation context
- It's been on market 85 days — a 6% lower offer ($290k) is reasonable based on typical stale-listing flexibility.
- 4 sale attempts since 17y ago with the ask held roughly flat each time — persistent listings suggest the price (not the market) is what's stuck; bring a comps-based counter.
- Current owner paid $45k; list at $309k implies a 587% gain — meaningful room to come down on a strong offer.
Risks & watch-outs
- Climate carrying-cost: moderate wind risk, 25% chance of damaging wind over 30y; extreme-heat days projected 7→19/yr by 2055 (HVAC capex compounding) — expect insurance premiums to compound above CPI over the hold.
Questions for the listing agent
- What do current leases actually rent for vs. the listed asking? Can we see a recent rent roll and the last 12 months of T-12 income?
- It's been on market 85 days. Have you received any prior offers? Is the seller open to a 27% concession, seller financing, or rate buy-down credit?
- Why hasn't it sold? Are there any deal-killer items the seller is aware of (foundation, flood, title, zoning, code violations)?
- Is there a deadline driving the sale (1031 exchange, divorce, estate, relocation)? That informs how much negotiation room exists.
- Schools are F-rated, which usually means shorter tenancies and higher turnover. Who's the typical renter profile here, and what's been the actual vacancy rate?
- The area grade is low — what's the realistic commute time and amenity access for the typical tenant pool here? Any planned neighborhood developments (good or bad) we should know about?
- What's the average days-on-market for RENTAL listings here right now (not sales)? A rising rental-DOM trend means longer vacancies and softer asking-rent achievability than the comps imply.
- What's the recent tenant-quality profile in this submarket — average credit score on applications, eviction rate, late-payment / NSF rate, and stable-employment percentage? A property-management company in the area should have these aggregated.
- How much new for-sale + rental construction is in the pipeline within 1–3 miles? Heavy new supply typically softens prices + rents 12–24 months out; constrained supply supports both.
Investment metrics
- 1% rule
- 0.73% ✗
- Cap rate
- 5.16%
- Cash-on-cash
- -4.05%
- DSCR
- 0.82
- GRM
- 11.4
CMA / ARV
- ARV (median comp)
- $372,693
- List price
- $309,000
- Delta
- -17.09%
- Verdict
- UNDERPRICED
- Comps
- 20 within 1.0 mi
Show comp detail 6 sales within ~0.75 mi
| Address | Dist | Beds/Ba | Sqft | Sold | Price | $/sf | Match |
|---|---|---|---|---|---|---|---|
| 6563 Brandemere Way | 0.72mi | 4/3.0 | 2,886 (-8%) | 2mo | $377,000 | $131 | 50 |
| 1784 Brandemere Dr | 0.69mi | 4/2.5 | 2,804 (-10%) | 3mo | $370,000 | $132 | 44 |
| 1761 Brandemere Dr | 0.64mi | 4/2.5 | 2,776 (-11%) | 13mo | $355,000 | $128 | 36 |
| 1732 Brandemere Dr | 0.69mi | 4/2.5 | 2,776 (-11%) | 17mo | $392,500 | $141 | 31 |
| 1749 Brandemere Dr | 0.63mi | 4/2.5 | 2,798 (-11%) | 23mo | $385,995 | $138 | 30 |
| 1821 Brandemere Dr | 0.75mi | 5/3.0 (+1) | 2,861 (-9%) | 18mo | $382,000 | $134 | 29 |
Match score weights: distance 35% · size 25% · config 20% · recency 20%. Top-matched comps best support the ARV.
Projected returns pro-forma
-3.0% appreciation · 0.77% rent growth · sell at horizon
- IRR
- -25.6%
- Equity multiple
- 0.15×
- Total profit
- $-73,658
- Equity at exit
- $46,073
- IRR
- -30.5%
- Equity multiple
- -0.24×
- Total profit
- $-107,616
- Equity at exit
- $26,717
Cash invested: $86,520 (down + closing). Projections, not guarantees.
Landlord ↔ Tenant lean methodology
- Overall (STATE)
- 90 Strongly Landlord-Friendly
- State Georgia
- 90 Strongly Landlord-Friendly · R+3
- County
- — inherits STATE
- City
- — inherits STATE
ZIP-level market 30168
- Home prices YoY
- -25.5%
- Rents YoY
- 0.8%
- Active inventory
- 126
- Price-to-rent
- 11.4×
Monthly cashflow live
- Estimated rent
- $2,265 high interval (Pro) →
- Mortgage (P&I)
- −$1,620
- Tax from tax record
- −$333 /mo · $3,991/yr
- Insurance
- −$129
- HOA
- −$0
- Vacancy / Maint / Mgmt
- −$476
- Net cashflow
- $-292
Break-even live
UW: 25.0% down · 7.5% · 30yr · 1.5% tax · 5.0% vac · 8.0% maint · 8.0% mgmt
Financing live
Cash to close
- Down payment
- $77,250
- Closing costs
- $9,270
- Reserves months
- —
- Total cash needed
- —
Loan-product check · same deal, 3 products live
Conventional
25% down · 7.5% · 30yr
- Down + closing
- —
- Monthly P&I
- —
- Monthly cashflow
- —
- DSCR
- —
- Eligible?
- —
Personal DTI + credit; lowest rate.
DSCR
20% down · 8.5% · 30yr
- Down + closing
- —
- Monthly P&I
- —
- Monthly cashflow
- —
- DSCR
- —
- Eligible?
- —
No personal income docs; deal must DSCR.
Hard money
10% down · 12.0% · 12mo
- Down + closing
- —
- Monthly P&I
- —
- Monthly cashflow
- —
- DSCR
- —
- Eligible?
- —
Short-term bridge; refi at stabilization.
Rent comps 10 comps
| Address | Beds | Baths | Sqft | Rent | $/sqft | DOM | Units | Dist |
|---|---|---|---|---|---|---|---|---|
| 1463 Devon Mill Way Austell, GA | 4.0 | 2.5 | 2340 | $2,050 | $0.88 | 24d | 1 | 0.45mi |
| 1330 Ling Dr Austell, GA | 3.0 | 2.0 | 2124 | $1,999 | $0.94 | 3d | 1 | 0.60mi |
| 6593 Dunwoody Trl Unit NA Austell, GA | 3.0 | 4.0 | 2112 | $2,000 | $0.95 | 43d | 1 | 0.68mi |
| 6613 Crossing Creek Pt Austell, GA | 3.0 | 2.5 | 2461 | $2,000 | $0.81 | 10d | 1 | 0.89mi |
| 800 Revena Dr Austell, GA | 4.0 | 2.5 | 2284 | $2,200 | $0.96 | 12d | 1 | 0.91mi |
| 1032 Winterglen Way Austell, GA | 3.0 | 2.5 | 3012 | $2,075 | $0.69 | 24d | 1 | 1.10mi |
| 1076 Timber Trl Austell, GA | 4.0 | 3.5 | 2235 | $2,540 | $1.14 | 4d | 1 | 1.11mi |
| 1068 S Gordon Rd Austell, GA | 4.0 | 3.0 | 3740 | $2,500 | $0.67 | 43d | 1 | 1.17mi |
| 7660 Forest Glen Way Lithia Springs, GA | 3.0 | 2.5 | 2573 | $2,396 | $0.93 | 2d | 1 | 1.44mi |
| 1083 Stoney Creek Ln Austell, GA | 3.0 | 2.0 | 2196 | $1,595 | $0.73 | 43d | 1 | 1.46mi |
Listing history 25 events
-
2026-06-18days on market $309,000 Active 85 DOM
-
2026-06-17days on market $309,000 Active 84 DOM
-
2026-06-16days on market $309,000 Active 83 DOM
-
2026-06-15days on market $309,000 Active 82 DOM
-
2026-06-13days on market $309,000 Active 80 DOM
-
2026-06-13days on market $309,000 Active 79 DOM
-
2026-06-09days on market $309,000 Active 76 DOM
-
2026-06-08days on market $309,000 Active 75 DOM
-
2026-06-07days on market $309,000 Active 74 DOM
-
2026-06-04days on market $309,000 Active 71 DOM
-
2026-06-03days on market $309,000 Active 70 DOM
-
2026-06-02days on market $309,000 Active 69 DOM
-
2026-06-01days on market $309,000 Active 68 DOM
-
2026-05-31days on market $309,000 Active 67 DOM
-
2026-04-16price $309,000 474-char remark
Show marketing remark (474 chars)
Spacious Single Family Home featuring 5 bedrooms and 3.5 bathrooms, totaling approximately 3100+ sqft, a fully finished basement with a kitchenette and a full bathroom. Large master suite with walk-in closet in the upper level with two other spacious secondary bedrooms. Three side brick, two car garage, fenced in backyard for privacy. No HOA. perfect home for first time buyer, large families or investors. Close to transportation and I-20. Sold AS-IS with no disclosures.
-
2026-03-25$325,000 Active 474-char remark
Show marketing remark (474 chars)
Spacious Single Family Home featuring 5 bedrooms and 3.5 bathrooms, totaling approximately 3100+ sqft, a fully finished basement with a kitchenette and a full bathroom. Large master suite with walk-in closet in the upper level with two other spacious secondary bedrooms. Three side brick, two car garage, fenced in backyard for privacy. No HOA. perfect home for first time buyer, large families or investors. Close to transportation and I-20. Sold AS-IS with no disclosures.
-
2020-11-20historical
-
2020-10-19status Back on Market
-
2020-09-18status Under Contract
-
2020-09-08$249,998 New
-
2010-12-08price $119,900 Increased
-
2010-11-16price $119,000 Reduced
-
2009-12-02soldstatus $45,000
-
2009-11-06$40,000
-
2006-01-12soldstatus $171,000
ⓘ Source: listings_history table (triggers on properties + properties_extension) + one-shot
backfill from property_details.listing_events for pre-trigger history.
Tax reassessment forecast GA · Resets to sale price
- Current annual tax
- $3,991 · $333/mo
- Projected year-2 tax
- $3,991 · $333/mo
- Expected delta
- $0/yr ($0/mo · 0.0%)
ⓘ Screening estimate from a state-policy table — verify with the county assessor before closing.
Climate risk First Street
- Flood 4/10 Moderate FEMA zone X (unshaded) · 22% chance over 30 yrs
- Wildfire 1/10 Low
- Heat 6/10 Major 7 d/yr ≥103°F today · 19 d/yr by 30 yrs out
- Wind 5/10 Major 25% chance of damaging wind over 30 yrs
- Air quality 4/10 Moderate 4 unhealthy d/yr today · 5 by 30 yrs out
Nearby sold comps map
Loading sold comps map…
Walkable amenities ~0.75 mi
Loading nearby amenities…
Taxation est. · year 1
- Rental income
- $27,182
- − Mortgage interest
- −$17,309
- − Property taxes
- −$3,991
- − Insurance
- −$1,545
- − Repairs & maintenance
- −$2,175
- − Management
- −$2,175
- − Depreciation
- −$8,989
- Taxable loss
- −$9,001
- Est. tax savings @ 24.0%
- +$2,160
- After-tax cash flow
- $-1,347/yr
For passive investors: Depreciation is non-cash, so a rental often shows a tax loss while cash-flowing — sheltering income. Rental losses are passive: they offset passive income freely, and up to $25,000/yr can offset ordinary (W-2) income if you actively participate and your MAGI is under $100k (phasing out to $0 by $150k); unused losses carry forward. On sale, claimed depreciation is recaptured at up to 25%, and gains may owe capital-gains tax (a 1031 exchange can defer both). Figures are a year-1 estimate at your 24.0% rate — not tax advice; consult a CPA.
Schools (NCES district)
- District
- Cobb County
- NCES district ID
- 1301290
- Math proficiency
- 39% ▼ -15.00%
- Reading proficiency
- 45% ▼ -10.00%
- Median HH income
- $68,845
- Composite
- 37.93/100
- National rank
- #4308
- State rank
- #25 of 174 in GA
Livability — Lithia Springs
- Score
- 62/100
- State rank
- #311
- US rank
- #16881
Category grades
Schools grade is shown separately in the Schools card above.
Census & demographics
- County
- Cobb County · 777,758 people
- City population
- 27,036
- Metro
- Atlanta-Sandy Springs-Alpharetta, GA
- Population (ZIP)
- 26,612
- Household income
- $64,059
- Rent vs Own
- Severe rent burden
- 993.0
Population outlook (Cobb County) Hauer SSP2
- Today (2025)
- 868,385 people
- By 2030
- 929,614 · +7.1%
- By 2040
- 1,047,533 · +20.6%
- By 2050
- 1,155,537 · +33.1%
- By 2075
- 1,405,030 · +61.8%
- By 2100
- 1,555,058 · +79.1%
Race, ethnicity, and origin ACS 2023
- Neighborhood character
- Diverse neighborhood (Simpson 0.55)
- Race & ethnicity
- Black 63% Hispanic / Latino 21% White 10% Two or more races 9% Asian 1%
- Hispanic origin (detail)
- Mexican 13%
- Common ancestry
- Italian 4% Hispanic 1%
- Foreign-born
- 19% · Canada
- Languages at home
- 74% English-only · Spanish 20% French/Haitian/Cajun 1% Other Indo-European 1%
Political lean MEDSL · Cobb
- 2024 margin
- D (+14.9) · D 56.9% · R 42.0% · Other 1.1%
- 2008→2024 swing
- +24.3pp toward D · 2008: -9.4pp · 2024: 14.9pp
- All cycles
- 2024: D+14.9 2020: D+14.3 2016: D+2.1 2012: R+12.6 2008: R+9.4
Not yet ingested
- Civics
- —
Market trends
- HPI YoY
- ▼ -84.55%
- Current HPI
- 246.7995
- Rent YoY
- ▲ 0.77%
- Metro
- Atlanta-Sandy Springs-Alpharetta, GA
- State GDP YoY
- ▲ 2.66%
- F500 in state
- 28
Industry mix (Fortune 500 HQ in GA)
| Industry | F500 HQs | Revenue |
|---|---|---|
| Paper / Packaging | 2 | $29B |
|
||
| Retail | 1 | $160B |
|
||
| Transportation / Logistics | 1 | $91B |
|
||
| Airlines | 1 | $62B |
|
||
| Consumer Goods | 1 | $47B |
|
||
| Utilities | 1 | $25B |
|
||
Price history
+80.7% since first listed11 events — show timeline
- 2026-04-16 Price Changed $309,000 FMLS
- 2026-03-25 Listed $325,000 FMLS
- 2020-11-20 Listing Removed — GAMLS
- 2020-10-19 Relisted — GAMLS
- 2020-09-18 Pending — GAMLS
- 2020-09-08 Listed $249,998 GAMLS
- 2010-12-08 Price Changed $119,900 GAMLS
- 2010-11-16 Price Changed $119,000 GAMLS
- 2009-12-02 Sold (MLS) $45,000 FMLS
- 2009-11-06 Listed $40,000 FMLS
- 2006-01-12 Sold (Public Records) $171,000 Public Records
Property tax history
+6.2%/yrLatest (2025): $3,991 · -0.1% YoY. Source: county tax records.
Cash-flow waterfall
monthlySold comps — $/sqft
last 12 mo · ≤1 miLoading sold comps…