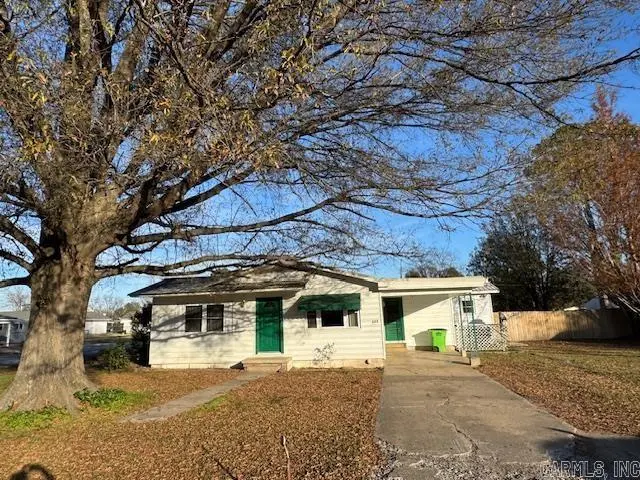
602 S Greenlaw St · Carlisle, AR
Flood risk No data
- FEMA flood zone
- —
- Chance of flooding over 30 yrs
- —
- Est. flood insurance / yr
- —
Fire risk No data
- Est. fire insurance / yr
- —
Heat risk No data
- Hot days now (above threshold)
- —
- Hot days in 30 yrs
- —
Wind risk No data
- Chance of severe wind over 30 yrs
- —
Air-quality risk No data
- Unhealthy air days now
- —
- Unhealthy air days in 30 yrs
- —
Risk factors via First Street. Map © Google.
Why this score? — see what drove the C+ grade
The composite is a weighted blend of 9 inputs, each scored 0–100. Each bar is that input's sub-score; the figure is the points it added to the 100-point composite (weight × sub-score).
- Cash flow +19.3/30.0
- ARV discount +15.0/15.0
- DSCR +6.1/10.0
- Appreciation +6.1/10.0
- 1% rule +5.1/10.0
- Livability +2.9/5.0
- Rent growth +2.5/5.0
- Condition / age +2.5/5.0
- Schools +2.2/10.0
$119,000
🖨 Deal sheet (PDF) 📄 Offer letter ✓ Due diligence
Listing remarks MLS
Price Reduced. Nice 3 bedroom, 2 bath home with 1898 sq. ft. The home has a metal roof on a spacious, tree-shaded corner lot with a privacy fence. This property features a dine-in kitchen, with a large main living area, and an additional great room. A glass-enclosed back porch is a nice place to relax. An extra-large 1593 sq. ft. detached garage/storage building, at the back of the lot, offers ample space for hobbies, workshops, or extra storage. With plenty of potential, this is an opportunity to make this home your own.
Key facts
- Dine-in kitchen
- Metal roof
- Privacy fence
Tags
Neighborhood map
What this means for you Summary
Snapshot
- This is a 3-bed/2.0-bath single-family listed at $119k.
Deal economics
- At list price, monthly cash flow is $130 ($2k/yr) — positive.
- The deal already cash-flows at list — no discount required.
- Meets the 1% rule at list price ($1k rent vs $119k).
- Recommended offer: $105k (12.0% below list) — sets the bar for market timing.
Location & tenants
- Location reads 57/100 on livability (#338 in AR) — a working-class tenant base; expect higher turnover. Strengths: cost of living A+, housing A-; Watch: crime D, schools F, amenities F.
- Carlisle School District (rural): math 26% / reading 26% proficiency, ranked #177 of 238 in AR (top 74%) — low school quality limits family demand, transient renter base, plan for 1-2y turnover.
- Market conditions: 15 active listings in the ZIP; 185 units permitted in Lonoke County in 2024 (0 in 5+ unit buildings).
Forward outlook
- In year one you build about $4k of equity ($823 loan paydown + $3k appreciation (2.3% local appreciation)).
- Lonoke County population projected at +12% by 2050 — modest demand growth; plan on rents tracking national, not racing it.
- At projected returns (2.3% appreciation + 3.0% rent growth), your $33k cash investment doubles in ~6 years — after that, you're playing with house money.
- By year 9, paydown + projected appreciation supports a ~$30k cash-out refi (75% LTV) — recoverable capital for the next deal without selling this one.
Negotiation context
- It's been on market 183 days — a 12% lower offer ($105k) is reasonable based on typical stale-listing flexibility.
Risks & watch-outs
- Watch-outs: built in 1950 — expect roof / HVAC / electrical / plumbing capex.
Questions for the listing agent
- It's been on market 183 days. Have you received any prior offers? Is the seller open to a 12% concession, seller financing, or rate buy-down credit?
- Built in 1950 — when were the roof, HVAC, electrical panel, plumbing, and water heater last replaced?
- Why hasn't it sold? Are there any deal-killer items the seller is aware of (foundation, flood, title, zoning, code violations)?
- Is there a deadline driving the sale (1031 exchange, divorce, estate, relocation)? That informs how much negotiation room exists.
- Schools are F-rated, which usually means shorter tenancies and higher turnover. Who's the typical renter profile here, and what's been the actual vacancy rate?
- Crime grade is D in this area — have there been break-ins, vandalism, or insurance claims at this property in the last 3 years? What carrier currently insures it and at what premium?
- What's the average days-on-market for RENTAL listings here right now (not sales)? A rising rental-DOM trend means longer vacancies and softer asking-rent achievability than the comps imply.
- What's the recent tenant-quality profile in this submarket — average credit score on applications, eviction rate, late-payment / NSF rate, and stable-employment percentage? A property-management company in the area should have these aggregated.
- How much new for-sale + rental construction is in the pipeline within 1–3 miles? Heavy new supply typically softens prices + rents 12–24 months out; constrained supply supports both.
Investment metrics
- 1% rule
- 1.01% ✓
- Cap rate
- 7.60%
- Cash-on-cash
- 4.67%
- DSCR
- 1.21
- GRM
- 8.2
CMA / ARV
- ARV (median comp)
- $147,660
- List price
- $119,000
- Delta
- -19.41%
- Verdict
- UNDERPRICED
- Comps
- 20 within 1.0 mi
Show comp detail 6 sales within ~0.75 mi
| Address | Dist | Beds/Ba | Sqft | Sold | Price | $/sf | Match |
|---|---|---|---|---|---|---|---|
| 115 Schafer Dr | 0.57mi | 3/2.0 | 2,026 (+7%) | 0mo | $110,000 | $54 | 62 |
| 204 Brinkley Ave | 0.52mi | 3/1.5 | 1,664 (-12%) | 2mo | $160,000 | $96 | 52 |
| 116 Mckinley Ave | 0.63mi | 4/2.0 (+1) | 1,773 (-7%) | 10mo | $140,000 | $79 | 46 |
| 307 E 5th | 0.62mi | 4/2.0 (+1) | 2,103 (+11%) | 4mo | $205,500 | $98 | 45 |
| 513 E 3rd St | 0.59mi | 3/2.0 | 1,647 (-13%) | 9mo | $168,000 | $102 | 43 |
| 105 Schafer Dr | 0.60mi | 3/2.5 | 1,706 (-10%) | 22mo | $208,500 | $122 | 35 |
Match score weights: distance 35% · size 25% · config 20% · recency 20%. Top-matched comps best support the ARV.
Projected returns pro-forma
2.29% appreciation · 3.0% rent growth · sell at horizon
- IRR
- 9.9%
- Equity multiple
- 1.55×
- Total profit
- $18,208
- Equity at exit
- $48,823
- IRR
- 12.8%
- Equity multiple
- 2.77×
- Total profit
- $58,928
- Equity at exit
- $71,783
Cash invested: $33,320 (down + closing). Projections, not guarantees.
Landlord ↔ Tenant lean methodology
- Overall (STATE)
- 92 Strongly Landlord-Friendly
- State Arkansas
- 92 Strongly Landlord-Friendly · R+14
- County
- — inherits STATE
- City
- — inherits STATE
ZIP-level market 72024
- Home prices YoY
- 1.5%
- Active inventory
- 15
- Price-to-rent
- 8.2×
Monthly cashflow live
- Estimated rent
- $1,205 medium interval (Pro) →
- Mortgage (P&I)
- −$624
- Tax est. 1.5%
- −$149 /mo · $1,785/yr
- Insurance
- −$50
- HOA
- −$0
- Vacancy / Maint / Mgmt
- −$253
- Net cashflow
- $130
Break-even live
Sensitivity live
| Price | -10% $212 | -5% $171 | +0% $130 | +5% $89 | +10% $47 |
|---|---|---|---|---|---|
| Rent | -10% $34 | -5% $82 | +0% $130 | +5% $177 | +10% $225 |
| Rate | -1.0pp $190 | -0.5pp $160 | base $130 | +0.5pp $99 | +1.0pp $67 |
UW: 25.0% down · 7.5% · 30yr · 1.5% tax · 5.0% vac · 8.0% maint · 8.0% mgmt
Financing live
Cash to close
- Down payment
- $29,750
- Closing costs
- $3,570
- Reserves months
- —
- Total cash needed
- —
Loan-product check · same deal, 3 products live
Conventional
25% down · 7.5% · 30yr
- Down + closing
- —
- Monthly P&I
- —
- Monthly cashflow
- —
- DSCR
- —
- Eligible?
- —
Personal DTI + credit; lowest rate.
DSCR
20% down · 8.5% · 30yr
- Down + closing
- —
- Monthly P&I
- —
- Monthly cashflow
- —
- DSCR
- —
- Eligible?
- —
No personal income docs; deal must DSCR.
Hard money
10% down · 12.0% · 12mo
- Down + closing
- —
- Monthly P&I
- —
- Monthly cashflow
- —
- DSCR
- —
- Eligible?
- —
Short-term bridge; refi at stabilization.
Listing history 18 events
-
2026-06-19days on market $119,000 Active 183 DOM
-
2026-06-18days on market $119,000 Active 182 DOM
-
2026-06-17days on market $119,000 Active 181 DOM
-
2026-06-16days on market $119,000 Active 180 DOM
-
2026-06-15days on market $119,000 Active 179 DOM
-
2026-06-14days on market $119,000 Active 177 DOM
-
2026-06-12days on market $119,000 Active 176 DOM
-
2026-06-09days on market $119,000 Active 173 DOM
-
2026-06-08days on market $119,000 Active 172 DOM
-
2026-06-07days on market $119,000 Active 171 DOM
-
2026-06-05days on market $119,000 Active 169 DOM
-
2026-06-04days on market $119,000 Active 167 DOM
-
2026-06-02days on market $119,000 Active 166 DOM
-
2026-06-01days on market $119,000 Active 165 DOM
-
2026-05-31days on market $119,000 Active 164 DOM
-
2026-05-31days on market $119,000 Active 163 DOM
-
2026-02-07price $120,000 527-char remark
Show marketing remark (527 chars)
Price Reduced. Nice 3 bedroom, 2 bath home with 1898 sq. ft. The home has a metal roof on a spacious, tree-shaded corner lot with a privacy fence. This property features a dine-in kitchen, with a large main living area, and an additional great room. A glass-enclosed back porch is a nice place to relax. An extra-large 1593 sq. ft. detached garage/storage building, at the back of the lot, offers ample space for hobbies, workshops, or extra storage. With plenty of potential, this is an opportunity to make this home your own.
-
2025-12-15$129,000 New Listing 527-char remark
Show marketing remark (527 chars)
Price Reduced. Nice 3 bedroom, 2 bath home with 1898 sq. ft. The home has a metal roof on a spacious, tree-shaded corner lot with a privacy fence. This property features a dine-in kitchen, with a large main living area, and an additional great room. A glass-enclosed back porch is a nice place to relax. An extra-large 1593 sq. ft. detached garage/storage building, at the back of the lot, offers ample space for hobbies, workshops, or extra storage. With plenty of potential, this is an opportunity to make this home your own.
ⓘ Source: listings_history table (triggers on properties + properties_extension) + one-shot
backfill from property_details.listing_events for pre-trigger history.
Nearby sold comps map
Loading sold comps map…
Walkable amenities ~0.75 mi
Loading nearby amenities…
Taxation est. · year 1
- Rental income
- $14,461
- − Mortgage interest
- −$6,666
- − Property taxes
- −$1,785
- − Insurance
- −$595
- − Repairs & maintenance
- −$1,157
- − Management
- −$1,157
- − Depreciation
- −$3,462
- Taxable loss
- −$360
- Est. tax savings @ 24.0%
- +$86
- After-tax cash flow
- $1,642/yr
For passive investors: Depreciation is non-cash, so a rental often shows a tax loss while cash-flowing — sheltering income. Rental losses are passive: they offset passive income freely, and up to $25,000/yr can offset ordinary (W-2) income if you actively participate and your MAGI is under $100k (phasing out to $0 by $150k); unused losses carry forward. On sale, claimed depreciation is recaptured at up to 25%, and gains may owe capital-gains tax (a 1031 exchange can defer both). Figures are a year-1 estimate at your 24.0% rate — not tax advice; consult a CPA.
Schools (NCES district)
- District
- Carlisle School District
- NCES district ID
- 0503960
- Math proficiency
- 26% ▼ -13.00%
- Reading proficiency
- 26% ▼ -14.00%
- Median HH income
- $44,474
- Composite
- 22.37/100
- National rank
- #8119
- State rank
- #177 of 238 in AR
Livability — Carlisle
- Score
- 57/100
- State rank
- #338
- US rank
- #21691
Category grades
Schools grade is shown separately in the Schools card above.
Census & demographics
- Census place
- Carlisle, AR
- Population (ZIP)
- 4,142
Population outlook (Lonoke County) Hauer SSP2
- Today (2025)
- 78,072 people
- By 2030
- 80,673 · +3.3%
- By 2040
- 84,977 · +8.8%
- By 2050
- 87,778 · +12.4%
- By 2075
- 91,398 · +17.1%
- By 2100
- 87,858 · +12.5%
Race, ethnicity, and origin ACS 2023
- Neighborhood character
- Predominantly White (90%)
- Race & ethnicity
- White 90% Black 6% Two or more races 4%
- Common ancestry
- Romanian 2% Lithuanian 2% Slovak 1%
- Foreign-born
- 0% · Canada
Political lean MEDSL · Lonoke
- 2024 margin
- Solid R (+53.7) · D 22.2% · R 75.8% · Other 2.0%
- 2008→2024 swing
- -6.2pp toward R · 2008: -47.5pp · 2024: -53.7pp
- All cycles
- 2024: R+53.7 2020: R+52.8 2016: R+53.3 2012: R+50.9 2008: R+47.5
Not yet ingested
- Civics
- —
Market trends
- HPI YoY
- ▲ 2.29%
- Current HPI
- 156.5743
- Rent YoY
- —
- Metro
- —
- State GDP YoY
- ▲ 3.80%
- F500 in state
- 10
Industry mix (Fortune 500 HQ in AR)
| Industry | F500 HQs | Revenue |
|---|---|---|
| Retail | 1 | $681B |
|
||
| Food / Agriculture | 1 | $53B |
|
||
| Retail / Energy | 1 | $22B |
|
||
| Transportation / Logistics | 1 | $12B |
|
||
| Energy | 1 | $4B |
|
||
Price history
-7.0% since first listed2 events — show timeline
- 2026-02-07 Price Changed $120,000 CARMLS
- 2025-12-15 Listed $129,000 CARMLS
Property tax history
-12.0%/yrLatest (2025): $41 · +0.0% YoY. Source: county tax records.
Cash-flow waterfall
monthlySold comps — $/sqft
last 12 mo · ≤1 miLoading sold comps…