128 W Cherry Dr · Petal, MS
Flood risk 9/10 · Severe
- FEMA flood zone
- X (shaded)
- Chance of flooding over 30 yrs
- 0.99%
- Est. flood insurance / yr
- $507 – $1,088
Fire risk 3/10 · Minor
- Est. fire insurance / yr
- $1,241 – $2,305
Heat risk 7/10 · Major
- Hot days now (above 106°F)
- 7 days/yr
- Hot days in 30 yrs
- 20 days/yr
Wind risk 8/10 · Major
- Chance of severe wind over 30 yrs
- 99.0%
Air-quality risk 1/10 · Minimal
- Unhealthy air days now
- 0 days/yr
- Unhealthy air days in 30 yrs
- 0 days/yr
Risk factors via First Street. Map © Google.
Why this score? — see what drove the C grade
The composite is a weighted blend of 9 inputs, each scored 0–100. Each bar is that input's sub-score; the figure is the points it added to the 100-point composite (weight × sub-score).
- Cash flow +16.3/30.0
- ARV discount +15.0/15.0
- Schools +5.3/10.0
- DSCR +5.0/10.0
- 1% rule +4.4/10.0
- Condition / age +3.8/5.0
- Livability +3.7/5.0
- Rent growth +2.5/5.0
- Appreciation +0.0/10.0
$135,000
🖨 Deal sheet 📄 Offer letter ✓ Due diligence
Listing remarks
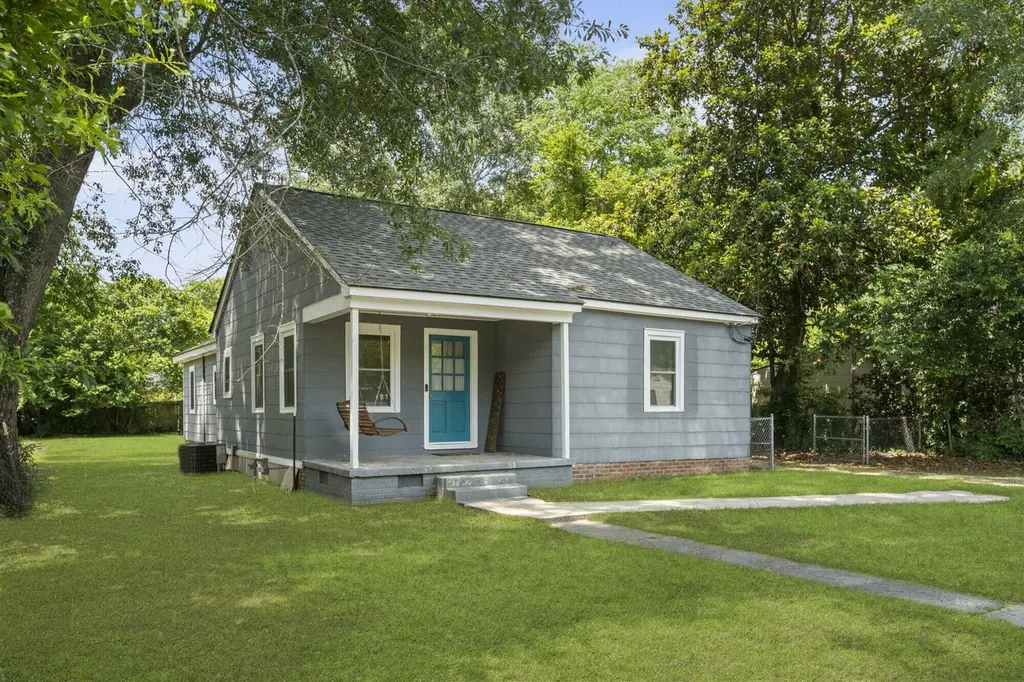
Cute updated 3 bed/2 bath 1950's cottage in the heart of Petal for under $150k! Updates include new flooring in the primary suite, refinished original hardwood floors in other parts of the home, and an updated kitchen. The location is convenient and within walking distance of anything downtown Petal has to offer.
Key facts
- Updated kitchen
- Built 1950
- Listed 10 days
Tags
Property features AI
Finance
- Other: Workshop on property; Lot approximately 0.27 acre
Exterior
- Parking: Driveway; No garage
- Utilities: Public water; Public sewer
- Home design: Single-family residence; One level; Raised foundation
- Construction: Cement siding
- Exterior features: Storage; Covered front porch
Interior
- Flooring: Wood flooring; Vinyl flooring; Ceramic tile flooring
- Bathrooms: 2 full bathrooms
- Heating & cooling: Central air conditioning
- Interior features: Ceiling fan(s)
Neighborhood map
What this means for you Summary
Snapshot
- This is a 3-bed/2.0-bath single-family listed at $135k. Condition is rated good.
Deal economics
- At list price, monthly cash flow is $7 ($88/yr) — positive.
- The deal already cash-flows at list — no discount required.
- To meet the 1% rule (rent ≥ 1% of price), the offer needs to be $127k (5.6% below list).
- Recommended offer: $127k (5.6% below list) — sets the bar for 1% rule.
- Cap rate 6.9% vs local median 4.0% in Petal — top-decile yield for the area; either an underpriced asset or a hidden risk that comps aren't pricing in. Stress-test before assuming the spread holds.
Location & tenants
- Location reads 73/100 on livability (#18 in MS) — a middle-class / working-renter tenant base. Strengths: crime A+, cost of living A+, housing A+; Watch: health & safety D, amenities F, commute F.
- Petal School District (suburban): math 68% / reading 56% proficiency, ranked #2 of 130 in MS (top 2%) — acceptable for families but not a draw, mixed tenant base, ~2y average lease.
- Market conditions: 228 active listings in the ZIP; 2 comparable units currently listed for rent nearby; 121 units permitted in Forrest County in 2024 (30 in 5+ unit buildings).
Forward outlook
- Local home prices are declining (-3.0%/yr); year-one equity from $933 of loan paydown is wiped out by about $4k of value loss. Plan a longer hold.
- Forrest County population projected at +6% by 2050 — modest demand growth; plan on rents tracking national, not racing it.
Negotiation context
- Only 10 days on market — expect competitive offers; lowballing is unlikely to land.
- 4 sale attempts with the ask held roughly flat each time — persistent listings suggest the price (not the market) is what's stuck; bring a comps-based counter.
Risks & watch-outs
- Watch-outs: flood insurance adds $66/mo; built in 1950 — expect roof / HVAC / electrical / plumbing capex.
- Climate carrying-cost: severe flood risk; severe wind risk, 99% chance of damaging wind over 30y; extreme-heat days projected 7→20/yr by 2055 (HVAC capex compounding) — expect insurance premiums to compound above CPI over the hold.
Questions for the listing agent
- Built in 1950 — when were the roof, HVAC, electrical panel, plumbing, and water heater last replaced?
- What's the actual annual flood-insurance premium (NFIP or private), and is the property in a SFHA with mandatory coverage?
- Is there a deadline driving the sale (1031 exchange, divorce, estate, relocation)? That informs how much negotiation room exists.
- What's the average days-on-market for RENTAL listings here right now (not sales)? A rising rental-DOM trend means longer vacancies and softer asking-rent achievability than the comps imply.
- What's the recent tenant-quality profile in this submarket — average credit score on applications, eviction rate, late-payment / NSF rate, and stable-employment percentage? A property-management company in the area should have these aggregated.
- How much new for-sale + rental construction is in the pipeline within 1–3 miles? Heavy new supply typically softens prices + rents 12–24 months out; constrained supply supports both.
Investment metrics
- 1% rule
- 0.94% ✗
- Cap rate
- 6.95%
- Cash-on-cash
- 2.34%
- DSCR
- 1.10
- GRM
- 8.8
CMA / ARV
- ARV (median comp)
- $167,071
- List price
- $135,000
- Delta
- -19.20%
- Verdict
- UNDERPRICED
- Comps
- 11 within 1.0 mi
Show comp detail 4 sales within ~0.75 mi
| Address | Dist | Beds/Ba | Sqft | Sold | Price | $/sf | Match |
|---|---|---|---|---|---|---|---|
| 102 Smith St | 0.58mi | 3/2.0 | 1,391 (-4%) | 2mo | $199,900 | $144 | 66 |
| 113 Green St | 0.62mi | 3/2.0 | 1,500 (+4%) | 5mo | $219,900 | $147 | 60 |
| 142 W 5th Ave | 0.44mi | 4/1.5 (+1) | 1,525 (+6%) | 13mo | $189,500 | $124 | 52 |
| 126 Wilson Dr | 0.61mi | 3/1.0 | 1,326 (-8%) | 3mo | $100,000 | $75 | 52 |
Match score weights: distance 35% · size 25% · config 20% · recency 20%. Top-matched comps best support the ARV.
Projected returns pro-forma
-3.0% appreciation · 3.0% rent growth · sell at horizon
- IRR
- -15.9%
- Equity multiple
- 0.44×
- Total profit
- $-21,349
- Equity at exit
- $20,129
- IRR
- -7.4%
- Equity multiple
- 0.53×
- Total profit
- $-17,745
- Equity at exit
- $11,672
Cash invested: $37,800 (down + closing). Projections, not guarantees.
Landlord ↔ Tenant lean methodology
- Overall (STATE)
- 90 Strongly Landlord-Friendly
- State Mississippi
- 90 Strongly Landlord-Friendly · R+11
- County
- — inherits STATE
- City
- — inherits STATE
ZIP-level market 39465
- Active inventory
- 228
- Price-to-rent
- 8.8×
Monthly cashflow live
- Estimated rent
- $1,274 medium interval (Pro) →
- Mortgage (P&I)
- −$708
- Tax est. 1.5%
- −$169 /mo · $2,025/yr
- Insurance
- −$56
- Flood insurance flood zone
- −$66 /mo · $798/yr
- HOA
- −$0
- Vacancy / Maint / Mgmt
- −$268
- Net cashflow
- $7
Break-even live
UW: 25.0% down · 7.5% · 30yr · 1.5% tax · 5.0% vac · 8.0% maint · 8.0% mgmt
Financing live
Cash to close
- Down payment
- $33,750
- Closing costs
- $4,050
- Reserves months
- —
- Total cash needed
- —
Loan-product check · same deal, 3 products live
Conventional
25% down · 7.5% · 30yr
- Down + closing
- —
- Monthly P&I
- —
- Monthly cashflow
- —
- DSCR
- —
- Eligible?
- —
Personal DTI + credit; lowest rate.
DSCR
20% down · 8.5% · 30yr
- Down + closing
- —
- Monthly P&I
- —
- Monthly cashflow
- —
- DSCR
- —
- Eligible?
- —
No personal income docs; deal must DSCR.
Hard money
10% down · 12.0% · 12mo
- Down + closing
- —
- Monthly P&I
- —
- Monthly cashflow
- —
- DSCR
- —
- Eligible?
- —
Short-term bridge; refi at stabilization.
Rent comps 2 comps
| Address | Beds | Baths | Sqft | Rent | $/sqft | DOM | Units | Dist |
|---|---|---|---|---|---|---|---|---|
| 120 E First Ave Petal, MS | 2.0 | 1.0 | 1062 | $995 | $0.94 | 43d | 1 | 0.36mi |
| 523 E Fifth Ave Petal, MS | 3.0 | 1.0 | 1098 | $1,500 | $1.37 | 21d | 1 | 0.89mi |
Listing history 8 events
-
2026-05-18status Pending 314-char remark
-
2026-05-01$135,000 Active 314-char remark
-
2025-11-22status Active
-
2025-11-12status Pending
-
2025-10-22status Active
-
2025-09-05status Pending
-
2025-08-03price $150,000
-
2025-06-07$160,000 Active
ⓘ Source: listings_history table (triggers on properties + properties_extension) + one-shot
backfill from property_details.listing_events for pre-trigger history.
Climate risk First Street
- Flood 9/10 Extreme FEMA zone X (shaded) · 99% chance over 30 yrs
- Wildfire 3/10 Moderate
- Heat 7/10 Severe 7 d/yr ≥106°F today · 20 d/yr by 30 yrs out
- Wind 8/10 Severe 99% chance of damaging wind over 30 yrs
- Air quality 1/10 Low 0 unhealthy d/yr today · 0 by 30 yrs out
Nearby sold comps map
Loading sold comps map…
Walkable amenities ~0.75 mi
Loading nearby amenities…
Taxation est. · year 1
- Rental income
- $15,292
- − Mortgage interest
- −$7,562
- − Property taxes
- −$2,025
- − Insurance
- −$1,472
- − Repairs & maintenance
- −$1,223
- − Management
- −$1,223
- − Depreciation
- −$3,927
- Taxable loss
- −$2,141
- Est. tax savings @ 24.0%
- +$514
- After-tax cash flow
- $602/yr
For passive investors: Depreciation is non-cash, so a rental often shows a tax loss while cash-flowing — sheltering income. Rental losses are passive: they offset passive income freely, and up to $25,000/yr can offset ordinary (W-2) income if you actively participate and your MAGI is under $100k (phasing out to $0 by $150k); unused losses carry forward. On sale, claimed depreciation is recaptured at up to 25%, and gains may owe capital-gains tax (a 1031 exchange can defer both). Figures are a year-1 estimate at your 24.0% rate — not tax advice; consult a CPA.
Condition & rehab AI · 12 photos
A well-maintained 1950s cottage with updated interiors and curb appeal, ready for a new owner.
Value-add opportunities
- Both Paint exterior — Enhances curb appeal and value.
- Both Replace swing — Improves safety and functionality.
- Both Replace ceiling fans — Aesthetically pleasing and energy-efficient.
Renovation cost estimate screening
Value-add ROI direction
- Both Paint exterior — Enhances curb appeal and value. ↑
- Both Replace swing — Improves safety and functionality. ↑
- Both Replace ceiling fans — Aesthetically pleasing and energy-efficient. ↑
ⓘ Cost ranges are severity-bucket heuristics (US national rule-of-thumb). Get contractor quotes + a written scope before underwriting a rehab budget.
Schools (NCES district)
- District
- Petal School District
- NCES district ID
- 2803530
- Math proficiency
- 68% ▼ -8.00%
- Reading proficiency
- 56% ▼ -6.00%
- Median HH income
- $51,872
- Composite
- 52.97/100
- National rank
- #1526
- State rank
- #2 of 130 in MS
Livability — Petal
- Score
- 73/100
- State rank
- #18
- US rank
- #5565
Category grades
Schools grade is shown separately in the Schools card above.
Census & demographics
- Census place
- Petal, MS
- County
- Forrest County · 65,413 people
- City population
- 22,882
- Metro
- Hattiesburg, MS
- Population (ZIP)
- 22,882
- Household income
- $74,035
- Rent vs Own
- Severe rent burden
- 199.0
Population outlook (Forrest County) Hauer SSP2
- Today (2025)
- 79,264 people
- By 2030
- 80,822 · +2.0%
- By 2040
- 82,979 · +4.7%
- By 2050
- 84,324 · +6.4%
- By 2075
- 84,942 · +7.2%
- By 2100
- 80,616 · +1.7%
Race, ethnicity, and origin ACS 2023
- Neighborhood character
- Predominantly White (81%)
- Race & ethnicity
- White 81% Black 13% Two or more races 3% Hispanic / Latino 3%
- Common ancestry
- Lithuanian 4% Slovak 2% Italian 1%
- Foreign-born
- 2% · Canada, Vietnam
- Languages at home
- 98% English-only · Spanish 2%
Political lean MEDSL · Forrest
- 2024 margin
- R (+17.9) · D 40.3% · R 58.2% · Other 1.4%
- 2008→2024 swing
- -4.4pp toward R · 2008: -13.5pp · 2024: -17.9pp
- All cycles
- 2024: R+17.9 2020: R+11.1 2016: R+14.2 2012: R+11.7 2008: R+13.5
Not yet ingested
- Civics
- —
Market trends
- HPI YoY
- ▼ -96.97%
- Current HPI
- 158.6021
- Rent YoY
- —
- Metro
- Hattiesburg, MS
- State GDP YoY
- —
- F500 in state
- 0
Price history
-15.6% since first listed8 events — show timeline
- 2026-05-18 Pending — HAAR
- 2026-05-01 Listed $135,000 HAAR
- 2025-11-22 Relisted — HAAR
- 2025-11-12 Pending — HAAR
- 2025-10-22 Relisted — HAAR
- 2025-09-05 Pending — HAAR
- 2025-08-03 Price Changed $150,000 HAAR
- 2025-06-07 Listed $160,000 HAAR
Cash-flow waterfall
monthlySold comps — $/sqft
last 12 mo · ≤1 miLoading sold comps…