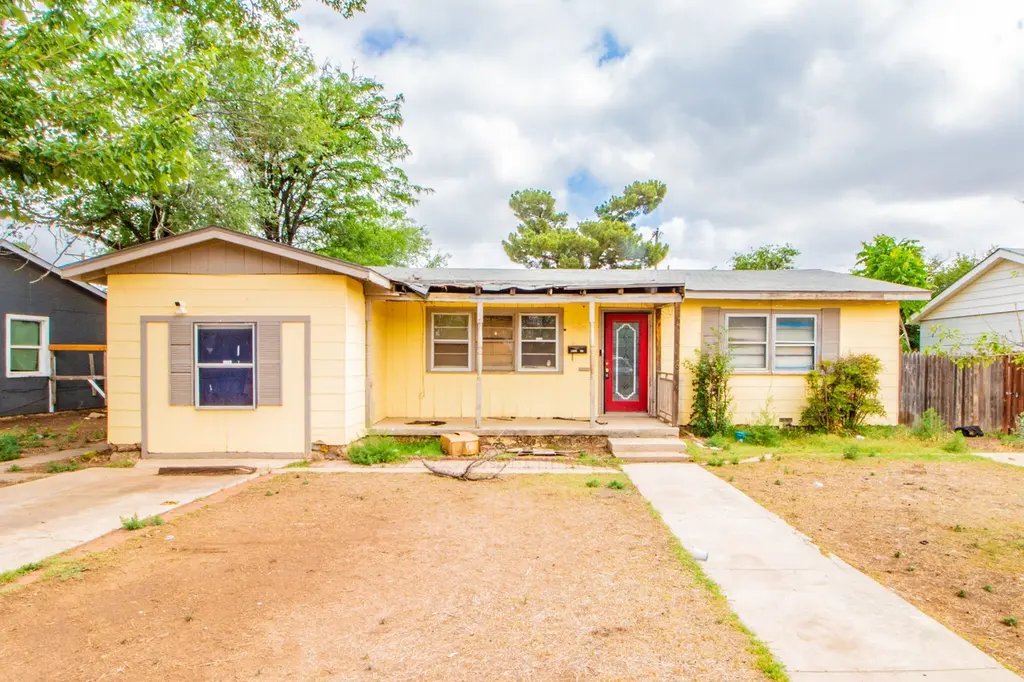
1606 60th St · Lubbock, TX
Flood risk 3/10 · Minor
- FEMA flood zone
- X (unshaded)
- Chance of flooding over 30 yrs
- 0.12%
- Est. flood insurance / yr
- $507 – $1,088
Fire risk 1/10 · Minimal
- Est. fire insurance / yr
- $1,222 – $2,270
Heat risk 5/10 · Moderate
- Hot days now (above 99°F)
- 7 days/yr
- Hot days in 30 yrs
- 21 days/yr
Wind risk 2/10 · Minimal
- Chance of severe wind over 30 yrs
- —
Air-quality risk 2/10 · Minimal
- Unhealthy air days now
- 1 days/yr
- Unhealthy air days in 30 yrs
- 1 days/yr
Risk factors via First Street. Map © Google.
Why this score? — see what drove the B grade
The composite is a weighted blend of 9 inputs, each scored 0–100. Each bar is that input's sub-score; the figure is the points it added to the 100-point composite (weight × sub-score).
- Cash flow +30.0/30.0
- 1% rule +10.0/10.0
- DSCR +10.0/10.0
- ARV discount +7.5/15.0
- Livability +4.0/5.0
- Rent growth +3.5/5.0
- Schools +3.1/10.0
- Condition / age +2.5/5.0
- Appreciation +0.0/10.0
$38,000
🖨 Deal sheet (PDF) 📄 Offer letter ✓ Due diligence
Listing remarks
3 bedroom 1 bathroom home on a quiet street. Home is great for an investor looking to remodel and sell or remodel and hold. For a home owner this is an awesome chance to pick up a home with good bones that needs tlc. Home is being sold as is.
Key facts
- 8,250 sq ft lot
- Built 1951
- Listed 21 days
Property features AI
Finance
- Other: Lot size approximately 0.19 acres; Residential property
Exterior
- Parking: Driveway parking; On-street parking
- Security: See remarks
- Utilities: Paved road access
- Home design: Single-family residence; Single story; Property listed as fixer
- Construction: Asbestos construction materials; Pillar/post/pier foundation; Composition roof; Built on 1 story
- Exterior features: Covered porch/patio; Fenced backyard; Other exterior features
Interior
- Bathrooms: 1 full bathroom
- Heating & cooling: Central heating; Central air; Ceiling fans
- Interior features: See remarks
Neighborhood map
What this means for you Summary
Snapshot
- This is a 3-bed/1.0-bath single-family listed at $38k.
Deal economics
- At list price, monthly cash flow is $517 ($6k/yr) — positive.
- The deal already cash-flows at list — no discount required.
- Meets the 1% rule at list price ($1k rent vs $38k).
- Recommended offer: $37k (1.5% below list) — sets the bar for market timing.
Location & tenants
- Location reads 80/100 on livability (#37 in TX, #1,749 nationally) — a professional / high-income tenant draw. Strengths: commute A+, cost of living A+, housing A+; Watch: employment C-, schools D+, crime F.
- Lubbock ISD (urban): math 36% / reading 39% proficiency, ranked #481 of 826 in TX (top 58%) — families likely to look elsewhere, expect single-tenant / working-renter base with shorter leases; 60% free/reduced lunch — lower-income household profile, screen leases tightly.
- Market conditions: Rents rising (+3.9%/yr); 110 active listings in the ZIP; 40 comparable units currently listed for rent nearby; rentals at typical pace (median 23d on market — plan ~3-4 weeks tenant-placement turnaround); 42% of comp listings sitting > 30 days — soft ceiling on asking rent; 2,219 units permitted in Lubbock County in 2024 (252 in 5+ unit buildings).
Forward outlook
- Local home prices are declining (-3.0%/yr); year-one equity from $263 of loan paydown is wiped out by about $1k of value loss. Plan a longer hold.
- Lubbock County population projected at +39% by 2050 — long-run rental-demand tailwind backs the buy-and-hold thesis.
- At projected returns (-3.0% appreciation + 3.9% rent growth), your $11k cash investment doubles in ~2 years — after that, you're playing with house money.
Negotiation context
- It's been on market 21 days — a 2% lower offer ($37k) is reasonable based on typical stale-listing flexibility.
Risks & watch-outs
- Watch-outs: property tax is 4.2% of price; built in 1951 — expect roof / HVAC / electrical / plumbing capex.
- Climate carrying-cost: extreme-heat days projected 7→21/yr by 2055 (HVAC capex compounding) — expect insurance premiums to compound above CPI over the hold.
Questions for the listing agent
- Built in 1951 — when were the roof, HVAC, electrical panel, plumbing, and water heater last replaced?
- Property tax is high relative to price — has the assessment been appealed recently, and will the sale trigger a re-assessment?
- Is there a deadline driving the sale (1031 exchange, divorce, estate, relocation)? That informs how much negotiation room exists.
- Schools are D-rated, which usually means shorter tenancies and higher turnover. Who's the typical renter profile here, and what's been the actual vacancy rate?
- Crime grade is F in this area — have there been break-ins, vandalism, or insurance claims at this property in the last 3 years? What carrier currently insures it and at what premium?
- What's the average days-on-market for RENTAL listings here right now (not sales)? A rising rental-DOM trend means longer vacancies and softer asking-rent achievability than the comps imply.
- What's the recent tenant-quality profile in this submarket — average credit score on applications, eviction rate, late-payment / NSF rate, and stable-employment percentage? A property-management company in the area should have these aggregated.
- How much new for-sale + rental construction is in the pipeline within 1–3 miles? Heavy new supply typically softens prices + rents 12–24 months out; constrained supply supports both.
Investment metrics
- 1% rule
- 2.88% ✓
- Cap rate
- 22.61%
- Cash-on-cash
- 58.27%
- DSCR
- 3.59
- GRM
- 2.9
CMA / ARV
No comps found within radius.
Projected returns pro-forma
-3.0% appreciation · 3.87% rent growth · sell at horizon
- IRR
- 58.0%
- Equity multiple
- 3.61×
- Total profit
- $27,785
- Equity at exit
- $5,666
- IRR
- 63.2%
- Equity multiple
- 7.66×
- Total profit
- $70,885
- Equity at exit
- $3,286
Cash invested: $10,640 (down + closing). Projections, not guarantees.
Landlord ↔ Tenant lean methodology
- Overall (STATE)
- 87 Strongly Landlord-Friendly
- State Texas
- 87 Strongly Landlord-Friendly · R+5
- County
- — inherits STATE
- City
- — inherits STATE
ZIP-level market 79412
- Home prices YoY
- -15.3%
- Rents YoY
- 3.9%
- Active inventory
- 110
- Price-to-rent
- 2.9×
Monthly cashflow live
- Estimated rent
- $1,095 high interval (Pro) →
- Mortgage (P&I)
- −$199
- Tax from tax record
- −$133 /mo · $1,595/yr
- Insurance
- −$16
- HOA
- −$0
- Vacancy / Maint / Mgmt
- −$230
- Net cashflow
- $517
Break-even live
Sensitivity live
| Price | -10% $538 | -5% $527 | +0% $517 | +5% $506 | +10% $495 |
|---|---|---|---|---|---|
| Rent | -10% $430 | -5% $473 | +0% $517 | +5% $560 | +10% $603 |
| Rate | -1.0pp $536 | -0.5pp $526 | base $517 | +0.5pp $507 | +1.0pp $497 |
UW: 25.0% down · 7.5% · 30yr · 1.5% tax · 5.0% vac · 8.0% maint · 8.0% mgmt
Financing live
Cash to close
- Down payment
- $9,500
- Closing costs
- $1,140
- Reserves months
- —
- Total cash needed
- —
Loan-product check · same deal, 3 products live
Conventional
25% down · 7.5% · 30yr
- Down + closing
- —
- Monthly P&I
- —
- Monthly cashflow
- —
- DSCR
- —
- Eligible?
- —
Personal DTI + credit; lowest rate.
DSCR
20% down · 8.5% · 30yr
- Down + closing
- —
- Monthly P&I
- —
- Monthly cashflow
- —
- DSCR
- —
- Eligible?
- —
No personal income docs; deal must DSCR.
Hard money
10% down · 12.0% · 12mo
- Down + closing
- —
- Monthly P&I
- —
- Monthly cashflow
- —
- DSCR
- —
- Eligible?
- —
Short-term bridge; refi at stabilization.
Rent comps 40 comps
| Address | Beds | Baths | Sqft | Rent | $/sqft | DOM | Units | Dist |
|---|---|---|---|---|---|---|---|---|
| 1610 58th St Unit B Lubbock, TX | 2.0 | 1.0 | 952 | $950 | $1.00 | 45d | 1 | 0.19mi |
| 1612 58th St Unit B Lubbock, TX | 2.0 | 1.0 | 952 | $950 | $1.00 | 45d | 1 | 0.20mi |
| 1614 58th St Unit A Lubbock, TX | 2.0 | 1.0 | 952 | $950 | $1.00 | 45d | 1 | 0.20mi |
| 1618 58th St Unit B Lubbock, TX | 2.0 | 1.0 | 952 | $950 | $1.00 | 45d | 1 | 0.20mi |
| 6130 Avenue P Lubbock, TX | 4.0 | 2.0 | 1387 | $1,100 | $0.79 | 45d | 1 | 0.20mi |
| 1307 61st St Lubbock, TX | 3.0 | 1.0 | 1073 | $1,150 | $1.07 | 15d | 1 | 0.25mi |
| 1341 65th Dr Unit C Lubbock, TX | 2.0 | 1.5 | 1000 | $695 | $0.69 | 22d | 1 | 0.26mi |
| 6518 Avenue S Lubbock, TX | 2.0 | 1.0 | 990 | $700 | $0.71 | 22d | 1 | 0.35mi |
| 1923 67th St Lubbock, TX | 4.0 | 2.0 | 1467 | $1,525 | $1.04 | 45d | 1 | 0.52mi |
| 7006 Avenue S Lubbock, TX | 4.0 | 2.0 | 1498 | $1,800 | $1.20 | 45d | 1 | 0.57mi |
| 1927 71st St Lubbock, TX | 4.0 | 2.0 | 1807 | $1,600 | $0.89 | 22d | 1 | 0.67mi |
| 5512 Avenue G Unit G Lubbock, TX | 3.0 | 1.0 | 1117 | $1,000 | $0.90 | 45d | 1 | 0.67mi |
| 1921 S Loop 289 Lubbock, TX | 3.0 | 2.0 | 1121 | $1,100 | $0.98 | 45d | 1 | 0.75mi |
| 2101 51st St Lubbock, TX | 2.0 | 1.5 | 1100 | $900 | $0.82 | 22d | 1 | 0.75mi |
| 5614 Avenue A Unit A Lubbock, TX | 3.0 | 1.0 | 1129 | $695 | $0.62 | 22d | 1 | 0.78mi |
| 2105 South Loop 289 Unit A Lubbock, TX | 2.0 | 1.0 | 962 | $950 | $0.99 | 15d | 1 | 0.85mi |
| 1816 75th St Lubbock, TX | 4.0 | 2.0 | 1516 | $2,000 | $1.32 | 22d | 1 | 0.86mi |
| 2113 S Loop 289 Lubbock, TX | 2.0 | 1.0 | 1000 | $849 | $0.85 | 45d | 1 | 0.87mi |
| 2113 South Loop 289 Unit B Lubbock, TX | 2.0 | 1.0 | 950 | $900 | $0.95 | 15d | 1 | 0.87mi |
| 1923 76th St Lubbock, TX | 3.0 | 2.0 | 1622 | $1,699 | $1.05 | 45d | 1 | 0.98mi |
| 2128 74th St Lubbock, TX | 3.0 | 2.5 | 1132 | $1,350 | $1.19 | 22d | 1 | 0.99mi |
| 313 52nd St Lubbock, TX | 4.0 | 1.0 | 1044 | $975 | $0.93 | 22d | 1 | 1.00mi |
| 7304 Avenue W Lubbock, TX | 3.0 | 2.0 | 1500 | $999 | $0.67 | 15d | 1 | 1.01mi |
| 2401 73rd St Unit 14 Lubbock, TX | 2.0 | 2.0 | 950 | $800 | $0.84 | 15d | 1 | 1.02mi |
| 812 48th St Lubbock, TX | 3.0 | 1.0 | 1282 | $1,250 | $0.98 | 22d | 1 | 1.03mi |
| 1940 77th St Lubbock, TX | 3.0 | 2.0 | 1700 | $1,500 | $0.88 | 45d | 1 | 1.04mi |
| 7404 W Avenue Unit A Lubbock, TX | 2.0 | 1.0 | 950 | $825 | $0.87 | 45d | 1 | 1.04mi |
| 1920 45th St Lubbock, TX | 3.0 | 1.0 | 1200 | $1,200 | $1.00 | 22d | 1 | 1.05mi |
| 1920 44th St Lubbock, TX | 4.0 | 2.0 | 1391 | $795 | $0.57 | 22d | 1 | 1.11mi |
| 2315 48th St Lubbock, TX | 3.0 | 1.0 | 1014 | $1,350 | $1.33 | 22d | 1 | 1.11mi |
| 7406 Waco Ave Unit C Lubbock, TX | 2.0 | 1.0 | 1831 | $750 | $0.41 | 45d | 1 | 1.13mi |
| 1718 43rd St Lubbock, TX | 4.0 | 2.0 | 1870 | $1,075 | $0.57 | 22d | 1 | 1.15mi |
| 1625 79th Pl Lubbock, TX | 3.0 | 2.0 | 1541 | $1,650 | $1.07 | 45d | 1 | 1.16mi |
| 1805 79th Pl Lubbock, TX | 3.0 | 2.0 | 1284 | $1,375 | $1.07 | 45d | 1 | 1.17mi |
| 2726 68th St Lubbock, TX | 4.0 | 2.0 | 1524 | $1,800 | $1.18 | 45d | 1 | 1.17mi |
| 2707 63rd St Lubbock, TX | 3.0 | 1.0 | 1080 | $1,050 | $0.97 | 15d | 1 | 1.18mi |
| 2316 47th St Lubbock, TX | 3.0 | 2.0 | 1285 | $1,400 | $1.09 | 22d | 1 | 1.18mi |
| 529 45th St Unit A Lubbock, TX | 3.0 | 1.0 | 1100 | $875 | $0.80 | 15d | 1 | 1.19mi |
| 520 46th St Unit A Lubbock, TX | 3.0 | 1.0 | 1200 | $850 | $0.71 | 15d | 1 | 1.20mi |
| 531 44th St Lubbock, TX | 3.0 | 2.0 | 1300 | $1,090 | $0.84 | 15d | 1 | 1.20mi |
Listing history 19 events
-
2026-06-18days on market $38,000 Active 21 DOM
-
2026-06-17days on market $38,000 Active 20 DOM
-
2026-06-16days on market $38,000 Active 19 DOM
-
2026-06-15days on market $38,000 Active 18 DOM
-
2026-06-14days on market $38,000 Active 16 DOM
-
2026-06-13days on market $38,000 Active 15 DOM
-
2026-06-10days on market $38,000 Active 13 DOM
-
2026-06-09days on market $38,000 Active 12 DOM
-
2026-06-08days on market $38,000 Active 11 DOM
-
2026-06-07days on market $38,000 Active 10 DOM
-
2026-06-05days on market $38,000 Active 7 DOM
-
2026-06-03days on market $38,000 Active 6 DOM
-
2026-06-02days on market $38,000 Active 5 DOM
-
2026-06-01days on market $38,000 Active 4 DOM
-
2026-05-31days on market $38,000 Active 3 DOM
-
2026-05-30days on market $38,000 Active 2 DOM
-
2026-05-28$38,000 Active
-
2007-04-06soldstatus
-
2007-04-06soldstatus
ⓘ Source: listings_history table (triggers on properties + properties_extension) + one-shot
backfill from property_details.listing_events for pre-trigger history.
Tax reassessment forecast TX · Resets to sale price
- Current annual tax
- $1,595 · $133/mo
- Projected year-2 tax
- $1,595 · $133/mo
- Expected delta
- $0/yr ($0/mo · 0.0%)
ⓘ Screening estimate from a state-policy table — verify with the county assessor before closing.
Climate risk First Street
- Flood 3/10 Moderate FEMA zone X (unshaded) · 12% chance over 30 yrs
- Wildfire 1/10 Low
- Heat 5/10 Major 7 d/yr ≥99°F today · 21 d/yr by 30 yrs out
- Wind 2/10 Low
- Air quality 2/10 Low 1 unhealthy d/yr today · 1 by 30 yrs out
Nearby sold comps map
Loading sold comps map…
Walkable amenities ~0.75 mi
Loading nearby amenities…
Taxation est. · year 1
- Rental income
- $13,135
- − Mortgage interest
- −$2,129
- − Property taxes
- −$1,595
- − Insurance
- −$190
- − Repairs & maintenance
- −$1,051
- − Management
- −$1,051
- − Depreciation
- −$1,105
- Taxable income
- $6,014
- Est. tax owed @ 24.0%
- −$1,443
- After-tax cash flow
- $4,757/yr
For passive investors: Depreciation is non-cash, so a rental often shows a tax loss while cash-flowing — sheltering income. Rental losses are passive: they offset passive income freely, and up to $25,000/yr can offset ordinary (W-2) income if you actively participate and your MAGI is under $100k (phasing out to $0 by $150k); unused losses carry forward. On sale, claimed depreciation is recaptured at up to 25%, and gains may owe capital-gains tax (a 1031 exchange can defer both). Figures are a year-1 estimate at your 24.0% rate — not tax advice; consult a CPA.
Schools (NCES district)
- District
- Lubbock ISD
- NCES district ID
- 4828500
- Math proficiency
- 36% ▼ -8.00%
- Reading proficiency
- 39% ▼ -1.00%
- Median HH income
- $39,820
- Composite
- 31.44/100
- National rank
- #5984
- State rank
- #481 of 826 in TX
Livability — Lubbock
- Score
- 80/100
- State rank
- #37
- US rank
- #1749
Category grades
Schools grade is shown separately in the Schools card above.
Census & demographics
- Census place
- Lubbock, TX
- County
- Lubbock County · 293,542 people
- City population
- 283,030
- Metro
- Lubbock, TX
- Population (ZIP)
- 15,018
- Household income
- $48,878
- Rent vs Own
- Severe rent burden
- 676.0
Population outlook (Lubbock County) Hauer SSP2
- Today (2025)
- 345,960 people
- By 2030
- 371,449 · +7.4%
- By 2040
- 424,539 · +22.7%
- By 2050
- 481,150 · +39.1%
- By 2075
- 633,467 · +83.1%
- By 2100
- 746,853 · +115.9%
Race, ethnicity, and origin ACS 2023
- Neighborhood character
- Diverse neighborhood (Simpson 0.56)
- Race & ethnicity
- Hispanic / Latino 61% Two or more races 25% White 25% Black 10%
- Hispanic origin (detail)
- Mexican 51% Puerto Rican 2%
- Common ancestry
- Lithuanian 1% Serbian 1% Italian 1%
- Foreign-born
- 5% · Canada
- Languages at home
- 67% English-only · Spanish 32% Arabic 1%
Political lean MEDSL · Lubbock
- 2024 margin
- Solid R (+39.5) · D 29.7% · R 69.2% · Other 1.0%
- 2008→2024 swing
- -2.8pp toward R · 2008: -36.7pp · 2024: -39.5pp
- All cycles
- 2024: R+39.5 2020: R+32.2 2016: R+38.4 2012: R+40.9 2008: R+36.7
Not yet ingested
- Civics
- —
Market trends
- HPI YoY
- ▼ -33.95%
- Current HPI
- 188.4033
- Rent YoY
- ▲ 3.87%
- Metro
- Lubbock, TX
- State GDP YoY
- ▲ 3.95%
- F500 in state
- 110
Industry mix (Fortune 500 HQ in TX)
| Industry | F500 HQs | Revenue |
|---|---|---|
| Energy | 16 | $1,198B |
|
||
| Technology | 5 | $198B |
|
||
| Engineering / Construction | 4 | $72B |
|
||
| Energy Services | 3 | $60B |
|
||
| Utilities | 3 | $41B |
|
||
| Healthcare | 2 | $330B |
|
||
Price history
3 events — show timeline
- 2026-05-28 Listed $38,000 LARMLS
- 2007-04-06 Sold (Public Records) — Public Records
- 2007-04-06 Sold (Public Records) — Public Records
Property tax history
+4.0%/yrLatest (2025): $1,595 · +7.2% YoY. Source: county tax records.
Cash-flow waterfall
monthlySold comps — $/sqft
last 12 mo · ≤1 miLoading sold comps…