 Multi-family
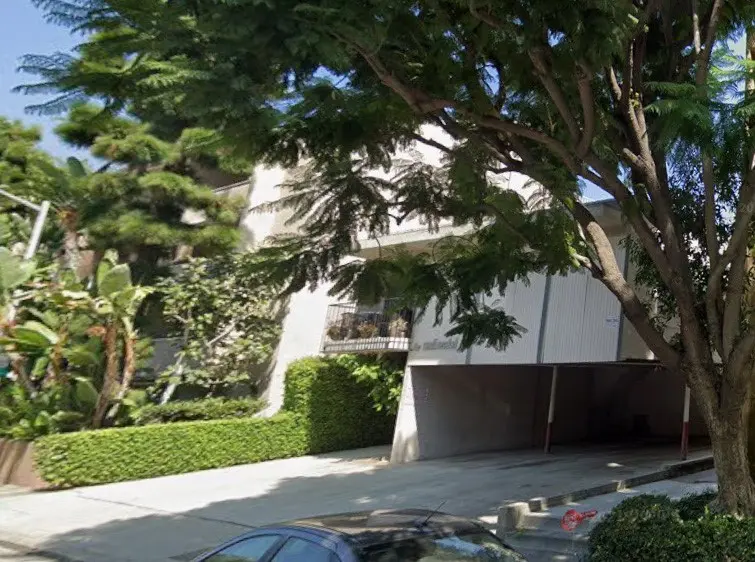
714 N Knoll Dr W · West Hollywood, CA
Flood risk 1/10 · Minimal
- FEMA flood zone
- X (unshaded)
- Chance of flooding over 30 yrs
- 0.0%
- Est. flood insurance / yr
- $507 – $1,088
Fire risk 1/10 · Minimal
- Est. fire insurance / yr
- $659 – $1,223
Heat risk 6/10 · Moderate
- Hot days now (above 88°F)
- 8 days/yr
- Hot days in 30 yrs
- 23 days/yr
Wind risk 1/10 · Minimal
- Chance of severe wind over 30 yrs
- —
Air-quality risk 5/10 · Moderate
- Unhealthy air days now
- 7 days/yr
- Unhealthy air days in 30 yrs
- 7 days/yr
Risk factors via First Street. Map © Google.
Why this score? — see what drove the C grade
The composite is a weighted blend of 9 inputs, each scored 0–100. Each bar is that input's sub-score; the figure is the points it added to the 100-point composite (weight × sub-score).
- Cash flow +20.2/30.0
- ARV discount +9.7/15.0
- DSCR +6.4/10.0
- Appreciation +5.4/10.0
- 1% rule +4.0/10.0
- Schools +3.6/10.0
- Livability +3.5/5.0
- Condition / age +2.5/5.0
- Rent growth +2.4/5.0
$2,200,000
🖨 Deal sheet 📄 Offer letter ✓ Due diligence
Multi-family units
County records classify this as Multi-Family (5+ Unit). Listing-text estimate: 1 unit. estimate disagrees with records
5+ unit building — per-unit beds/baths from public records are typically unavailable; the breakdown below (if shown) is an estimate from the listing text.
Listing remarks MLS
Where else would you invest but in the trendiest, most hip location of West Hollywood, sunny California! A Mid Century architectural-style, this 6 units building, a mix of 2X 2+2 and 4X 1+1, is fully occupied, income producing small complex located in WeHo’s most desirable neighborhood. Across from hi-end, posh Le Parc at Melrose Hotel, 1 block E. of La Cienega & 1 block N. of Melrose - in short, an area in high demand due to its dynamic life and great proximity to top dining venues, high energy nightlife, entertainment and upscale shopping – we’re within just a few yards of all these amazing opportunities. The property offers an incredible redevelopment potential, whether for luxury condos, high-end townhomes, or stylish apartments. You’ve got a rare chance to acquire a solid asset in one of the most sought-after locations in Los Angeles, offering the possibility for steady appreciation and exceptional opportunity to capitalize on the rental upside potential in the most popular neighborhood of West Hollywood. Our current residents tremendously enjoy being within short proximity to trendy entertainment, retail and restaurants - all located within blocks of the subject property in all directions. PLEASE, DO NOT DISTURB TENANTS. DRIVE BY ONLY.
Key facts
- 5,839 sq ft lot
- 12 garage spots
- Built 1963
Tags
Neighborhood map
What this means for you Summary
Snapshot
- This is a 8-bed/6.0-bath multifamily listed at $2.20M.
Deal economics
- At list price, monthly cash flow is $3k ($33k/yr) — positive.
- The deal already cash-flows at list — no discount required.
- To meet the 1% rule (rent ≥ 1% of price), the offer needs to be $1.98M (9.9% below list).
- Recommended offer: $1.94M (12.0% below list) — sets the bar for market timing.
- Cap rate 7.8% vs local median 1.5% in West Hollywood — top-decile yield for the area; either an underpriced asset or a hidden risk that comps aren't pricing in. Stress-test before assuming the spread holds.
Location & tenants
- Location reads 70/100 on livability (#239 in CA) — a middle-class / working-renter tenant base. Strengths: schools A+, amenities A+, commute A+; Watch: health & safety C-, crime F, cost of living F.
- Los Angeles Unified (urban): math 29% / reading 54% proficiency, ranked #223 of 517 in CA (top 43%) — families likely to look elsewhere, expect single-tenant / working-renter base with shorter leases; 67% free/reduced lunch — lower-income household profile, screen leases tightly.
- Market conditions: Rents soft (-0.5%/yr); 379 active listings in the ZIP; 4 comparable units currently listed for rent nearby; rentals lingering (median 44d on market — plan ~5-8 weeks vacancy on turnover, expect pricing pressure); 50% of comp listings sitting > 30 days — soft ceiling on asking rent; solid renter incomes; 19,697 units permitted in Los Angeles County in 2024 (9,426 in 5+ unit buildings).
- At $19,823/mo this rent would consume 220% of the median local household income ($108k/yr) (locally 2412% of renters already pay >50% of income on rent) — very limited rent-growth headroom before tenants either downsize or default.
Forward outlook
- In year one you build about $32k of equity ($15k loan paydown + $17k appreciation (0.8% local appreciation)).
- Los Angeles County population projected at +9% by 2050 — modest demand growth; plan on rents tracking national, not racing it.
- At projected returns (0.8% appreciation + 0.0% rent growth), your $616k cash investment doubles in ~9 years — after that, you're playing with house money.
- By year 5, paydown + projected appreciation supports a ~$153k cash-out refi (75% LTV) — recoverable capital for the next deal without selling this one.
Negotiation context
- It's been on market 177 days — a 12% lower offer ($1.94M) is reasonable based on typical stale-listing flexibility.
- 4 sale attempts since 3y ago; this cycle's ask has dropped $300k (12%) from the opening price — seller is motivated, your offer sets the floor, not the list.
Risks & watch-outs
- Climate carrying-cost: extreme-heat days projected 8→23/yr by 2055 (HVAC capex compounding) — expect insurance premiums to compound above CPI over the hold.
Questions for the listing agent
- It's been on market 177 days. Have you received any prior offers? Is the seller open to a 12% concession, seller financing, or rate buy-down credit?
- Built in 1963 — when were the roof, HVAC, electrical panel, plumbing, and water heater last replaced?
- Why hasn't it sold? Are there any deal-killer items the seller is aware of (foundation, flood, title, zoning, code violations)?
- Is there a deadline driving the sale (1031 exchange, divorce, estate, relocation)? That informs how much negotiation room exists.
- Schools are A-rated — typically a magnet for longer-tenancy family renters. What's the average tenant stay here, and is there a school-zone premium baked into asking?
- Crime grade is F in this area — have there been break-ins, vandalism, or insurance claims at this property in the last 3 years? What carrier currently insures it and at what premium?
- What's the average days-on-market for RENTAL listings here right now (not sales)? A rising rental-DOM trend means longer vacancies and softer asking-rent achievability than the comps imply.
- What's the recent tenant-quality profile in this submarket — average credit score on applications, eviction rate, late-payment / NSF rate, and stable-employment percentage? A property-management company in the area should have these aggregated.
- How much new apartment / multifamily construction is in the pipeline within 1–3 miles? Heavy new supply (>2% of stock underway) typically softens rents 12–24 months out; light construction supports rent growth.
Investment metrics
- 1% rule
- 0.90% ✗
- Cap rate
- 7.81%
- Cash-on-cash
- 5.44%
- DSCR
- 1.24
- GRM
- 9.2
CMA / ARV
- ARV (median comp)
- $2,312,512
- List price
- $2,200,000
- Delta
- -4.87%
- Verdict
- FAIR
- Comps
- 20 within 1.0 mi
Show comp detail 6 sales within ~0.75 mi
| Address | Dist | Beds/Ba | Sqft | Sold | Price | $/sf | Match |
|---|---|---|---|---|---|---|---|
| 8360 W 1st St | 0.73mi | 7/5.0 (-1) | 4,816 (+0%) | 2mo | $1,870,000 | $388 | 55 |
| 930 N Harper Ave | 0.56mi | 7/6.0 (-1) | 4,358 (-9%) | 1mo | $2,125,000 | $488 | 53 |
| 128 N Clark Dr | 0.69mi | 8/6.0 | 4,604 (-4%) | 16mo | $1,800,000 | $391 | 48 |
| 100 N Kings Rd | 0.72mi | 8/6.0 | 5,003 (+4%) | 17mo | $2,300,000 | $460 | 45 |
| 8812 Rangely Ave | 0.56mi | 8/4.0 | 4,334 (-10%) | 14mo | $2,825,000 | $652 | 38 |
| 543 N La Jolla Ave | 0.55mi | 7/5.0 (-1) | 4,153 (-13%) | 9mo | $2,915,000 | $702 | 35 |
Match score weights: distance 35% · size 25% · config 20% · recency 20%. Top-matched comps best support the ARV.
Projected returns pro-forma
0.76% appreciation · 0.0% rent growth · sell at horizon
- IRR
- 4.4%
- Equity multiple
- 1.22×
- Total profit
- $134,168
- Equity at exit
- $723,965
- IRR
- 7.3%
- Equity multiple
- 1.81×
- Total profit
- $498,645
- Equity at exit
- $941,484
Cash invested: $616,000 (down + closing). Projections, not guarantees.
Landlord ↔ Tenant lean methodology
- Overall (STATE)
- 18 Strongly Tenant-Friendly
- State California
- 18 Strongly Tenant-Friendly · D+13
- County
- — inherits STATE
- City
- — inherits STATE
ZIP-level market 90069
- Home prices YoY
- 0.2%
- Rents YoY
- -0.5%
- Active inventory
- 379
- Price-to-rent
- 53.6×
Monthly cashflow live
- Estimated rent
- $19,823 high interval (Pro) →
- Mortgage (P&I)
- −$11,537
- Tax from tax record
- −$416 /mo · $4,995/yr
- Insurance
- −$917
- HOA
- −$0
- Vacancy / Maint / Mgmt
- −$4,163
- Net cashflow
- $2,790
Break-even live
6-unit breakdown (identical units grouped — click to expand)
| Units | Beds | Baths | Est. rent |
|---|---|---|---|
| 2× units | 2 | 2 | $6,844 |
| #1 | 2 | 2 | $3,422 |
| #2 | 2 | 2 | $3,422 |
| 4× units | 1 | 1 | $12,980 |
| #3 | 1 | 1 | $3,245 |
| #4 | 1 | 1 | $3,245 |
| #5 | 1 | 1 | $3,245 |
| #6 | 1 | 1 | $3,245 |
| Total (6 units) | $19,823 | ||
UW: 25.0% down · 7.5% · 30yr · 1.5% tax · 5.0% vac · 8.0% maint · 8.0% mgmt
Financing live
Cash to close
- Down payment
- $550,000
- Closing costs
- $66,000
- Reserves months
- —
- Total cash needed
- —
Loan-product check · same deal, 3 products live
Conventional
25% down · 7.5% · 30yr
- Down + closing
- —
- Monthly P&I
- —
- Monthly cashflow
- —
- DSCR
- —
- Eligible?
- —
Personal DTI + credit; lowest rate.
DSCR
20% down · 8.5% · 30yr
- Down + closing
- —
- Monthly P&I
- —
- Monthly cashflow
- —
- DSCR
- —
- Eligible?
- —
No personal income docs; deal must DSCR.
Hard money
10% down · 12.0% · 12mo
- Down + closing
- —
- Monthly P&I
- —
- Monthly cashflow
- —
- DSCR
- —
- Eligible?
- —
Short-term bridge; refi at stabilization.
Rent comps 4 comps
| Address | Beds | Baths | Sqft | Rent | $/sqft | DOM | Units | Dist |
|---|---|---|---|---|---|---|---|---|
| 624 N Arden Dr Beverly Hills, CA | 7.0 | 8.0 | 6777 | $65,000 | $9.59 | 22d | 1 | 1.04mi |
| 605 N Hillcrest Rd Beverly Hills, CA | 7.0 | 7.0 | 5007 | $45,000 | $8.99 | 43d | 1 | 1.15mi |
| 517 N Elm Dr Beverly Hills, CA | 7.0 | 6.0 | 5158 | $30,000 | $5.82 | 7d | 1 | 1.36mi |
| 703 N Maple Dr Beverly Hills, CA | 7.0 | 9.0 | 6500 | $55,000 | $8.46 | 43d | 1 | 1.37mi |
Listing history 11 events
-
2026-05-31days on market $2,200,000 Active 177 DOM
-
2026-01-04price $2,200,000 1291-char remark
Show marketing remark (1291 chars)
Where else would you invest but in the trendiest, most hip location of West Hollywood, sunny California! A Mid Century architectural-style, this 6 units building, a mix of 2X 2+2 and 4X 1+1, is fully occupied, income producing small complex located in WeHo’s most desirable neighborhood. Across from hi-end, posh Le Parc at Melrose Hotel, 1 block E. of La Cienega & 1 block N. of Melrose - in short, an area in high demand due to its dynamic life and great proximity to top dining venues, high energy nightlife, entertainment and upscale shopping – we’re within just a few yards of all these amazing opportunities. The property offers an incredible redevelopment potential, whether for luxury condos, high-end townhomes, or stylish apartments. You’ve got a rare chance to acquire a solid asset in one of the most sought-after locations in Los Angeles, offering the possibility for steady appreciation and exceptional opportunity to capitalize on the rental upside potential in the most popular neighborhood of West Hollywood. Our current residents tremendously enjoy being within short proximity to trendy entertainment, retail and restaurants - all located within blocks of the subject property in all directions. PLEASE, DO NOT DISTURB TENANTS. DRIVE BY ONLY.
-
2025-12-05$2,500,000 Active 1291-char remark
Show marketing remark (1291 chars)
Where else would you invest but in the trendiest, most hip location of West Hollywood, sunny California! A Mid Century architectural-style, this 6 units building, a mix of 2X 2+2 and 4X 1+1, is fully occupied, income producing small complex located in WeHo’s most desirable neighborhood. Across from hi-end, posh Le Parc at Melrose Hotel, 1 block E. of La Cienega & 1 block N. of Melrose - in short, an area in high demand due to its dynamic life and great proximity to top dining venues, high energy nightlife, entertainment and upscale shopping – we’re within just a few yards of all these amazing opportunities. The property offers an incredible redevelopment potential, whether for luxury condos, high-end townhomes, or stylish apartments. You’ve got a rare chance to acquire a solid asset in one of the most sought-after locations in Los Angeles, offering the possibility for steady appreciation and exceptional opportunity to capitalize on the rental upside potential in the most popular neighborhood of West Hollywood. Our current residents tremendously enjoy being within short proximity to trendy entertainment, retail and restaurants - all located within blocks of the subject property in all directions. PLEASE, DO NOT DISTURB TENANTS. DRIVE BY ONLY.
-
2024-08-07historical $2,295
-
2024-07-31$2,295
-
2024-04-10historical $2,295
-
2024-04-03$2,295
-
2024-03-24historical $2,400
-
2024-03-17price $2,400
-
2024-03-13price $2,300
-
2023-12-30$2,500
ⓘ Source: listings_history table (triggers on properties + properties_extension) + one-shot
backfill from property_details.listing_events for pre-trigger history.
Tax reassessment forecast CA · Resets to sale price
- Current annual tax
- $4,995 · $416/mo
- Projected year-2 tax
- $16,720 · $1,393/mo
- Expected delta
- +$11,725/yr (+$977/mo · 234.7%)
ⓘ Screening estimate from a state-policy table — verify with the county assessor before closing.
Climate risk First Street
- Flood 1/10 Low FEMA zone X (unshaded) · 0% chance over 30 yrs
- Wildfire 1/10 Low
- Heat 6/10 Major 8 d/yr ≥88°F today · 23 d/yr by 30 yrs out
- Wind 1/10 Low
- Air quality 5/10 Major 7 unhealthy d/yr today · 7 by 30 yrs out
Nearby sold comps map
Loading sold comps map…
Walkable amenities ~0.75 mi
Loading nearby amenities…
Taxation est. · year 1
- Rental income
- $237,876
- − Mortgage interest
- −$123,234
- − Property taxes
- −$4,995
- − Insurance
- −$11,000
- − Repairs & maintenance
- −$19,030
- − Management
- −$19,030
- − Depreciation
- −$64,000
- Taxable loss
- −$3,413
- Est. tax savings @ 24.0%
- +$819
- After-tax cash flow
- $34,302/yr
For passive investors: Depreciation is non-cash, so a rental often shows a tax loss while cash-flowing — sheltering income. Rental losses are passive: they offset passive income freely, and up to $25,000/yr can offset ordinary (W-2) income if you actively participate and your MAGI is under $100k (phasing out to $0 by $150k); unused losses carry forward. On sale, claimed depreciation is recaptured at up to 25%, and gains may owe capital-gains tax (a 1031 exchange can defer both). Figures are a year-1 estimate at your 24.0% rate — not tax advice; consult a CPA.
Schools (NCES district)
- District
- Los Angeles Unified
- NCES district ID
- 0622710
- Math proficiency
- 29% ▼ -4.00%
- Reading proficiency
- 54% ▲ 10.00%
- Median HH income
- $50,403
- Composite
- 35.67/100
- National rank
- #4875
- State rank
- #223 of 517 in CA
Livability — West Hollywood
- Score
- 70/100
- State rank
- #239
- US rank
- #7852
Category grades
Schools grade is shown separately in the Schools card above.
Census & demographics
- Census place
- West Hollywood, CA
- County
- Los Angeles County · 9,444,647 people
- City population
- 20,961
- Metro
- Los Angeles-Long Beach-Anaheim, CA
- Population (ZIP)
- 20,961
- Household income
- $107,987
- Rent vs Own
- Severe rent burden
- 2412.0
Population outlook (Los Angeles County) Hauer SSP2
- Today (2025)
- 10,940,515 people
- By 2030
- 11,256,481 · +2.9%
- By 2040
- 11,729,929 · +7.2%
- By 2050
- 11,948,407 · +9.2%
- By 2075
- 11,818,114 · +8.0%
- By 2100
- 10,842,928 · -0.9%
Race, ethnicity, and origin ACS 2023
- Neighborhood character
- Predominantly White (77%)
- Race & ethnicity
- White 77% Hispanic / Latino 8% Two or more races 8% Asian 6% Black 3%
- Hispanic origin (detail)
- Mexican 4%
- Common ancestry
- Scotch-Irish 6% Lithuanian 4% Italian 4%
- Foreign-born
- 21% · Canada, China, Jamaica
- Languages at home
- 77% English-only · Spanish 7% Other Indo-European 4% Russian/Polish/Slavic 3%
Political lean MEDSL · Los Angeles
- 2024 margin
- Solid D (+32.9) · D 64.8% · R 31.9% · Other 3.3%
- 2008→2024 swing
- -7.4pp toward R · 2008: 40.4pp · 2024: 32.9pp
- All cycles
- 2024: D+32.9 2020: D+44.2 2016: D+48.0 2012: D+40.0 2008: D+40.4
Not yet ingested
- Civics
- —
Market trends
- HPI YoY
- ▲ 0.76%
- Current HPI
- 323.1842
- Rent YoY
- ▼ -0.54%
- Metro
- Los Angeles-Long Beach-Anaheim, CA
- State GDP YoY
- ▲ 3.21%
- F500 in state
- 116
Industry mix (Fortune 500 HQ in CA)
| Industry | F500 HQs | Revenue |
|---|---|---|
| Technology | 27 | $1,492B |
|
||
| Financial Services | 3 | $174B |
|
||
| Retail | 3 | $44B |
|
||
| Insurance | 3 | $26B |
|
||
| Media / Entertainment | 2 | $115B |
|
||
| Pharmaceuticals / Biotech | 2 | $62B |
|
||
Price history
+87900.0% since first listed10 events — show timeline
- 2026-01-04 Price Changed $2,200,000 CRMLS
- 2025-12-05 Listed $2,500,000 CRMLS
- 2024-08-07 Rental Removed $2,295 RENT.
- 2024-07-31 Listed for Rent $2,295 RENT.
- 2024-04-10 Rental Removed $2,295 APPFOLIO
- 2024-04-03 Listed for Rent $2,295 APPFOLIO
- 2024-03-24 Rental Removed $2,400 APPFOLIO
- 2024-03-17 Price Changed $2,400 APPFOLIO
- 2024-03-13 Price Changed $2,300 APPFOLIO
- 2023-12-30 Listed for Rent $2,500 APPFOLIO
Property tax history
+1.8%/yrLatest (2025): $4,995 · +5.9% YoY. Source: county tax records.
Cash-flow waterfall
monthlySold comps — $/sqft
last 12 mo · ≤1 miLoading sold comps…