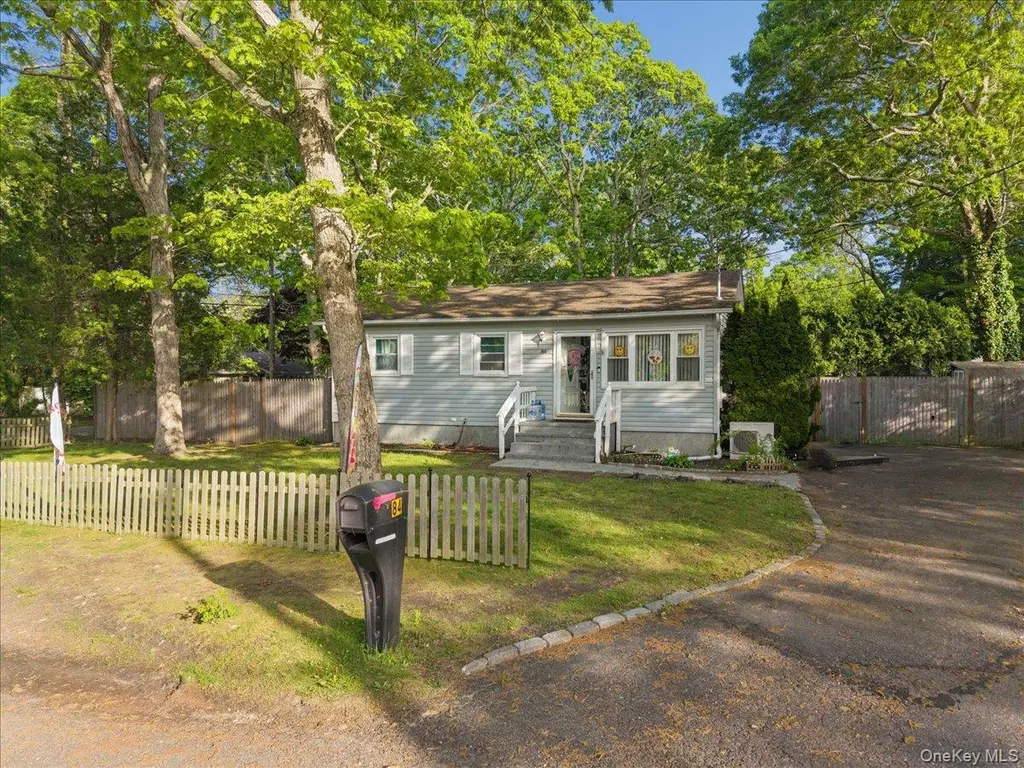
84 Queen Rd · Mastic Beach, NY
Flood risk 1/10 · Minimal
- FEMA flood zone
- X (unshaded)
- Chance of flooding over 30 yrs
- 0.0%
- Est. flood insurance / yr
- $473 – $860
Fire risk 1/10 · Minimal
- Est. fire insurance / yr
- $691 – $1,283
Heat risk 4/10 · Minor
- Hot days now (above 91°F)
- 7 days/yr
- Hot days in 30 yrs
- 19 days/yr
Wind risk 8/10 · Major
- Chance of severe wind over 30 yrs
- 80.0%
Air-quality risk 4/10 · Minor
- Unhealthy air days now
- 3 days/yr
- Unhealthy air days in 30 yrs
- 5 days/yr
Risk factors via First Street. Map © Google.
Why this score? — see what drove the C grade
The composite is a weighted blend of 9 inputs, each scored 0–100. Each bar is that input's sub-score; the figure is the points it added to the 100-point composite (weight × sub-score).
- ARV discount +13.0/15.0
- Cash flow +12.4/30.0
- Appreciation +10.0/10.0
- Schools +4.7/10.0
- DSCR +3.7/10.0
- 1% rule +3.5/10.0
- Livability +3.1/5.0
- Rent growth +2.5/5.0
- Condition / age +2.5/5.0
$425,000
🖨 Deal sheet 📄 Offer letter ✓ Due diligence
Listing remarks MLS
This Home Is Perfection, It Is A Beautiful 3 Bedroom Home With 2 Full Bathrooms. Wrapped Around this Gem Is A Gorgeous Fenced Yard. Full Basement With Heat. Low Taxes!!
Key facts
- 0.23 acre lot
- Built 1974
- Listed 10 days
Property features AI
Exterior
- Parking: Driveway parking; Off-street parking; Private parking
- Utilities: Electricity available; Electric service by local provider; Sewer: other
- Home design: Single-family residence; One-level home; Actual property condition
- Construction: Frame construction with vinyl siding; Full basement
- Exterior features: Fenced yard; Not a waterfront property
Interior
- Kitchen: Eat-in kitchen; Appliances included (other)
- Bedrooms: Includes a first-floor bedroom
- Bathrooms: 2 full bathrooms
- Heating & cooling: Baseboard heating; Oil heating; Ductless cooling
- Interior features: First-floor bedroom; Eat-in kitchen; Primary bathroom; Master suite on main level; Full attic with pull-down stairs; Double-pane windows; No basement (basement flagged as full elsewhere)
- Laundry & utility: Indoor laundry
Neighborhood map
What this means for you Summary
Snapshot
- This is a 3-bed/2.0-bath single-family listed at $425k.
Deal economics
- At list price, monthly cash flow is $-67 ($-804/yr) — negative.
- To cash-flow at today's rent, offer at most $413k (2.8% below list).
- To meet the 1% rule (rent ≥ 1% of price), the offer needs to be $361k (15.1% below list).
- Recommended offer: $361k (15.1% below list) — sets the bar for 1% rule.
- Cap rate 6.1% vs local median 4.7% in Mastic Beach — meaningfully above typical; check what's discounted (condition, days-on-market, listing class) to confirm the premium yield is real.
Location & tenants
- Location reads 61/100 on livability (#936 in NY) — a middle-class / working-renter tenant base. Strengths: employment A+, housing A+; Watch: crime D, amenities F, commute F.
- William Floyd Union Free School District (suburban): math 48% / reading 57% proficiency, ranked #309 of 590 in NY (top 52%) — acceptable for families but not a draw, mixed tenant base, ~2y average lease.
- Zoned schools: William Paca Middle School (math 31% / reading 37%, grade F, #497 of 729 statewide, top 69%, 1,009 students, 59% FRL); William Floyd High School (math 65% / reading 87%, grade A-, #616 of 1,100 statewide, top 57%, 3,013 students, 54% FRL).
- Market conditions: 133 active listings in the ZIP; 5 comparable units currently listed for rent nearby; rentals at typical pace (median 17d on market — plan ~3-4 weeks tenant-placement turnaround); 1,366 units permitted in Suffolk County in 2024 (216 in 5+ unit buildings).
Forward outlook
- In year one you build about $45k of equity ($3k loan paydown + $42k appreciation (10.0% local appreciation)).
- Suffolk County population projected to shrink 5% by 2050 — rents likely to lag national; underwrite the cash flow, not the appreciation.
- At projected returns (10.0% appreciation + 3.0% rent growth), your $119k cash investment doubles in ~3 years — after that, you're playing with house money.
- By year 2, paydown + projected appreciation supports a ~$73k cash-out refi (75% LTV) — recoverable capital for the next deal without selling this one.
Negotiation context
- Only 10 days on market — expect competitive offers; lowballing is unlikely to land.
- 6 sale attempts since 10y ago with the ask held roughly flat each time — persistent listings suggest the price (not the market) is what's stuck; bring a comps-based counter.
- Current owner paid $285k; 49% above their basis — modest negotiation headroom, anchor on the comps not their cost.
Risks & watch-outs
- Climate carrying-cost: severe wind risk, 80% chance of damaging wind over 30y — expect insurance premiums to compound above CPI over the hold.
Questions for the listing agent
- What do current leases actually rent for vs. the listed asking? Can we see a recent rent roll and the last 12 months of T-12 income?
- Built in 1974 — when were the roof, HVAC, electrical panel, plumbing, and water heater last replaced?
- Is there a deadline driving the sale (1031 exchange, divorce, estate, relocation)? That informs how much negotiation room exists.
- Schools are D-rated, which usually means shorter tenancies and higher turnover. Who's the typical renter profile here, and what's been the actual vacancy rate?
- Crime grade is D in this area — have there been break-ins, vandalism, or insurance claims at this property in the last 3 years? What carrier currently insures it and at what premium?
- What's the average days-on-market for RENTAL listings here right now (not sales)? A rising rental-DOM trend means longer vacancies and softer asking-rent achievability than the comps imply.
- What's the recent tenant-quality profile in this submarket — average credit score on applications, eviction rate, late-payment / NSF rate, and stable-employment percentage? A property-management company in the area should have these aggregated.
- How much new for-sale + rental construction is in the pipeline within 1–3 miles? Heavy new supply typically softens prices + rents 12–24 months out; constrained supply supports both.
Investment metrics
- 1% rule
- 0.85% ✗
- Cap rate
- 6.10%
- Cash-on-cash
- -0.68%
- DSCR
- 0.97
- GRM
- 9.8
CMA / ARV
- ARV (on-the-fly)
- $483,778
- Comps found
- 12
Show comp detail 12 sales within ~0.75 mi
| Address | Dist | Beds/Ba | Sqft | Sold | Price | $/sf | Match |
|---|---|---|---|---|---|---|---|
| 307 Jefferson Dr | 0.23mi | 3/2.0 | 1,024 (-7%) | 2mo | $560,000 | $547 | 76 |
| 289 Jefferson | 0.16mi | 3/1.0 | 1,014 (-8%) | 2mo | $445,000 | $439 | 74 |
| 237 Cypress Dr | 0.27mi | 3/2.0 | 1,008 (-8%) | 3mo | $465,000 | $461 | 71 |
| 181 Cypress Dr | 0.09mi | 2/1.0 (-1) | 1,200 (+9%) | 2mo | $276,000 | $230 | 71 |
| 8 Barclay Rd | 0.18mi | 3/1.0 | 1,000 (-9%) | 8mo | $350,000 | $350 | 66 |
| 166 Neighborhood Rd | 0.34mi | 2/1.5 (-1) | 1,176 (+7%) | 3mo | $463,500 | $394 | 63 |
| 129 Lakeview Dr | 0.27mi | 3/1.0 | 954 (-13%) | 1mo | $515,000 | $540 | 61 |
| 139 Washington Ave | 0.33mi | 3/1.0 | 1,008 (-8%) | 7mo | $470,000 | $466 | 60 |
| 161 Washington Dr | 0.44mi | 3/1.5 | 1,200 (+9%) | 5mo | $440,000 | $367 | 59 |
| 152 Dogwood Rd | 0.55mi | 3/2.0 | 991 (-10%) | 1mo | $525,000 | $530 | 57 |
| 142 Daisy Dr | 0.43mi | 3/1.0 | 957 (-13%) | 8mo | $315,000 | $329 | 47 |
| 303 Orchid Dr | 0.71mi | 3/1.0 | 1,200 (+9%) | 7mo | $478,000 | $398 | 42 |
Match score weights: distance 35% · size 25% · config 20% · recency 20%. Top-matched comps best support the ARV.
Projected returns pro-forma
10.0% appreciation · 3.0% rent growth · sell at horizon
- IRR
- 23.8%
- Equity multiple
- 2.91×
- Total profit
- $227,242
- Equity at exit
- $382,874
- IRR
- 21.1%
- Equity multiple
- 6.65×
- Total profit
- $672,630
- Equity at exit
- $825,682
Cash invested: $119,000 (down + closing). Projections, not guarantees.
Landlord ↔ Tenant lean methodology
- Overall (STATE)
- 15 Strongly Tenant-Friendly
- State New York
- 15 Strongly Tenant-Friendly · D+10
- County
- — inherits STATE
- City
- — inherits STATE
ZIP-level market 11951
- Home prices YoY
- 4.3%
- Active inventory
- 133
- Price-to-rent
- 9.8×
Monthly cashflow live
- Estimated rent
- $3,608 high interval (Pro) →
- Mortgage (P&I)
- −$2,229
- Tax from tax record
- −$512 /mo · $6,141/yr
- Insurance
- −$177
- HOA
- −$0
- Vacancy / Maint / Mgmt
- −$758
- Net cashflow
- $-67
Break-even live
UW: 25.0% down · 7.5% · 30yr · 1.5% tax · 5.0% vac · 8.0% maint · 8.0% mgmt
Financing live
Cash to close
- Down payment
- $106,250
- Closing costs
- $12,750
- Reserves months
- —
- Total cash needed
- —
Loan-product check · same deal, 3 products live
Conventional
25% down · 7.5% · 30yr
- Down + closing
- —
- Monthly P&I
- —
- Monthly cashflow
- —
- DSCR
- —
- Eligible?
- —
Personal DTI + credit; lowest rate.
DSCR
20% down · 8.5% · 30yr
- Down + closing
- —
- Monthly P&I
- —
- Monthly cashflow
- —
- DSCR
- —
- Eligible?
- —
No personal income docs; deal must DSCR.
Hard money
10% down · 12.0% · 12mo
- Down + closing
- —
- Monthly P&I
- —
- Monthly cashflow
- —
- DSCR
- —
- Eligible?
- —
Short-term bridge; refi at stabilization.
Rent comps 5 comps
| Address | Beds | Baths | Sqft | Rent | $/sqft | DOM | Units | Dist |
|---|---|---|---|---|---|---|---|---|
| 192 Cypress Dr Mastic Beach, NY | 4.0 | 2.0 | 1404 | $3,800 | $2.71 | 44d | 1 | 0.07mi |
| 149 Washington Dr Mastic Beach, NY | 3.0 | 1.0 | 1152 | $3,400 | $2.95 | 1d | 1 | 0.49mi |
| 5 Cedar Rd E Mastic Beach, NY | 3.0 | 1.0 | 740 | $2,900 | $3.92 | 1d | 1 | 0.60mi |
| 12 Hackensack Rd Mastic Beach, NY | 3.0 | 1.0 | 792 | $3,150 | $3.98 | 17d | 1 | 1.38mi |
| 48 Eleanor Ave Mastic, NY | 3.0 | 1.0 | 975 | $3,500 | $3.59 | 24d | 1 | 1.42mi |
Listing history 8 events
-
2026-06-18days on market $425,000 Active 10 DOM
-
2026-06-17days on market $425,000 Active 9 DOM
-
2026-06-16days on market $425,000 Active 8 DOM
-
2026-06-15days on market $425,000 Active 7 DOM
-
2026-06-13days on market $425,000 Active 5 DOM
-
2026-06-13days on market $425,000 Active 4 DOM
-
2026-06-10remarks 699-char remark
-
2026-06-10$425,000 Active 1 DOM
ⓘ Source: listings_history table (triggers on properties + properties_extension) + one-shot
backfill from property_details.listing_events for pre-trigger history.
Tax reassessment forecast NY · Partial reset (capped growth)
- Current annual tax
- $6,141 · $512/mo
- Projected year-2 tax
- $6,662 · $555/mo
- Expected delta
- +$521/yr (+$43/mo · 8.5%)
ⓘ Screening estimate from a state-policy table — verify with the county assessor before closing.
Climate risk First Street
- Flood 1/10 Low FEMA zone X (unshaded) · 0% chance over 30 yrs
- Wildfire 1/10 Low
- Heat 4/10 Moderate 7 d/yr ≥91°F today · 19 d/yr by 30 yrs out
- Wind 8/10 Severe 80% chance of damaging wind over 30 yrs
- Air quality 4/10 Moderate 3 unhealthy d/yr today · 5 by 30 yrs out
Nearby sold comps map
Loading sold comps map…
Walkable amenities ~0.75 mi
Loading nearby amenities…
Taxation est. · year 1
- Rental income
- $43,300
- − Mortgage interest
- −$23,807
- − Property taxes
- −$6,141
- − Insurance
- −$2,125
- − Repairs & maintenance
- −$3,464
- − Management
- −$3,464
- − Depreciation
- −$12,364
- Taxable loss
- −$8,064
- Est. tax savings @ 24.0%
- +$1,935
- After-tax cash flow
- $1,132/yr
For passive investors: Depreciation is non-cash, so a rental often shows a tax loss while cash-flowing — sheltering income. Rental losses are passive: they offset passive income freely, and up to $25,000/yr can offset ordinary (W-2) income if you actively participate and your MAGI is under $100k (phasing out to $0 by $150k); unused losses carry forward. On sale, claimed depreciation is recaptured at up to 25%, and gains may owe capital-gains tax (a 1031 exchange can defer both). Figures are a year-1 estimate at your 24.0% rate — not tax advice; consult a CPA.
Schools (NCES district)
- District
- William Floyd Union Free School District
- NCES district ID
- 3618690
- Math proficiency
- 48% ▲ 3.00%
- Reading proficiency
- 57% ▲ 11.00%
- Median HH income
- $70,564
- Composite
- 46.79/100
- National rank
- #2383
- State rank
- #309 of 590 in NY
Livability — Mastic Beach
- Score
- 61/100
- State rank
- #936
- US rank
- #18216
Category grades
Schools grade is shown separately in the Schools card above.
Census & demographics
- Census place
- Mastic Beach, NY
- City population
- 15,830
- Population (ZIP)
- 15,830
Population outlook (Suffolk County) Hauer SSP2
- Today (2025)
- 1,505,262 people
- By 2030
- 1,498,318 · -0.5%
- By 2040
- 1,471,101 · -2.3%
- By 2050
- 1,424,848 · -5.3%
- By 2075
- 1,337,157 · -11.2%
- By 2100
- 1,217,720 · -19.1%
Race, ethnicity, and origin ACS 2023
- Neighborhood character
- Predominantly White (68%)
- Race & ethnicity
- White 68% Hispanic / Latino 17% Two or more races 9% Black 6% Asian 2%
- Hispanic origin (detail)
- Mexican 1% Puerto Rican 6% Cuban 2%
- Common ancestry
- Lithuanian 3% Romanian 2% Italian 2%
- Foreign-born
- 7% · Canada, Vietnam
- Languages at home
- 84% English-only · Spanish 10% Other Indo-European 3% Chinese 1%
Political lean MEDSL · Suffolk
- 2024 margin
- Lean R (+10.0) · D 45.0% · R 55.0%
- 2008→2024 swing
- -16.0pp toward R · 2008: 6.0pp · 2024: -10.0pp
- All cycles
- 2024: R+10.0 2020: R+0.0 2016: R+8.2 2012: D+2.9 2008: D+6.0
Not yet ingested
- Civics
- —
Market trends
- HPI YoY
- ▲ 34.46%
- Current HPI
- 829.86
- Rent YoY
- —
- Metro
- —
- State GDP YoY
- ▲ 2.60%
- F500 in state
- 92
Industry mix (Fortune 500 HQ in NY)
| Industry | F500 HQs | Revenue |
|---|---|---|
| Financial Services | 10 | $950B |
|
||
| Consumer Goods | 9 | $162B |
|
||
| Insurance | 4 | $225B |
|
||
| Telecommunications | 2 | $144B |
|
||
| Pharmaceuticals | 2 | $112B |
|
||
| Media / Entertainment | 2 | $69B |
|
||
Price history
+470.5% since first listed18 events — show timeline
- 2026-05-26 Listed $425,000 OneKey® MLS as Distributed by MLS Grid
- 2021-07-12 Sold (Public Records) $285,000 Public Records
- 2021-01-20 Sold (MLS) $301,100 OneKey® MLS as Distributed by MLS Grid
- 2020-10-05 Relisted — OneKey® MLS as Distributed by MLS Grid
- 2020-10-03 Listing Removed — OneKey® MLS as Distributed by MLS Grid
- 2020-10-03 Relisted — OneKey® MLS as Distributed by MLS Grid
- 2020-09-24 Listing Removed — OneKey® MLS as Distributed by MLS Grid
- 2020-09-19 Relisted — OneKey® MLS as Distributed by MLS Grid
- 2020-09-13 Listing Removed — OneKey® MLS as Distributed by MLS Grid
- 2020-09-13 Listed $279,000 OneKey® MLS as Distributed by MLS Grid
- 2020-09-02 Coming Soon $279,000 OneKey® MLS as Distributed by MLS Grid
- 2017-03-01 Listing Removed — OneKey® MLS as Distributed by MLS Grid
- 2016-10-24 Price Changed $199,000 OneKey® MLS as Distributed by MLS Grid
- 2016-09-30 Price Changed $207,000 OneKey® MLS as Distributed by MLS Grid
- 2016-08-17 Listed $215,000 OneKey® MLS as Distributed by MLS Grid
- 2005-08-23 Sold (Public Records) $253,000 Public Records
- 2004-08-20 Sold (Public Records) $230,000 Public Records
- 2000-03-14 Sold (Public Records) $74,500 Public Records
Property tax history
+0.9%/yrLatest (2025): $6,141 · +0.0% YoY. Source: county tax records.
Cash-flow waterfall
monthlySold comps — $/sqft
last 12 mo · ≤1 miLoading sold comps…