189 Chinkapin Rill · Fenton, MI
Flood risk No data
- FEMA flood zone
- —
- Chance of flooding over 30 yrs
- —
- Est. flood insurance / yr
- —
Fire risk No data
- Est. fire insurance / yr
- —
Heat risk No data
- Hot days now (above threshold)
- —
- Hot days in 30 yrs
- —
Wind risk No data
- Chance of severe wind over 30 yrs
- —
Air-quality risk No data
- Unhealthy air days now
- —
- Unhealthy air days in 30 yrs
- —
Risk factors via First Street. Map © Google.
Why this score? — see what drove the B grade
The composite is a weighted blend of 9 inputs, each scored 0–100. Each bar is that input's sub-score; the figure is the points it added to the 100-point composite (weight × sub-score).
- Cash flow +30.0/30.0
- 1% rule +10.0/10.0
- DSCR +10.0/10.0
- ARV discount +7.5/15.0
- Schools +4.2/10.0
- Livability +3.9/5.0
- Condition / age +3.8/5.0
- Rent growth +3.1/5.0
- Appreciation +0.0/10.0
$62,000
🖨 Deal sheet 📄 Offer letter ✓ Due diligence
Listing remarks MLS
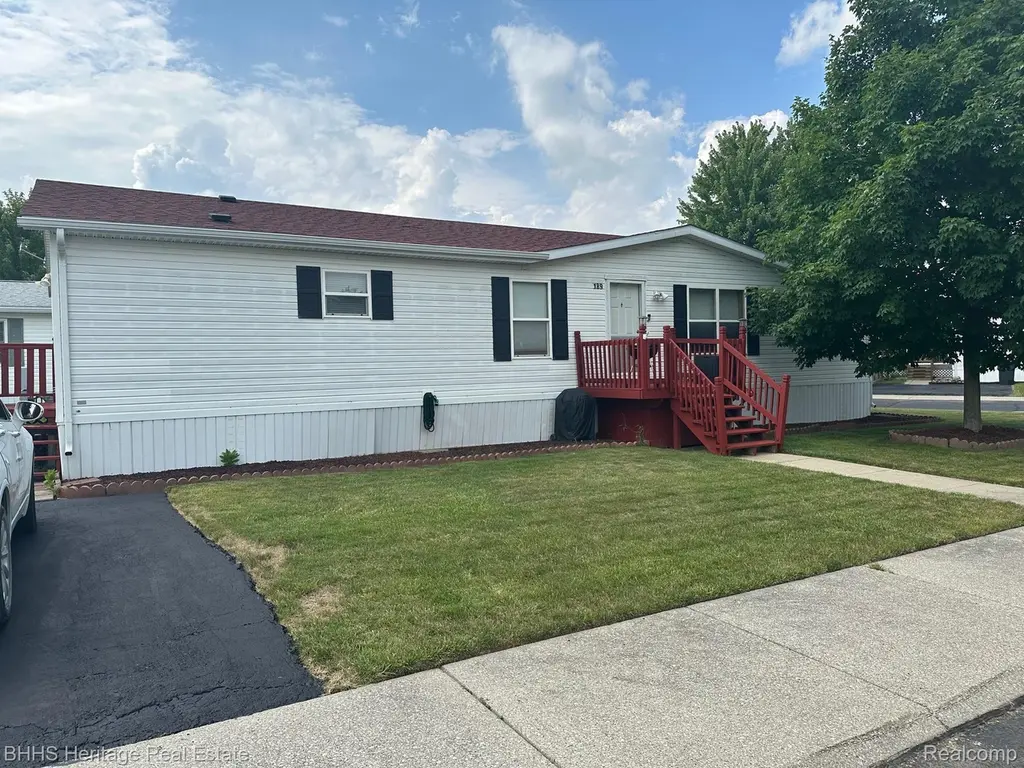
Well-maintained manufactured home located in a desirable community just minutes from shopping and entertainment. This inviting home offers 3 bedrooms, 2 full baths, an open floor plan, and a spacious family room - perfect for everyday living and entertaining. Situated on a premium corner lot, the property also includes a convenient storage shed. Numerous updates provide peace of mind, including a new front door (2021), water heater (2021), furnace (2012), roof (2017), A/C unit (2017), and dishwasher (2022). An excellent opportunity for affordable living! Buyer must apply for and be approved by park management.
Key facts
- Water heater
- Replaced roof
- New front door
Tags
Neighborhood map
What this means for you Summary
Snapshot
- This is a 3-bed/2.0-bath other listed at $62k. Condition is rated good.
Deal economics
- At list price, monthly cash flow is $468 ($6k/yr) — positive.
- The deal already cash-flows at list — no discount required.
- Meets the 1% rule at list price ($2k rent vs $62k).
- Recommended offer: $55k (12.0% below list) — sets the bar for market timing.
- Cap rate 15.4% vs local median 3.0% in Fenton — top-decile yield for the area; either an underpriced asset or a hidden risk that comps aren't pricing in. Stress-test before assuming the spread holds.
Location & tenants
- Location reads 77/100 on livability (#130 in MI, #3,197 nationally) — a middle-class / working-renter tenant base. Strengths: cost of living A+, housing A+, health & safety A-; Watch: amenities F, commute F.
- Fenton Area Public Schools (suburban): math 38% / reading 57% proficiency, ranked #112 of 540 in MI (top 21%) — families likely to look elsewhere, expect single-tenant / working-renter base with shorter leases.
- Market conditions: Rents rising (+2.6%/yr); 311 active listings in the ZIP; 2 comparable units currently listed for rent nearby; solid renter incomes; 419 units permitted in Genesee County in 2024 (68 in 5+ unit buildings).
Forward outlook
- Local home prices are declining (-3.0%/yr); year-one equity from $429 of loan paydown is wiped out by about $2k of value loss. Plan a longer hold.
- Genesee County population projected at -27% by 2050 — secular population decline; favor cash flow + early exit over multi-decade hold.
- At projected returns (-3.0% appreciation + 2.6% rent growth), your $17k cash investment doubles in ~4 years — after that, you're playing with house money.
Negotiation context
- It's been on market 334 days — a 12% lower offer ($55k) is reasonable based on typical stale-listing flexibility.
- 2 sale attempts; this cycle's ask has dropped $8k (11%) from the opening price — seller is motivated, your offer sets the floor, not the list.
Risks & watch-outs
- Watch-outs: HOA is 30% of rent.
Questions for the listing agent
- It's been on market 334 days. Have you received any prior offers? Is the seller open to a 12% concession, seller financing, or rate buy-down credit?
- What does the HOA fee cover, when was the last increase, and are there any pending special assessments or reserve-fund shortfalls?
- Why hasn't it sold? Are there any deal-killer items the seller is aware of (foundation, flood, title, zoning, code violations)?
- Is there a deadline driving the sale (1031 exchange, divorce, estate, relocation)? That informs how much negotiation room exists.
- Schools are B-rated — typically a magnet for longer-tenancy family renters. What's the average tenant stay here, and is there a school-zone premium baked into asking?
- What's the average days-on-market for RENTAL listings here right now (not sales)? A rising rental-DOM trend means longer vacancies and softer asking-rent achievability than the comps imply.
- What's the recent tenant-quality profile in this submarket — average credit score on applications, eviction rate, late-payment / NSF rate, and stable-employment percentage? A property-management company in the area should have these aggregated.
- How much new for-sale + rental construction is in the pipeline within 1–3 miles? Heavy new supply typically softens prices + rents 12–24 months out; constrained supply supports both.
Investment metrics
- 1% rule
- 2.93% ✓
- Cap rate
- 15.35%
- Cash-on-cash
- 32.35%
- DSCR
- 2.44
- GRM
- 2.8
CMA / ARV
- ARV (median comp)
- $312,293
- List price
- $62,000
- Delta
- -80.15%
- Verdict
- UNDERPRICED
- Comps
- 16 within 1.0 mi
Projected returns pro-forma
-3.0% appreciation · 2.59% rent growth · sell at horizon
- IRR
- 27.0%
- Equity multiple
- 2.12×
- Total profit
- $19,373
- Equity at exit
- $9,244
- IRR
- 34.4%
- Equity multiple
- 4.09×
- Total profit
- $53,670
- Equity at exit
- $5,361
Cash invested: $17,360 (down + closing). Projections, not guarantees.
Landlord ↔ Tenant lean methodology
- Overall (STATE)
- 62 Landlord-Friendly
- State Michigan
- 62 Landlord-Friendly · EVEN
- County
- — inherits STATE
- City
- — inherits STATE
ZIP-level market 48430
- Rents YoY
- 2.6%
- Active inventory
- 311
- Price-to-rent
- 2.8×
Monthly cashflow live
- Estimated rent
- $1,818 medium interval (Pro) →
- Mortgage (P&I)
- −$325
- Tax est. 1.5%
- −$78 /mo · $930/yr
- Insurance
- −$26
- HOA
- −$540
- Vacancy / Maint / Mgmt
- −$382
- Net cashflow
- $468
Break-even live
UW: 25.0% down · 7.5% · 30yr · 1.5% tax · 5.0% vac · 8.0% maint · 8.0% mgmt
Financing live
Cash to close
- Down payment
- $15,500
- Closing costs
- $1,860
- Reserves months
- —
- Total cash needed
- —
Loan-product check · same deal, 3 products live
Conventional
25% down · 7.5% · 30yr
- Down + closing
- —
- Monthly P&I
- —
- Monthly cashflow
- —
- DSCR
- —
- Eligible?
- —
Personal DTI + credit; lowest rate.
DSCR
20% down · 8.5% · 30yr
- Down + closing
- —
- Monthly P&I
- —
- Monthly cashflow
- —
- DSCR
- —
- Eligible?
- —
No personal income docs; deal must DSCR.
Hard money
10% down · 12.0% · 12mo
- Down + closing
- —
- Monthly P&I
- —
- Monthly cashflow
- —
- DSCR
- —
- Eligible?
- —
Short-term bridge; refi at stabilization.
Rent comps 2 comps
| Address | Beds | Baths | Sqft | Rent | $/sqft | DOM | Units | Dist |
|---|---|---|---|---|---|---|---|---|
| 3800 Arbor Dr Fenton, MI | 2.0 | 1.0–2.0 | 762 | $1,749 | $2.29 | 1d | 1 | 1.21mi |
| 3200 Foley Glen Dr Fenton, MI | 1.0–2.0 | 1.0–2.0 | 1137 | $1,828 | $1.61 | 1d | 5 | 1.43mi |
HOA detail
- Monthly dues
- $540 · $6,480/yr
- Likely covers
- water
Listing history 16 events
-
2026-06-18days on market $62,000 Active 334 DOM
-
2026-06-17days on market $62,000 Active 333 DOM
-
2026-06-16days on market $62,000 Active 332 DOM
-
2026-06-15days on market $62,000 Active 331 DOM
-
2026-06-13days on market $62,000 Active 329 DOM
-
2026-06-09days on market $62,000 Active 325 DOM
-
2026-06-08days on market $62,000 Active 324 DOM
-
2026-06-07days on market $62,000 Active 323 DOM
-
2026-06-04days on market $62,000 Active 320 DOM
-
2026-06-02days on market $62,000 Active 318 DOM
-
2026-06-01days on market $62,000 Active 317 DOM
-
2026-05-31days on market $62,000 Active 316 DOM
-
2025-12-13price $62,000 617-char remark
Show marketing remark (617 chars)
Well-maintained manufactured home located in a desirable community just minutes from shopping and entertainment. This inviting home offers 3 bedrooms, 2 full baths, an open floor plan, and a spacious family room - perfect for everyday living and entertaining. Situated on a premium corner lot, the property also includes a convenient storage shed. Numerous updates provide peace of mind, including a new front door (2021), water heater (2021), furnace (2012), roof (2017), A/C unit (2017), and dishwasher (2022). An excellent opportunity for affordable living! Buyer must apply for and be approved by park management.
-
2025-12-12price $62,000 621-char remark
Show marketing remark (621 chars)
Well-maintained manufactured home located in a desirable community just minutes from shopping and entertainment. This inviting home offers 3 bedrooms, 2 full baths, an open floor plan, and a spacious family room—perfect for everyday living and entertaining. Situated on a premium corner lot, the property also includes a convenient storage shed. Numerous updates provide peace of mind, including a new front door (2021), water heater (2021), furnace (2012), roof (2017), A/C unit (2017), and dishwasher (2022). An excellent opportunity for affordable living! Buyer must apply for and be approved by park management.
-
2025-07-19$69,900 Active 621-char remark
Show marketing remark (621 chars)
Well-maintained manufactured home located in a desirable community just minutes from shopping and entertainment. This inviting home offers 3 bedrooms, 2 full baths, an open floor plan, and a spacious family room—perfect for everyday living and entertaining. Situated on a premium corner lot, the property also includes a convenient storage shed. Numerous updates provide peace of mind, including a new front door (2021), water heater (2021), furnace (2012), roof (2017), A/C unit (2017), and dishwasher (2022). An excellent opportunity for affordable living! Buyer must apply for and be approved by park management.
-
2025-07-18$69,900 Active 617-char remark
Show marketing remark (617 chars)
Well-maintained manufactured home located in a desirable community just minutes from shopping and entertainment. This inviting home offers 3 bedrooms, 2 full baths, an open floor plan, and a spacious family room - perfect for everyday living and entertaining. Situated on a premium corner lot, the property also includes a convenient storage shed. Numerous updates provide peace of mind, including a new front door (2021), water heater (2021), furnace (2012), roof (2017), A/C unit (2017), and dishwasher (2022). An excellent opportunity for affordable living! Buyer must apply for and be approved by park management.
ⓘ Source: listings_history table (triggers on properties + properties_extension) + one-shot
backfill from property_details.listing_events for pre-trigger history.
Nearby sold comps map
Loading sold comps map…
Walkable amenities ~0.75 mi
Loading nearby amenities…
Taxation est. · year 1
- Rental income
- $21,820
- − Mortgage interest
- −$3,473
- − Property taxes
- −$930
- − Insurance
- −$310
- − Repairs & maintenance
- −$1,746
- − Management
- −$1,746
- − HOA
- −$6,480
- − Depreciation
- −$1,804
- Taxable income
- $5,332
- Est. tax owed @ 24.0%
- −$1,280
- After-tax cash flow
- $4,336/yr
For passive investors: Depreciation is non-cash, so a rental often shows a tax loss while cash-flowing — sheltering income. Rental losses are passive: they offset passive income freely, and up to $25,000/yr can offset ordinary (W-2) income if you actively participate and your MAGI is under $100k (phasing out to $0 by $150k); unused losses carry forward. On sale, claimed depreciation is recaptured at up to 25%, and gains may owe capital-gains tax (a 1031 exchange can defer both). Figures are a year-1 estimate at your 24.0% rate — not tax advice; consult a CPA.
Condition & rehab AI · 12 photos
This well-maintained manufactured home is in good condition with minimal repairs needed. It offers a good balance of updates and potential for further value enhancement.
Value-add opportunities
- Resale Paint exterior siding — Fresh paint can enhance curb appeal and property value
- Rental Clean gutters — Clean gutters improve drainage and reduce maintenance costs
Renovation cost estimate screening
Value-add ROI direction
- Resale Paint exterior siding — Fresh paint can enhance curb appeal and property value ↑
- Rental Clean gutters — Clean gutters improve drainage and reduce maintenance costs ↑
ⓘ Cost ranges are severity-bucket heuristics (US national rule-of-thumb). Get contractor quotes + a written scope before underwriting a rehab budget.
Schools (NCES district)
- District
- Fenton Area Public Schools
- NCES district ID
- 2614250
- Math proficiency
- 38% ▼ -7.00%
- Reading proficiency
- 57% ▼ -2.00%
- Median HH income
- $60,377
- Composite
- 41.63/100
- National rank
- #3426
- State rank
- #112 of 540 in MI
Livability — Fenton
- Score
- 77/100
- State rank
- #130
- US rank
- #3197
Category grades
Schools grade is shown separately in the Schools card above.
Census & demographics
- Census place
- Fenton, MI
- County
- Livingston County · 121,626 people
- City population
- 39,309
- Metro
- Detroit-Warren-Dearborn, MI
- Population (ZIP)
- 39,309
- Household income
- $100,193
- Rent vs Own
- Severe rent burden
- 642.0
Population outlook (Genesee County) Hauer SSP2
- Today (2025)
- 381,312 people
- By 2030
- 362,731 · -4.9%
- By 2040
- 321,550 · -15.7%
- By 2050
- 279,212 · -26.8%
- By 2075
- 193,336 · -49.3%
- By 2100
- 128,118 · -66.4%
Race, ethnicity, and origin ACS 2023
- Neighborhood character
- Predominantly White (91%)
- Race & ethnicity
- White 91% Two or more races 4% Hispanic / Latino 3% Asian 1% Black 1%
- Common ancestry
- Romanian 10% Lithuanian 5% Slovak 3%
- Foreign-born
- 2% · Canada
- Languages at home
- 97% English-only · Spanish 1% Other Asian/Pacific 1% Other Indo-European 1%
Political lean MEDSL · Genesee
- 2024 margin
- Toss-up / Even · D 51.4% · R 47.2% · Other 1.4%
- 2008→2024 swing
- -28.3pp toward R · 2008: 32.5pp · 2024: 4.2pp
- All cycles
- 2024: D+4.2 2020: D+9.3 2016: D+9.5 2012: D+28.2 2008: D+32.5
Not yet ingested
- Civics
- —
Market trends
- HPI YoY
- ▼ -298.66%
- Current HPI
- 238.8371
- Rent YoY
- ▲ 2.59%
- Metro
- Detroit-Warren-Dearborn, MI
- State GDP YoY
- ▲ 1.37%
- F500 in state
- 28
Industry mix (Fortune 500 HQ in MI)
| Industry | F500 HQs | Revenue |
|---|---|---|
| Automotive Parts | 3 | $48B |
|
||
| Automotive | 2 | $372B |
|
||
| Chemicals | 1 | $45B |
|
||
| Automotive Retail | 1 | $29B |
|
||
| Healthcare / Medical Devices | 1 | $23B |
|
||
| Automotive Technology | 1 | $20B |
|
||
Price history
-11.3% since first listed4 events — show timeline
- 2025-12-13 Price Changed $62,000 MiRealSource-MiMLS
- 2025-12-12 Price Changed $62,000 REALCOMP
- 2025-07-19 Listed $69,900 REALCOMP
- 2025-07-18 Listed $69,900 MiRealSource-MiMLS
Property tax history
+2.4%/yrLatest (2025): $27 · +2.7% YoY. Source: county tax records.
Cash-flow waterfall
monthlySold comps — $/sqft
last 12 mo · ≤1 miLoading sold comps…