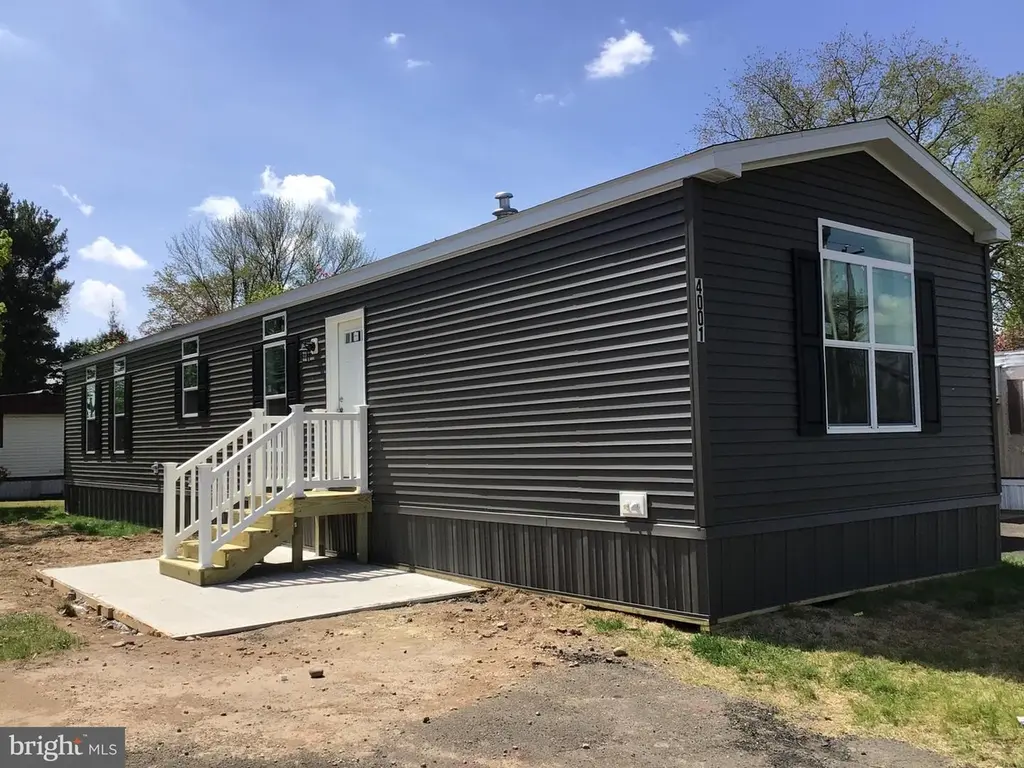
4001 Dalton Way · Falls, PA
Flood risk 1/10 · Minimal
- FEMA flood zone
- X (unshaded)
- Chance of flooding over 30 yrs
- 0.0%
- Est. flood insurance / yr
- $473 – $860
Fire risk 1/10 · Minimal
- Est. fire insurance / yr
- $511 – $949
Heat risk 6/10 · Moderate
- Hot days now (above 103°F)
- 7 days/yr
- Hot days in 30 yrs
- 15 days/yr
Wind risk 6/10 · Moderate
- Chance of severe wind over 30 yrs
- 27.0%
Air-quality risk 5/10 · Moderate
- Unhealthy air days now
- 6 days/yr
- Unhealthy air days in 30 yrs
- 8 days/yr
Risk factors via First Street. Map © Google.
Why this score? — see what drove the C+ grade
The composite is a weighted blend of 9 inputs, each scored 0–100. Each bar is that input's sub-score; the figure is the points it added to the 100-point composite (weight × sub-score).
- Cash flow +29.1/30.0
- DSCR +10.0/10.0
- 1% rule +8.1/10.0
- Schools +5.2/10.0
- Rent growth +3.3/5.0
- Livability +2.5/5.0
- Condition / age +2.5/5.0
- ARV discount +0.0/15.0
- Appreciation +0.0/10.0
$167,000
🖨 Deal sheet 📄 Offer letter ✓ Due diligence
Listing remarks MLS
Come see this brand-new Pine Grove home with a custom kitchen and upgrades throughout. Through the front door you will see an open concept living space with counter height seating, double sink and plenty of cabinet space. Primary bedroom features a walk in closet and full bath with walk in shower. The home has an additional bedroom, a hall bath and laundry room. The home comes with central air, an 8’ x 8’ custom modern shed and a 1-year manufacturer warranty. Schedule your showing today.
Key facts
- Custom kitchen
- Full bath
- Walk in closet
Tags
Neighborhood map
What this means for you Summary
Snapshot
- This is a 2-bed/2.0-bath single-family listed at $167k.
Deal economics
- At list price, monthly cash flow is $579 ($7k/yr) — positive.
- The deal already cash-flows at list — no discount required.
- Meets the 1% rule at list price ($2k rent vs $167k).
- Recommended offer: $147k (12.0% below list) — sets the bar for market timing.
Location & tenants
- Location reads: area grade C — affects rentability + tenant quality, not the cash-flow math above.
- Pennsbury SD (suburban): math 46% / reading 69% proficiency, ranked #67 of 539 in PA (top 12%) — acceptable for families but not a draw, mixed tenant base, ~2y average lease; only 15% free/reduced lunch — higher-income household profile.
- Market conditions: Rents rising (+3.1%/yr); 168 active listings in the ZIP; high-income renter base; 663 units permitted in Bucks County in 2024 (106 in 5+ unit buildings).
Forward outlook
- Local home prices are declining (-3.0%/yr); year-one equity from $1k of loan paydown is wiped out by about $5k of value loss. Plan a longer hold.
- Bucks County population projected to shrink 7% by 2050 — rents likely to lag national; underwrite the cash flow, not the appreciation.
- At projected returns (-3.0% appreciation + 3.1% rent growth), your $47k cash investment doubles in ~8 years — after that, you're playing with house money.
Negotiation context
- It's been on market 407 days — a 12% lower offer ($147k) is reasonable based on typical stale-listing flexibility.
- 2 sale attempts since 27y ago; this cycle's ask has dropped $15k (8%) from the opening price — seller is motivated, your offer sets the floor, not the list.
Risks & watch-outs
- Climate carrying-cost: major wind risk, 27% chance of damaging wind over 30y; extreme-heat days projected 7→15/yr by 2055 (HVAC capex compounding) — expect insurance premiums to compound above CPI over the hold.
Questions for the listing agent
- It's been on market 407 days. Have you received any prior offers? Is the seller open to a 12% concession, seller financing, or rate buy-down credit?
- Why hasn't it sold? Are there any deal-killer items the seller is aware of (foundation, flood, title, zoning, code violations)?
- Is there a deadline driving the sale (1031 exchange, divorce, estate, relocation)? That informs how much negotiation room exists.
- What's the average days-on-market for RENTAL listings here right now (not sales)? A rising rental-DOM trend means longer vacancies and softer asking-rent achievability than the comps imply.
- What's the recent tenant-quality profile in this submarket — average credit score on applications, eviction rate, late-payment / NSF rate, and stable-employment percentage? A property-management company in the area should have these aggregated.
- How much new for-sale + rental construction is in the pipeline within 1–3 miles? Heavy new supply typically softens prices + rents 12–24 months out; constrained supply supports both.
Investment metrics
- 1% rule
- 1.31% ✓
- Cap rate
- 10.45%
- Cash-on-cash
- 14.85%
- DSCR
- 1.66
- GRM
- 6.3
CMA / ARV
- ARV (median comp)
- $135,811
- List price
- $167,000
- Delta
- 22.96%
- Verdict
- OVERPRICED
- Comps
- 20 within 1.0 mi
Show comp detail 12 sales within ~0.75 mi
| Address | Dist | Beds/Ba | Sqft | Sold | Price | $/sf | Match |
|---|---|---|---|---|---|---|---|
| 1119 Anders Dr | 0.15mi | 2/2.0 | 1,056 (0%) | 0mo | $125,000 | $118 | 93 |
| 3057 Chandler Dr | 0.17mi | 2/2.0 | 1,056 (0%) | 4mo | $135,000 | $128 | 89 |
| 3051 Chandler Dr | 0.15mi | 2/2.0 | 1,056 (0%) | 6mo | $134,000 | $127 | 88 |
| 3034 Chandler Drive South | 0.10mi | 2/2.0 | 1,108 (+5%) | 1mo | $180,000 | $162 | 86 |
| 4307 Dover Dr | 0.11mi | 2/2.0 | 1,120 (+6%) | 4mo | $160,000 | $143 | 82 |
| 5130 Gowan Dr | 0.36mi | 2/2.0 | 1,056 (0%) | 3mo | $154,000 | $146 | 81 |
| 7616 Hunter Dr | 0.21mi | 2/2.0 | 1,072 (+2%) | 8mo | $140,000 | $131 | 81 |
| 2027 Beatty Dr | 0.37mi | 3/2.0 (+1) | 1,056 (0%) | 3mo | $150,000 | $142 | 75 |
| 6319 Fuller Dr | 0.24mi | 3/2.0 (+1) | 1,000 (-5%) | 0mo | $72,000 | $72 | 74 |
| 7503 Harper Dr Unit T 7503 | 0.23mi | 2/2.0 | 980 (-7%) | 5mo | $67,000 | $68 | 73 |
| 1020 Aldrich Dr | 0.16mi | 3/2.0 (+1) | 1,104 (+4%) | 10mo | $150,000 | $136 | 72 |
| 7008 Huber Dr | 0.45mi | 2/2.0 | 1,120 (+6%) | 5mo | $143,000 | $128 | 65 |
Match score weights: distance 35% · size 25% · config 20% · recency 20%. Top-matched comps best support the ARV.
Projected returns pro-forma
-3.0% appreciation · 3.12% rent growth · sell at horizon
- IRR
- 5.5%
- Equity multiple
- 1.22×
- Total profit
- $10,083
- Equity at exit
- $24,900
- IRR
- 15.1%
- Equity multiple
- 2.23×
- Total profit
- $57,451
- Equity at exit
- $14,439
Cash invested: $46,760 (down + closing). Projections, not guarantees.
Landlord ↔ Tenant lean methodology
- Overall (STATE)
- 62 Landlord-Friendly
- State Pennsylvania
- 62 Landlord-Friendly · EVEN
- County
- — inherits STATE
- City
- — inherits STATE
ZIP-level market 19067
- Rents YoY
- 3.1%
- Active inventory
- 168
- Price-to-rent
- 6.3×
Monthly cashflow live
- Estimated rent
- $2,193 medium interval (Pro) →
- Mortgage (P&I)
- −$876
- Tax est. 1.5%
- −$209 /mo · $2,505/yr
- Insurance
- −$70
- HOA
- −$0
- Vacancy / Maint / Mgmt
- −$461
- Net cashflow
- $579
Break-even live
UW: 25.0% down · 7.5% · 30yr · 1.5% tax · 5.0% vac · 8.0% maint · 8.0% mgmt
Financing live
Cash to close
- Down payment
- $41,750
- Closing costs
- $5,010
- Reserves months
- —
- Total cash needed
- —
Loan-product check · same deal, 3 products live
Conventional
25% down · 7.5% · 30yr
- Down + closing
- —
- Monthly P&I
- —
- Monthly cashflow
- —
- DSCR
- —
- Eligible?
- —
Personal DTI + credit; lowest rate.
DSCR
20% down · 8.5% · 30yr
- Down + closing
- —
- Monthly P&I
- —
- Monthly cashflow
- —
- DSCR
- —
- Eligible?
- —
No personal income docs; deal must DSCR.
Hard money
10% down · 12.0% · 12mo
- Down + closing
- —
- Monthly P&I
- —
- Monthly cashflow
- —
- DSCR
- —
- Eligible?
- —
Short-term bridge; refi at stabilization.
Listing history 19 events
-
2026-06-18days on market $167,000 Active 407 DOM
-
2026-06-17days on market $167,000 Active 406 DOM
-
2026-06-16days on market $167,000 Active 405 DOM
-
2026-06-15days on market $167,000 Active 404 DOM
-
2026-06-13days on market $167,000 Active 402 DOM
-
2026-06-13days on market $167,000 Active 401 DOM
-
2026-06-09days on market $167,000 Active 398 DOM
-
2026-06-08days on market $167,000 Active 397 DOM
-
2026-06-07days on market $167,000 Active 396 DOM
-
2026-06-04days on market $167,000 Active 393 DOM
-
2026-06-03days on market $167,000 Active 392 DOM
-
2026-06-02days on market $167,000 Active 391 DOM
-
2026-06-01days on market $167,000 Active 390 DOM
-
2026-05-31remarks 513-char remark
-
2026-05-31pricedays on market $167,000 Active 389 DOM
-
2025-12-08price $175,000 545-char remark
Show marketing remark (545 chars)
Come see this brand-new Pine Grove home with a custom kitchen and upgrades throughout. Through the front door you will see an open concept living space with counter height seating, double sink and plenty of cabinet space. Primary bedroom features a walk in closet and full bath with walk in shower. The home has an additional bedroom, a hall bath and laundry room. The home comes with central air, an 8’ x 8’ custom modern shed and a 1-year manufacturer warranty. Schedule your showing today.
-
2025-05-07$181,900 Active 545-char remark
Show marketing remark (545 chars)
Come see this brand-new Pine Grove home with a custom kitchen and upgrades throughout. Through the front door you will see an open concept living space with counter height seating, double sink and plenty of cabinet space. Primary bedroom features a walk in closet and full bath with walk in shower. The home has an additional bedroom, a hall bath and laundry room. The home comes with central air, an 8’ x 8’ custom modern shed and a 1-year manufacturer warranty. Schedule your showing today.
-
2000-07-31historical
-
1999-07-24$13,900
ⓘ Source: listings_history table (triggers on properties + properties_extension) + one-shot
backfill from property_details.listing_events for pre-trigger history.
Climate risk First Street
- Flood 1/10 Low FEMA zone X (unshaded) · 0% chance over 30 yrs
- Wildfire 1/10 Low
- Heat 6/10 Major 7 d/yr ≥103°F today · 15 d/yr by 30 yrs out
- Wind 6/10 Major 27% chance of damaging wind over 30 yrs
- Air quality 5/10 Major 6 unhealthy d/yr today · 8 by 30 yrs out
Nearby sold comps map
Loading sold comps map…
Walkable amenities ~0.75 mi
Loading nearby amenities…
Taxation est. · year 1
- Rental income
- $26,318
- − Mortgage interest
- −$9,355
- − Property taxes
- −$2,505
- − Insurance
- −$835
- − Repairs & maintenance
- −$2,105
- − Management
- −$2,105
- − Depreciation
- −$4,858
- Taxable income
- $4,555
- Est. tax owed @ 24.0%
- −$1,093
- After-tax cash flow
- $5,849/yr
For passive investors: Depreciation is non-cash, so a rental often shows a tax loss while cash-flowing — sheltering income. Rental losses are passive: they offset passive income freely, and up to $25,000/yr can offset ordinary (W-2) income if you actively participate and your MAGI is under $100k (phasing out to $0 by $150k); unused losses carry forward. On sale, claimed depreciation is recaptured at up to 25%, and gains may owe capital-gains tax (a 1031 exchange can defer both). Figures are a year-1 estimate at your 24.0% rate — not tax advice; consult a CPA.
Schools (NCES district)
- District
- Pennsbury SD
- NCES district ID
- 4218840
- Math proficiency
- 46% ▼ -13.00%
- Reading proficiency
- 69% ▼ -8.00%
- Median HH income
- $85,495
- Composite
- 52.3/100
- National rank
- #1594
- State rank
- #67 of 539 in PA
Livability — Falls
No livability data for this city. (Only ~50 U.S. cities are tracked.)
Census & demographics
- County
- Bucks County · 506,477 people
- Metro
- Philadelphia-Camden-Wilmington, PA-NJ-DE-MD
- Population (ZIP)
- 53,885
- Household income
- $133,630
- Rent vs Own
- Severe rent burden
- 1036.0
Population outlook (Bucks County) Hauer SSP2
- Today (2025)
- 630,973 people
- By 2030
- 627,093 · -0.6%
- By 2040
- 609,680 · -3.4%
- By 2050
- 584,225 · -7.4%
- By 2075
- 539,840 · -14.4%
- By 2100
- 483,970 · -23.3%
Race, ethnicity, and origin ACS 2023
- Neighborhood character
- Predominantly White (80%)
- Race & ethnicity
- White 80% Hispanic / Latino 7% Asian 6% Two or more races 5% Black 4%
- Hispanic origin (detail)
- Mexican 2% Puerto Rican 1% Dominican 1%
- Common ancestry
- Romanian 10% Scotch-Irish 2% Italian 2%
- Foreign-born
- 11% · Canada, China, Jamaica
- Languages at home
- 88% English-only · Spanish 5% Other Indo-European 3% Russian/Polish/Slavic 2%
Political lean MEDSL · Bucks
- 2024 margin
- Toss-up / Even · D 49.5% · R 49.5%
- 2008→2024 swing
- -8.7pp toward R · 2008: 8.7pp · 2024: -0.1pp
- All cycles
- 2024: R+0.1 2020: D+4.4 2016: D+0.6 2012: D+1.2 2008: D+8.7
Not yet ingested
- Civics
- —
Market trends
- HPI YoY
- ▼ -435.62%
- Current HPI
- 281.8167
- Rent YoY
- ▲ 3.12%
- Metro
- Philadelphia-Camden-Wilmington, PA-NJ-DE-MD
- State GDP YoY
- ▲ 1.68%
- F500 in state
- 34
Industry mix (Fortune 500 HQ in PA)
| Industry | F500 HQs | Revenue |
|---|---|---|
| Healthcare | 2 | $309B |
|
||
| Insurance | 2 | $27B |
|
||
| Telecommunications / Media | 1 | $124B |
|
||
| Industrial Distribution | 1 | $22B |
|
||
| Financial Services | 1 | $20B |
|
||
| Chemicals / Materials | 1 | $18B |
|
||
Price history
+1159.0% since first listed4 events — show timeline
- 2025-12-08 Price Changed $175,000 BRIGHT MLS
- 2025-05-07 Listed $181,900 BRIGHT MLS
- 2000-07-31 Listing Removed — BRIGHT MLS
- 1999-07-24 Listed $13,900 BRIGHT MLS
Cash-flow waterfall
monthlySold comps — $/sqft
last 12 mo · ≤1 miLoading sold comps…