1515 Barkwood Ln · Alafaya, FL
Flood risk 1/10 · Minimal
- FEMA flood zone
- X (unshaded)
- Chance of flooding over 30 yrs
- 0.0%
- Est. flood insurance / yr
- $507 – $1,088
Fire risk 4/10 · Minor
- Est. fire insurance / yr
- $947 – $1,759
Heat risk 9/10 · Severe
- Hot days now (above 108°F)
- 7 days/yr
- Hot days in 30 yrs
- 23 days/yr
Wind risk 9/10 · Severe
- Chance of severe wind over 30 yrs
- 99.0%
Air-quality risk 2/10 · Minimal
- Unhealthy air days now
- 2 days/yr
- Unhealthy air days in 30 yrs
- 2 days/yr
Risk factors via First Street. Map © Google.
Why this score? — see what drove the B+ grade
The composite is a weighted blend of 9 inputs, each scored 0–100. Each bar is that input's sub-score; the figure is the points it added to the 100-point composite (weight × sub-score).
- Cash flow +30.0/30.0
- 1% rule +10.0/10.0
- DSCR +10.0/10.0
- ARV discount +7.5/15.0
- Appreciation +4.8/10.0
- Schools +4.1/10.0
- Livability +4.1/5.0
- Condition / age +3.8/5.0
- Rent growth +2.7/5.0
$99,000
🖨 Deal sheet 📄 Offer letter ✓ Due diligence
Listing remarks
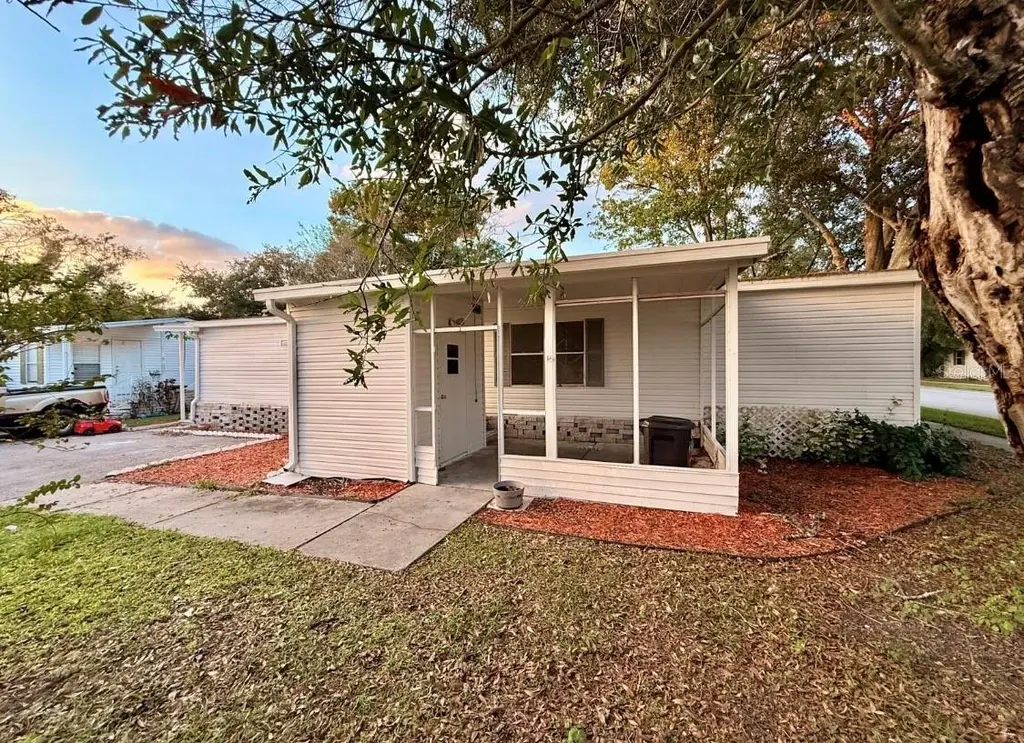
Recently updated and move-in ready 1,700sq ft mobile home near UCF. Spacious layout with 2 parking spaces, private outdoor area, and extra storage space. Enjoy community amenities including 2 pools and 2 clubhouses, conveniently located near shopping, dining, and major roadways. Great opportunity for affordable living or investment potential.
Key facts
- Move-in ready
- Extra storage space
- 2 clubhouses
Tags
Property features AI
Finance
- Other: Unfurnished; Directions: GPS
- Financial info: Land lease: $820
- HOA & community: Buyer approval required for the community; Community clubhouse; On-site fitness center; Community park; Playground; Community pool; Sidewalks
Exterior
- Parking: Carport with 2 spaces
- Utilities: Public water; Public sewer; Electricity connected; Water connected
- Home design: Manufactured double-wide home; Single-story; Faces east
- Construction: Vinyl siding; Shingle roof; Crawlspace foundation
- Exterior features: Sidewalk
Interior
- Kitchen: Dishwasher; Microwave; Range; Refrigerator
- Bedrooms: 3 bedrooms
- Flooring: Laminate; Tile
- Bathrooms: 2 full bathrooms
- Heating & cooling: Central heating (electric); Central air conditioning
- Interior features: Ceiling fans
- Laundry & utility: Washer hookup; Dryer hookup; Dedicated laundry room
Neighborhood map
What this means for you Summary
Snapshot
- This is a 3-bed/2.0-bath manufactured listed at $99k. Condition is rated good.
Deal economics
- At list price, monthly cash flow is $1k ($15k/yr) — positive.
- The deal already cash-flows at list — no discount required.
- Meets the 1% rule at list price ($2k rent vs $99k).
- Recommended offer: $96k (3.0% below list) — sets the bar for market timing.
- Cap rate 21.5% vs local median 3.5% in Alafaya — top-decile yield for the area; either an underpriced asset or a hidden risk that comps aren't pricing in. Stress-test before assuming the spread holds.
Location & tenants
- Location reads 82/100 on livability (#60 in FL, #1,076 nationally) — a professional / high-income tenant draw. Strengths: housing A+, health & safety A+, crime A; Watch: cost of living C-, schools D+.
- Orange (suburban): math 46% / reading 51% proficiency, ranked #43 of 73 in FL (top 59%) — families likely to look elsewhere, expect single-tenant / working-renter base with shorter leases.
- Market conditions: Rents flat; 320 active listings in the ZIP; 16 comparable units currently listed for rent nearby; rentals leasing fast (median 8d on market — plan ~1-2 weeks tenant-placement turnaround); solid renter incomes; 8,053 units permitted in Orange County in 2024 (3,133 in 5+ unit buildings).
Forward outlook
- In year one you build about $321 of equity ($684 loan paydown + $-363 appreciation (-0.4% local appreciation)).
- Orange County population projected at +52% by 2050 — long-run rental-demand tailwind backs the buy-and-hold thesis.
- At projected returns (-0.4% appreciation + 0.8% rent growth), your $28k cash investment doubles in ~2 years — after that, you're playing with house money.
Negotiation context
- It's been on market 36 days — a 3% lower offer ($96k) is reasonable based on typical stale-listing flexibility.
Risks & watch-outs
- Climate carrying-cost: severe wind risk, 99% chance of damaging wind over 30y; extreme-heat days projected 7→23/yr by 2055 (HVAC capex compounding) — expect insurance premiums to compound above CPI over the hold.
Questions for the listing agent
- It's been on market 36 days. Have you received any prior offers? Is the seller open to a 3% concession, seller financing, or rate buy-down credit?
- Is there a deadline driving the sale (1031 exchange, divorce, estate, relocation)? That informs how much negotiation room exists.
- Schools are D-rated, which usually means shorter tenancies and higher turnover. Who's the typical renter profile here, and what's been the actual vacancy rate?
- What's the average days-on-market for RENTAL listings here right now (not sales)? A rising rental-DOM trend means longer vacancies and softer asking-rent achievability than the comps imply.
- What's the recent tenant-quality profile in this submarket — average credit score on applications, eviction rate, late-payment / NSF rate, and stable-employment percentage? A property-management company in the area should have these aggregated.
- How much new for-sale + rental construction is in the pipeline within 1–3 miles? Heavy new supply typically softens prices + rents 12–24 months out; constrained supply supports both.
Investment metrics
- 1% rule
- 2.48% ✓
- Cap rate
- 21.49%
- Cash-on-cash
- 54.26%
- DSCR
- 3.41
- GRM
- 3.4
CMA / ARV
No comps found within radius.
Projected returns pro-forma
-0.37% appreciation · 0.82% rent growth · sell at horizon
- IRR
- 53.2%
- Equity multiple
- 3.53×
- Total profit
- $70,011
- Equity at exit
- $26,943
- IRR
- 55.1%
- Equity multiple
- 6.57×
- Total profit
- $154,333
- Equity at exit
- $30,981
Cash invested: $27,720 (down + closing). Projections, not guarantees.
Landlord ↔ Tenant lean methodology
- Overall (STATE)
- 87 Strongly Landlord-Friendly
- State Florida
- 87 Strongly Landlord-Friendly · R+3
- County
- — inherits STATE
- City
- — inherits STATE
ZIP-level market 32828
- Home prices YoY
- -0.1%
- Rents YoY
- 0.8%
- Active inventory
- 320
- Price-to-rent
- 3.4×
Monthly cashflow live
- Estimated rent
- $2,453 high interval (Pro) →
- Mortgage (P&I)
- −$519
- Tax est. 1.5%
- −$124 /mo · $1,485/yr
- Insurance
- −$41
- HOA
- −$0
- Vacancy / Maint / Mgmt
- −$515
- Net cashflow
- $1,253
Break-even live
UW: 25.0% down · 7.5% · 30yr · 1.5% tax · 5.0% vac · 8.0% maint · 8.0% mgmt
Financing live
Cash to close
- Down payment
- $24,750
- Closing costs
- $2,970
- Reserves months
- —
- Total cash needed
- —
Loan-product check · same deal, 3 products live
Conventional
25% down · 7.5% · 30yr
- Down + closing
- —
- Monthly P&I
- —
- Monthly cashflow
- —
- DSCR
- —
- Eligible?
- —
Personal DTI + credit; lowest rate.
DSCR
20% down · 8.5% · 30yr
- Down + closing
- —
- Monthly P&I
- —
- Monthly cashflow
- —
- DSCR
- —
- Eligible?
- —
No personal income docs; deal must DSCR.
Hard money
10% down · 12.0% · 12mo
- Down + closing
- —
- Monthly P&I
- —
- Monthly cashflow
- —
- DSCR
- —
- Eligible?
- —
Short-term bridge; refi at stabilization.
Rent comps 16 comps
| Address | Beds | Baths | Sqft | Rent | $/sqft | DOM | Units | Dist |
|---|---|---|---|---|---|---|---|---|
| 1911 Colonial Woods Blvd Orlando, FL | 3.0 | 2.0 | 1480 | $2,100 | $1.42 | 23d | 1 | 0.31mi |
| 525 Loyola Cir Orlando, FL | 1.0–3.0 | 1.0–3.0 | 1400 | $2,973 | $2.12 | 1d | 43 | 0.40mi |
| 1705 Circe Lake Ct Orlando, FL | 3.0 | 2.0 | 1215 | $2,100 | $1.73 | 23d | 1 | 0.77mi |
| 14630 Lady Victoria Blvd Orlando, FL | 4.0 | 2.0 | 1988 | $2,695 | $1.36 | 1d | 1 | 0.80mi |
| 13645 E Colonial Dr Orlando, FL | 2.0 | 1.0–2.0 | 857 | $2,235 | $2.61 | 2d | 10 | 0.88mi |
| 12949 Odyssey Lake Way Orlando, FL | 3.0 | 2.0 | 1303 | $2,100 | $1.61 | 7d | 1 | 0.89mi |
| 12912 Odyssey Lake Way Orlando, FL | 4.0 | 2.0 | 1392 | $2,399 | $1.72 | 4d | 1 | 0.95mi |
| 13087 Odyssey Lake Way Orlando, FL | 3.0 | 2.0 | 1148 | $2,350 | $2.05 | 23d | 1 | 0.97mi |
| 500 Lakescape Ct Orlando, FL | 3.0 | 2.0 | 1664 | $2,400 | $1.44 | 20d | 1 | 1.08mi |
| 15634 Perdido Dr Orlando, FL | 3.0 | 2.0 | 1692 | $2,450 | $1.45 | 17d | 1 | 1.08mi |
| 12000 Bryonia Rd Alafaya, FL | 1.0–3.0 | 1.0–2.0 | 979 | $2,570 | $2.62 | 1d | 14 | 1.35mi |
| 2645 Talladega Dr Orlando, FL | 3.0 | 2.0 | 1236 | $2,281 | $1.85 | 14d | 1 | 1.35mi |
| 1700 Woodbury Rd Orlando, FL | 1.0–3.0 | 1.0–2.0 | 999 | $2,009 | $2.01 | 3d | 7 | 1.42mi |
| 2219 Justin Ave Orlando, FL | 3.0 | 2.0 | 1200 | $2,100 | $1.75 | 17d | 1 | 1.44mi |
| 14050 Ithaca Way Orlando, FL | 3.0 | 2.0 | 1228 | $2,115 | $1.72 | 7d | 1 | 1.47mi |
| 1301 Waterford Oak Dr Orlando, FL | 1.0–2.0 | 1.0–2.0 | 948 | $2,069 | $2.18 | 1d | 14 | 1.50mi |
Listing history 15 events
-
2026-06-18days on market $99,000 Active 36 DOM
-
2026-06-17days on market $99,000 Active 35 DOM
-
2026-06-16days on market $99,000 Active 34 DOM
-
2026-06-15days on market $99,000 Active 33 DOM
-
2026-06-13days on market $99,000 Active 31 DOM
-
2026-06-13days on market $99,000 Active 30 DOM
-
2026-06-09days on market $99,000 Active 27 DOM
-
2026-06-08days on market $99,000 Active 26 DOM
-
2026-06-07days on market $99,000 Active 25 DOM
-
2026-06-04days on market $99,000 Active 22 DOM
-
2026-06-03days on market $99,000 Active 21 DOM
-
2026-06-02days on market $99,000 Active 20 DOM
-
2026-06-01days on market $99,000 Active 19 DOM
-
2026-05-31days on market $99,000 Active 18 DOM
-
2026-05-13$99,000 Active
ⓘ Source: listings_history table (triggers on properties + properties_extension) + one-shot
backfill from property_details.listing_events for pre-trigger history.
Climate risk First Street
- Flood 1/10 Low FEMA zone X (unshaded) · 0% chance over 30 yrs
- Wildfire 4/10 Moderate
- Heat 9/10 Extreme 7 d/yr ≥108°F today · 23 d/yr by 30 yrs out
- Wind 9/10 Extreme 99% chance of damaging wind over 30 yrs
- Air quality 2/10 Low 2 unhealthy d/yr today · 2 by 30 yrs out
Nearby sold comps map
Loading sold comps map…
Walkable amenities ~0.75 mi
Loading nearby amenities…
Taxation est. · year 1
- Rental income
- $29,432
- − Mortgage interest
- −$5,546
- − Property taxes
- −$1,485
- − Insurance
- −$495
- − Repairs & maintenance
- −$2,355
- − Management
- −$2,355
- − Depreciation
- −$2,880
- Taxable income
- $14,317
- Est. tax owed @ 24.0%
- −$3,436
- After-tax cash flow
- $11,605/yr
For passive investors: Depreciation is non-cash, so a rental often shows a tax loss while cash-flowing — sheltering income. Rental losses are passive: they offset passive income freely, and up to $25,000/yr can offset ordinary (W-2) income if you actively participate and your MAGI is under $100k (phasing out to $0 by $150k); unused losses carry forward. On sale, claimed depreciation is recaptured at up to 25%, and gains may owe capital-gains tax (a 1031 exchange can defer both). Figures are a year-1 estimate at your 24.0% rate — not tax advice; consult a CPA.
Condition & rehab AI · 8 photos
This recently updated mobile home is move-in ready with a good condition score and a good rehab level. It has a good kitchen, bathrooms, and flooring, but could benefit from landscaping and curb appeal improvements to increase its value.
Value-add opportunities
- Both Landscaping and curb appeal improvements — Enhances the home's curb appeal and can attract more buyers or renters.
- Both Painting exterior and interior walls — Fresh paint can make the home look more inviting and can increase its value.
- Both Upgrading the HVAC system — A new HVAC system can improve comfort and energy efficiency, attracting more buyers or renters.
- Both Adding curb appeal features — Features like a front porch, landscaping, and a well-maintained exterior can increase the home's value and attract more buyers or renters.
Renovation cost estimate screening
Value-add ROI direction
- Both Landscaping and curb appeal improvements — Enhances the home's curb appeal and can attract more buyers or renters. ↑
- Both Painting exterior and interior walls — Fresh paint can make the home look more inviting and can increase its value. ↑
- Both Upgrading the HVAC system — A new HVAC system can improve comfort and energy efficiency, attracting more buyers or renters. ↑
- Both Adding curb appeal features — Features like a front porch, landscaping, and a well-maintained exterior can increase the home's value and attract more buyers or renters. ↑
ⓘ Cost ranges are severity-bucket heuristics (US national rule-of-thumb). Get contractor quotes + a written scope before underwriting a rehab budget.
Schools (NCES district)
- District
- Orange
- NCES district ID
- 1201440
- Math proficiency
- 46% ▼ -9.00%
- Reading proficiency
- 51% ▼ -2.00%
- Median HH income
- $49,350
- Composite
- 41.47/100
- National rank
- #3461
- State rank
- #43 of 73 in FL
Livability — Alafaya
- Score
- 82/100
- State rank
- #60
- US rank
- #1076
Category grades
Schools grade is shown separately in the Schools card above.
Census & demographics
- Census place
- Alafaya, FL
- County
- Orange County · 1,471,359 people
- City population
- 131,972
- Metro
- Orlando-Kissimmee-Sanford, FL
- Population (ZIP)
- 69,202
- Household income
- $101,767
- Rent vs Own
- Severe rent burden
- 2213.0
Population outlook (Orange County) Hauer SSP2
- Today (2025)
- 1,618,226 people
- By 2030
- 1,787,404 · +10.5%
- By 2040
- 2,125,621 · +31.4%
- By 2050
- 2,454,016 · +51.6%
- By 2075
- 3,173,711 · +96.1%
- By 2100
- 3,607,781 · +122.9%
Race, ethnicity, and origin ACS 2023
- Neighborhood character
- Diverse neighborhood (Simpson 0.67)
- Race & ethnicity
- White 42% Hispanic / Latino 37% Two or more races 23% Black 9% Asian 7%
- Hispanic origin (detail)
- Mexican 1% Puerto Rican 19% Cuban 4% Dominican 3%
- Common ancestry
- Slovak 2% Romanian 1% Lithuanian 1%
- Foreign-born
- 20% · Canada, Jamaica, Vietnam
- Languages at home
- 63% English-only · Spanish 27% Other Indo-European 3% Arabic 1%
Political lean MEDSL · Orange
- 2024 margin
- D (+13.6) · D 56.1% · R 42.5% · Other 1.3%
- 2008→2024 swing
- -5.0pp toward R · 2008: 18.6pp · 2024: 13.6pp
- All cycles
- 2024: D+13.6 2020: D+23.1 2016: D+24.6 2012: D+18.2 2008: D+18.6
Not yet ingested
- Civics
- —
Market trends
- HPI YoY
- ▼ -0.37%
- Current HPI
- 284.5182
- Rent YoY
- ▲ 0.82%
- Metro
- Orlando-Kissimmee-Sanford, FL
- State GDP YoY
- ▲ 3.28%
- F500 in state
- 36
Industry mix (Fortune 500 HQ in FL)
| Industry | F500 HQs | Revenue |
|---|---|---|
| Industrial Technology | 2 | $29B |
|
||
| Insurance | 2 | $17B |
|
||
| Retail | 1 | $60B |
|
||
| Technology Distribution | 1 | $58B |
|
||
| Homebuilding | 1 | $35B |
|
||
| Technology Manufacturing | 1 | $35B |
|
||
Price history
1 event — show timeline
- 2026-05-13 Listed $99,000 Stellar MLS as Distributed by MLS Grid
Cash-flow waterfall
monthlySold comps — $/sqft
last 12 mo · ≤1 miLoading sold comps…