643 Crows Nest Ct #201 · Virginia Beach, VA
Flood risk 5/10 · Moderate
- FEMA flood zone
- X (unshaded)
- Chance of flooding over 30 yrs
- 0.67%
- Est. flood insurance / yr
- $507 – $1,088
Fire risk 1/10 · Minimal
- Est. fire insurance / yr
- $666 – $1,236
Heat risk 9/10 · Severe
- Hot days now (above 105°F)
- 7 days/yr
- Hot days in 30 yrs
- 16 days/yr
Wind risk 8/10 · Major
- Chance of severe wind over 30 yrs
- 94.0%
Air-quality risk 3/10 · Minor
- Unhealthy air days now
- 2 days/yr
- Unhealthy air days in 30 yrs
- 3 days/yr
Risk factors via First Street. Map © Google.
Why this score? — see what drove the C grade
The composite is a weighted blend of 9 inputs, each scored 0–100. Each bar is that input's sub-score; the figure is the points it added to the 100-point composite (weight × sub-score).
- Cash flow +18.0/30.0
- 1% rule +9.3/10.0
- ARV discount +7.5/15.0
- Schools +6.4/10.0
- DSCR +5.6/10.0
- Livability +4.2/5.0
- Condition / age +4.0/5.0
- Rent growth +3.9/5.0
- Appreciation +0.0/10.0
$121,500
🖨 Deal sheet 📄 Offer letter ✓ Due diligence
Key facts
- $430 HOA
- Built 1985
- Listed 49 days
Property features AI
Finance
- HOA & community: HOA (Newpointe Condo) managed by Select Group; Monthly condo fee of $430
Exterior
- Parking: Assigned/reserved parking
- Utilities: City/County water; City/County sewer; Electric water heater
- Home design: Attached condo (Lo Rise); Single-story layout; Entry on condominium level 2
- Construction: Slab foundation
- Exterior features: Vinyl siding; Composite roof
Interior
- Bedrooms: Condo unit on level 2
- Flooring: Vinyl flooring
- Bathrooms: 2 full bathrooms
- Heating & cooling: Forced hot air heating; Central air conditioning
- Interior features: One fireplace; Vinyl flooring
Neighborhood map
What this means for you Summary
Snapshot
- This is a 2-bed/2.0-bath condo listed at $122k. Condition is rated good.
Deal economics
- At list price, monthly cash flow is $104 ($1k/yr) — positive.
- The deal already cash-flows at list — no discount required.
- Meets the 1% rule at list price ($2k rent vs $122k).
- Recommended offer: $118k (3.0% below list) — sets the bar for market timing.
- Cap rate 7.3% vs local median 3.5% in Virginia Beach — top-decile yield for the area; either an underpriced asset or a hidden risk that comps aren't pricing in. Stress-test before assuming the spread holds.
Location & tenants
- Location reads 83/100 on livability (#38 in VA, #880 nationally) — a professional / high-income tenant draw. Strengths: amenities A+, employment A+, housing A+; Watch: cost of living C-, commute F.
- Va Beach City Public School District (urban): math 69% / reading 78% proficiency, ranked #10 of 131 in VA (top 8%) — strong family-tenant draw, lease renewals of 3-5y typical.
- Zoned schools: Bayside Elementary (math 52% / reading 57%, grade C, #650 of 1,108 statewide, top 62%, 480 students, 74% FRL); Bayside High (math 63% / reading 75%, grade B, #170 of 319 statewide, top 55%, 1,983 students, 65% FRL) — zoned schools average 69% FRL vs 28% district-wide (41 pts higher); higher-poverty schools than district average — tighter screening recommended.
- Market conditions: Rents rising fast (+5.6%/yr); 220 active listings in the ZIP; 24 comparable units currently listed for rent nearby; rentals at typical pace (median 16d on market — plan ~3-4 weeks tenant-placement turnaround); 666 units permitted in Virginia Beach city in 2024 (347 in 5+ unit buildings).
- This rent runs 30% of the median local income ($69k/yr) — at the standard rent-burdened threshold; future hikes will face affordability resistance.
Forward outlook
- Local home prices are declining (-3.0%/yr); year-one equity from $840 of loan paydown is wiped out by about $4k of value loss. Plan a longer hold.
- Virginia Beach County population projected at +6% by 2050 — modest demand growth; plan on rents tracking national, not racing it.
Negotiation context
- It's been on market 49 days — a 3% lower offer ($118k) is reasonable based on typical stale-listing flexibility.
Risks & watch-outs
- Watch-outs: HOA is 25% of rent.
- Climate carrying-cost: moderate flood risk; severe wind risk, 94% chance of damaging wind over 30y; extreme-heat days projected 7→16/yr by 2055 (HVAC capex compounding) — expect insurance premiums to compound above CPI over the hold.
Questions for the listing agent
- It's been on market 49 days. Have you received any prior offers? Is the seller open to a 3% concession, seller financing, or rate buy-down credit?
- What does the HOA fee cover, when was the last increase, and are there any pending special assessments or reserve-fund shortfalls?
- Any open or pending special assessments — roof, HVAC, plumbing, elevator, façade? What's the per-unit balance and payoff schedule, and is the seller paying it off at close or rolling it to the buyer?
- Is there a deadline driving the sale (1031 exchange, divorce, estate, relocation)? That informs how much negotiation room exists.
- Schools are A-rated — typically a magnet for longer-tenancy family renters. What's the average tenant stay here, and is there a school-zone premium baked into asking?
- What's the average days-on-market for RENTAL listings here right now (not sales)? A rising rental-DOM trend means longer vacancies and softer asking-rent achievability than the comps imply.
- What's the recent tenant-quality profile in this submarket — average credit score on applications, eviction rate, late-payment / NSF rate, and stable-employment percentage? A property-management company in the area should have these aggregated.
- How much new apartment / multifamily construction is in the pipeline within 1–3 miles? Heavy new supply (>2% of stock underway) typically softens rents 12–24 months out; light construction supports rent growth.
Investment metrics
- 1% rule
- 1.43% ✓
- Cap rate
- 7.32%
- Cash-on-cash
- 3.67%
- DSCR
- 1.16
- GRM
- 5.8
CMA / ARV
No comps found within radius.
Projected returns pro-forma
-3.0% appreciation · 5.61% rent growth · sell at horizon
- IRR
- -6.2%
- Equity multiple
- 0.76×
- Total profit
- $-8,078
- Equity at exit
- $18,116
- IRR
- 7.6%
- Equity multiple
- 1.68×
- Total profit
- $22,975
- Equity at exit
- $10,505
Cash invested: $34,020 (down + closing). Projections, not guarantees.
Landlord ↔ Tenant lean methodology
- Overall (STATE)
- 55 Moderately Landlord-Leaning
- State Virginia
- 55 Moderately Landlord-Leaning · D+2
- County
- — inherits STATE
- City
- — inherits STATE
ZIP-level market 23462
- Rents YoY
- 5.6%
- Active inventory
- 220
- Price-to-rent
- 5.8×
Monthly cashflow live
- Estimated rent
- $1,739 high interval (Pro) →
- Mortgage (P&I)
- −$637
- Tax est. 1.5%
- −$152 /mo · $1,822/yr
- Insurance
- −$51
- HOA
- −$430
- Vacancy / Maint / Mgmt
- −$365
- Net cashflow
- $104
Break-even live
UW: 25.0% down · 7.5% · 30yr · 1.5% tax · 5.0% vac · 8.0% maint · 8.0% mgmt
Financing live
Cash to close
- Down payment
- $30,375
- Closing costs
- $3,645
- Reserves months
- —
- Total cash needed
- —
Loan-product check · same deal, 3 products live
Conventional
25% down · 7.5% · 30yr
- Down + closing
- —
- Monthly P&I
- —
- Monthly cashflow
- —
- DSCR
- —
- Eligible?
- —
Personal DTI + credit; lowest rate.
DSCR
20% down · 8.5% · 30yr
- Down + closing
- —
- Monthly P&I
- —
- Monthly cashflow
- —
- DSCR
- —
- Eligible?
- —
No personal income docs; deal must DSCR.
Hard money
10% down · 12.0% · 12mo
- Down + closing
- —
- Monthly P&I
- —
- Monthly cashflow
- —
- DSCR
- —
- Eligible?
- —
Short-term bridge; refi at stabilization.
Rent comps 24 comps
| Address | Beds | Baths | Sqft | Rent | $/sqft | DOM | Units | Dist |
|---|---|---|---|---|---|---|---|---|
| 607 Crows Nest Ct Virginia Beach, VA | 2.0 | 1.0 | 700 | $1,700 | $2.43 | 23d | 1 | 0.05mi |
| 608 Spirit Ct Virginia Beach, VA | 2.0 | 1.0 | 866 | $1,875 | $2.17 | 7d | 1 | 0.10mi |
| 502 Wharf Ct Virginia Beach, VA | 2.0 | 1.0 | 866 | $1,495 | $1.73 | 10d | 1 | 0.15mi |
| 5516 Seawall Ct Virginia Beach, VA | 2.0–3.0 | 1.0–3.0 | 1125 | $1,536 | $1.36 | 1d | 18 | 0.17mi |
| 5619 Summit Arch Virginia Beach, VA | 2.0 | 2.0 | 957 | $1,650 | $1.72 | 3d | 1 | 0.18mi |
| 5547 Lynbrook Lndg Virginia Beach, VA | 3.0 | 1.0 | 820 | $1,350 | $1.65 | 17d | 1 | 0.54mi |
| 453 Peregrine St Virginia Beach, VA | 2.0 | 1.0 | 994 | $1,500 | $1.51 | 23d | 1 | 0.65mi |
| 5414 Catina Arch Virginia Beach, VA | 1.0–4.0 | 1.0–1.5 | 866 | $1,717 | $1.98 | 2d | 10 | 0.77mi |
| 5781 Lake Edward Dr Virginia Beach, VA | 2.0 | 1.0–1.5 | 1075 | $1,478 | $1.37 | 2d | 15 | 0.78mi |
| 512 Featherstone Ct Unit 520102-F Virginia Beach, VA | 1.0 | 1.0 | 897 | $799 | $0.89 | 4d | 1 | 0.79mi |
| 512 Featherstone Ct Unit 501-201D Virginia Beach, VA | 2.0 | 1.0 | 897 | $1,549 | $1.73 | 23d | 1 | 0.79mi |
| 512 Featherstone Ct Unit 573F Virginia Beach, VA | 3.0 | 1.0 | 1047 | $1,675 | $1.60 | 23d | 1 | 0.79mi |
| 5161 Weaver Dr Virginia Beach, VA | 2.0–3.0 | 1.0 | 971 | $1,549 | $1.60 | 4d | 4 | 0.88mi |
| 5141 Gracewood Ln Unit 203 Virginia Beach, VA | 1.0 | 1.0 | 748 | $1,595 | $2.13 | 20d | 1 | 0.89mi |
| 5433 Campus Dr Virginia Beach, VA | 2.0 | 2.0 | 1000 | $1,700 | $1.70 | 2d | 1 | 0.90mi |
| 5301 Justin Ct Virginia Beach, VA | 1.0–2.0 | 1.0 | 695 | $1,599 | $2.30 | 23d | 12 | 0.90mi |
| 5312 Justin Ct Unit 808-11-202E Virginia Beach, VA | 1.0 | 1.0 | 550 | $1,399 | $2.54 | 23d | 1 | 0.93mi |
| 5312 Justin Ct Unit 800-21-102E Virginia Beach, VA | 2.0 | 1.0 | 800 | $1,599 | $2.00 | 23d | 1 | 0.93mi |
| 5441 Greenwich Rd Virginia Beach, VA | 1.0–2.0 | 1.0–2.0 | 1075 | $3,149 | $2.93 | 1d | 13 | 1.09mi |
| 6163 Kempsville Cir Norfolk, VA | 1.0–3.0 | 1.0–2.0 | 1120 | $2,523 | $2.25 | 1d | 12 | 1.44mi |
| 5528 Carolanne Ter Virginia Beach, VA | 2.0 | 2.0 | 950 | $1,725 | $1.82 | 1d | 1 | 1.44mi |
| 1060 Kempsville Rd Norfolk, VA | 1.0 | 1.0 | 723 | $1,775 | $2.46 | 20d | 1 | 1.49mi |
| 1060 Kempsville Rd Norfolk, VA | 1.0 | 1.0 | 914 | $2,250 | $2.46 | 16d | 1 | 1.49mi |
| 1060 Kempsville Rd Norfolk, VA | 2.0 | 2.0 | 1070 | $2,400 | $2.24 | 44d | 1 | 1.49mi |
HOA detail condo
- Monthly dues
- $430 · $5,160/yr
- Assessments
- None detected in remarks — confirm with the listing agent.
Listing history 4 events
-
2026-06-02status $121,500 Under Contract 49 DOM
-
2026-06-01days on market $121,500 Active 49 DOM
-
2026-05-31days on market $121,500 Active 48 DOM
-
2026-04-12$121,500 Active
ⓘ Source: listings_history table (triggers on properties + properties_extension) + one-shot
backfill from property_details.listing_events for pre-trigger history.
Climate risk First Street
- Flood 5/10 Major FEMA zone X (unshaded) · 67% chance over 30 yrs
- Wildfire 1/10 Low
- Heat 9/10 Extreme 7 d/yr ≥105°F today · 16 d/yr by 30 yrs out
- Wind 8/10 Severe 94% chance of damaging wind over 30 yrs
- Air quality 3/10 Moderate 2 unhealthy d/yr today · 3 by 30 yrs out
Nearby sold comps map
Loading sold comps map…
Walkable amenities ~0.75 mi
Loading nearby amenities…
Taxation est. · year 1
- Rental income
- $20,868
- − Mortgage interest
- −$6,806
- − Property taxes
- −$1,822
- − Insurance
- −$608
- − Repairs & maintenance
- −$1,669
- − Management
- −$1,669
- − HOA
- −$5,160
- − Depreciation
- −$3,535
- Taxable loss
- −$401
- Est. tax savings @ 24.0%
- +$96
- After-tax cash flow
- $1,346/yr
For passive investors: Depreciation is non-cash, so a rental often shows a tax loss while cash-flowing — sheltering income. Rental losses are passive: they offset passive income freely, and up to $25,000/yr can offset ordinary (W-2) income if you actively participate and your MAGI is under $100k (phasing out to $0 by $150k); unused losses carry forward. On sale, claimed depreciation is recaptured at up to 25%, and gains may owe capital-gains tax (a 1031 exchange can defer both). Figures are a year-1 estimate at your 24.0% rate — not tax advice; consult a CPA.
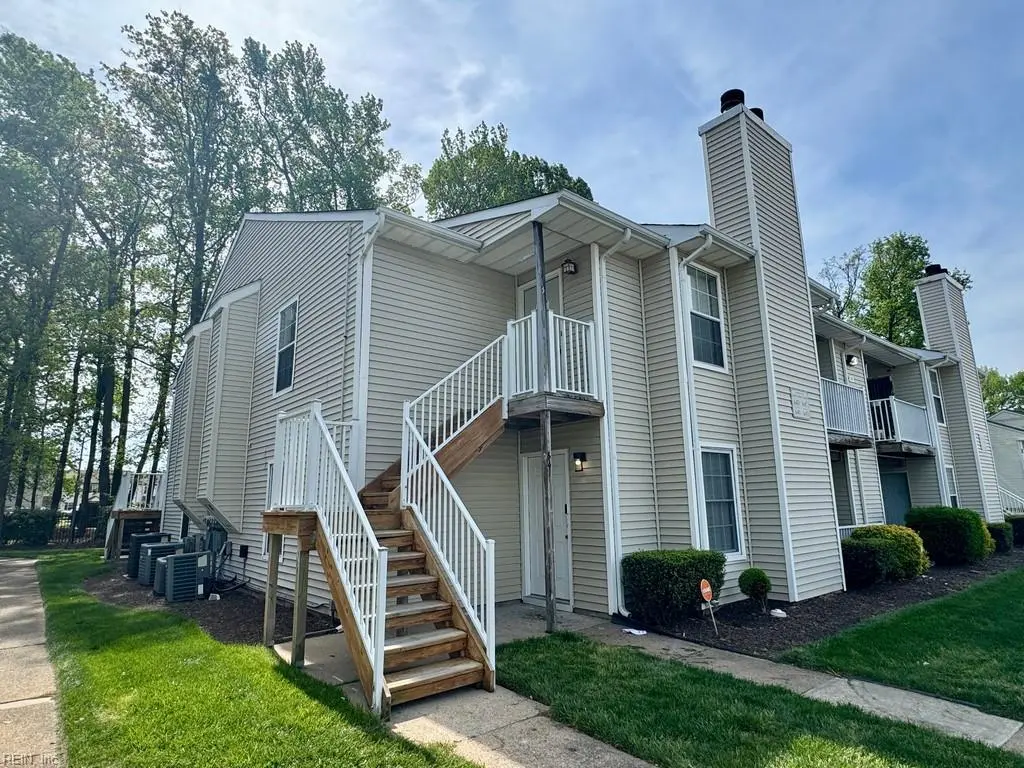
Condition & rehab AI · 1 photo
This well-maintained condo is in good condition with minor cosmetic updates needed to enhance its curb appeal and value.
Value-add opportunities
- Both Paint exterior trim — Enhances curb appeal and can increase both resale and rental value.
- Both Clean and maintain gutters — Keeps the property looking well-maintained and can prevent water damage to the siding and foundation.
Renovation cost estimate screening
Value-add ROI direction
- Both Paint exterior trim — Enhances curb appeal and can increase both resale and rental value. ↑
- Both Clean and maintain gutters — Keeps the property looking well-maintained and can prevent water damage to the siding and foundation. ↑
ⓘ Cost ranges are severity-bucket heuristics (US national rule-of-thumb). Get contractor quotes + a written scope before underwriting a rehab budget.
Schools (NCES district)
- District
- Va Beach City Public School District
- NCES district ID
- 5103840
- Math proficiency
- 69% ▼ -19.00%
- Reading proficiency
- 78% ▼ -7.00%
- Median HH income
- $66,452
- Composite
- 63.81/100
- National rank
- #594
- State rank
- #10 of 131 in VA
Livability — Virginia Beach
- Score
- 83/100
- State rank
- #38
- US rank
- #880
Category grades
Schools grade is shown separately in the Schools card above.
Census & demographics
- Census place
- Virginia Beach, VA
- County
- Virginia Beach City · 448,227 people
- City population
- 448,227
- Metro
- Virginia Beach-Norfolk-Newport News, VA-NC
- Population (ZIP)
- 66,151
- Household income
- $69,040
- Rent vs Own
- Severe rent burden
- 3906.0
Population outlook (Virginia Beach County) Hauer SSP2
- Today (2025)
- 480,401 people
- By 2030
- 491,221 · +2.3%
- By 2040
- 504,882 · +5.1%
- By 2050
- 508,847 · +5.9%
- By 2075
- 504,831 · +5.1%
- By 2100
- 465,867 · -3.0%
Race, ethnicity, and origin ACS 2023
- Neighborhood character
- Diverse neighborhood (Simpson 0.68)
- Race & ethnicity
- White 45% Black 32% Hispanic / Latino 12% Two or more races 10% Asian 5%
- Hispanic origin (detail)
- Mexican 4% Puerto Rican 3%
- Common ancestry
- Romanian 2% Italian 1% Slovak 1%
- Foreign-born
- 9% · Canada, China, Vietnam
- Languages at home
- 87% English-only · Spanish 6% Tagalog/Filipino 2% Other Asian/Pacific 1%
Political lean MEDSL · Virginia Beach
- 2024 margin
- Toss-up / Even · D 50.7% · R 48.0% · Other 1.3%
- 2008→2024 swing
- +3.4pp toward D · 2008: -0.7pp · 2024: 2.6pp
- All cycles
- 2024: D+2.6 2020: D+5.4 2016: R+4.5 2012: R+2.5 2008: R+0.7
Not yet ingested
- Civics
- —
Market trends
- HPI YoY
- ▼ -269.19%
- Current HPI
- 333.1908
- Rent YoY
- ▲ 5.61%
- Metro
- Virginia Beach-Norfolk-Newport News, VA-NC
- State GDP YoY
- ▲ 2.40%
- F500 in state
- 50
Industry mix (Fortune 500 HQ in VA)
| Industry | F500 HQs | Revenue |
|---|---|---|
| Aerospace / Defense | 4 | $236B |
|
||
| Technology / Defense | 3 | $32B |
|
||
| Financial Services | 2 | $176B |
|
||
| Utilities | 2 | $27B |
|
||
| Insurance | 2 | $25B |
|
||
| Technology | 2 | $15B |
|
||
Price history
1 event — show timeline
- 2026-04-12 Listed $121,500 REINMLS
Cash-flow waterfall
monthlySold comps — $/sqft
last 12 mo · ≤1 miLoading sold comps…