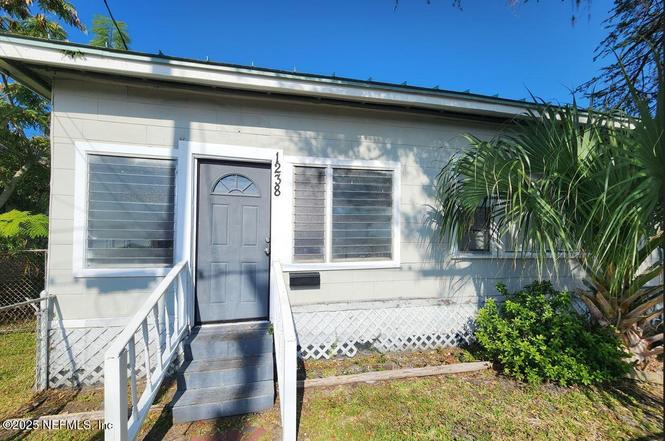
1238 Cleveland St · Jacksonville, FL
Flood risk 4/10 · Minor
- FEMA flood zone
- X (unshaded)
- Chance of flooding over 30 yrs
- 0.22%
- Est. flood insurance / yr
- $507 – $1,088
Fire risk 1/10 · Minimal
- Est. fire insurance / yr
- $947 – $1,759
Heat risk 9/10 · Severe
- Hot days now (above 107°F)
- 7 days/yr
- Hot days in 30 yrs
- 20 days/yr
Wind risk 9/10 · Severe
- Chance of severe wind over 30 yrs
- 99.0%
Air-quality risk 5/10 · Moderate
- Unhealthy air days now
- 7 days/yr
- Unhealthy air days in 30 yrs
- 7 days/yr
Risk factors via First Street. Map © Google.
Why this score? — see what drove the C grade
The composite is a weighted blend of 9 inputs, each scored 0–100. Each bar is that input's sub-score; the figure is the points it added to the 100-point composite (weight × sub-score).
- Cash flow +27.2/30.0
- DSCR +9.5/10.0
- 1% rule +6.7/10.0
- Livability +4.2/5.0
- Schools +3.9/10.0
- Rent growth +3.0/5.0
- Condition / age +2.5/5.0
- ARV discount +0.0/15.0
- Appreciation +0.0/10.0
$133,900
🖨 Deal sheet 📄 Offer letter ✓ Due diligence
Listing remarks
Charming 3 bedroom/2 bath bungalow can be yours before the end of 2025! Freshly painted with new carpet in the bedrooms, and new LVP flooring in the living areas. HVAC and Electric panel are less than 8 years old. Close to downtown, I-95 and multiple healthcare organizations.
Key facts
- New carpet
- New lvp flooring
- Close to downtown
Tags
Property features AI
Exterior
- Parking: Off-street parking
- Utilities: Public sewer; Electricity connected; Sewer connected; Water connected
- Home design: Single family residence; One story
- Construction: Fiber cement construction; Metal roof
- Exterior features: Chain link fencing; City street frontage; Asphalt road surface
Interior
- Kitchen: Electric range; Refrigerator
- Bedrooms: 3 bedrooms
- Flooring: Carpet; Tile; Wood
- Bathrooms: 2 full bathrooms
- Heating & cooling: Central heating (electric); Central air (electric)
- Interior features: Ceiling fan(s)
- Laundry & utility: In-unit laundry; Washer hookup; Electric dryer hookup; Electric water heater
Neighborhood map
What this means for you Summary
Snapshot
- This is a 3-bed/1.0-bath single-family listed at $134k.
Deal economics
- At list price, monthly cash flow is $383 ($5k/yr) — positive.
- The deal already cash-flows at list — no discount required.
- Meets the 1% rule at list price ($2k rent vs $134k).
- Recommended offer: $118k (12.0% below list) — sets the bar for market timing.
- Cap rate 9.7% vs local median 4.0% in Jacksonville — top-decile yield for the area; either an underpriced asset or a hidden risk that comps aren't pricing in. Stress-test before assuming the spread holds.
Location & tenants
- Location reads 83/100 on livability (#50 in FL, #911 nationally) — a professional / high-income tenant draw. Strengths: amenities A+, commute A+, housing A+.
- Duval (urban): math 46% / reading 45% proficiency, ranked #48 of 73 in FL (top 66%) — families likely to look elsewhere, expect single-tenant / working-renter base with shorter leases.
- Market conditions: Rents rising (+1.8%/yr); 394 active listings in the ZIP; 40 comparable units currently listed for rent nearby; rentals at typical pace (median 20d on market — plan ~3-4 weeks tenant-placement turnaround); lower-income renter base — watch delinquency; 6,503 units permitted in Duval County in 2024 (1,131 in 5+ unit buildings).
- At $1,563/mo this rent would consume 61% of the median local household income ($31k/yr) (locally 2921% of renters already pay >50% of income on rent) — very limited rent-growth headroom before tenants either downsize or default.
Forward outlook
- Local home prices are declining (-3.0%/yr); year-one equity from $926 of loan paydown is wiped out by about $4k of value loss. Plan a longer hold.
- Duval County population projected at +19% by 2050 — long-run rental-demand tailwind backs the buy-and-hold thesis.
Negotiation context
- It's been on market 251 days — a 12% lower offer ($118k) is reasonable based on typical stale-listing flexibility.
- 3 sale attempts; this cycle's ask has dropped $16k (11%) from the opening price — seller is motivated, your offer sets the floor, not the list.
Risks & watch-outs
- Watch-outs: built in 1916 — expect roof / HVAC / electrical / plumbing capex.
- Climate carrying-cost: severe wind risk, 99% chance of damaging wind over 30y; extreme-heat days projected 7→20/yr by 2055 (HVAC capex compounding) — expect insurance premiums to compound above CPI over the hold.
Questions for the listing agent
- It's been on market 251 days. Have you received any prior offers? Is the seller open to a 12% concession, seller financing, or rate buy-down credit?
- Built in 1916 — when were the roof, HVAC, electrical panel, plumbing, and water heater last replaced?
- Why hasn't it sold? Are there any deal-killer items the seller is aware of (foundation, flood, title, zoning, code violations)?
- Is there a deadline driving the sale (1031 exchange, divorce, estate, relocation)? That informs how much negotiation room exists.
- Schools are B-rated — typically a magnet for longer-tenancy family renters. What's the average tenant stay here, and is there a school-zone premium baked into asking?
- What's the average days-on-market for RENTAL listings here right now (not sales)? A rising rental-DOM trend means longer vacancies and softer asking-rent achievability than the comps imply.
- What's the recent tenant-quality profile in this submarket — average credit score on applications, eviction rate, late-payment / NSF rate, and stable-employment percentage? A property-management company in the area should have these aggregated.
- How much new for-sale + rental construction is in the pipeline within 1–3 miles? Heavy new supply typically softens prices + rents 12–24 months out; constrained supply supports both.
Investment metrics
- 1% rule
- 1.17% ✓
- Cap rate
- 9.73%
- Cash-on-cash
- 12.27%
- DSCR
- 1.55
- GRM
- 7.1
CMA / ARV
- ARV (on-the-fly)
- $108,630
- Comps found
- 12
Show comp detail 12 sales within ~0.75 mi
| Address | Dist | Beds/Ba | Sqft | Sold | Price | $/sf | Match |
|---|---|---|---|---|---|---|---|
| 1403 Myrtle Ave N | 0.28mi | 3/2.0 | 1,482 (-3%) | 12mo | $81,000 | $55 | 67 |
| 1039 Scriven St | 0.64mi | 4/1.0 (+1) | 1,492 (-2%) | 1mo | $23,000 | $15 | 60 |
| 1016 Grunthal St | 0.74mi | 3/1.5 | 1,552 (+1%) | 4mo | $50,000 | $32 | 58 |
| 1105 W 12th St | 0.74mi | 3/2.0 | 1,504 (-2%) | 4mo | $193,000 | $128 | 56 |
| 1625 Perry St | 0.70mi | 3/2.5 | 1,571 (+3%) | 1mo | $337,000 | $215 | 56 |
| 1916 E Durkee Dr | 0.60mi | 3/2.0 | 1,562 (+2%) | 12mo | $185,000 | $118 | 54 |
| 1424 W 9th St | 0.68mi | 4/2.0 (+1) | 1,462 (-4%) | 3mo | $75,000 | $51 | 49 |
| 1766 Myrtle Ave N | 0.57mi | 3/1.5 | 1,378 (-10%) | 10mo | $148,000 | $107 | 46 |
| 1482 W 7th St | 0.62mi | 3/1.0 | 1,325 (-13%) | 6mo | $17,500 | $13 | 44 |
| 1160 N Durkee Dr | 0.67mi | 3/1.0 | 1,319 (-14%) | 13mo | $141,000 | $107 | 35 |
| 1534 W 7th St | 0.69mi | 4/2.0 (+1) | 1,323 (-14%) | 5mo | $62,000 | $47 | 32 |
| 1307 Grunthal St | 0.72mi | 4/2.0 (+1) | 1,684 (+10%) | 13mo | $120,000 | $71 | 30 |
Match score weights: distance 35% · size 25% · config 20% · recency 20%. Top-matched comps best support the ARV.
Projected returns pro-forma
-3.0% appreciation · 1.81% rent growth · sell at horizon
- IRR
- 0.6%
- Equity multiple
- 1.02×
- Total profit
- $839
- Equity at exit
- $19,965
- IRR
- 9.0%
- Equity multiple
- 1.66×
- Total profit
- $24,663
- Equity at exit
- $11,577
Cash invested: $37,492 (down + closing). Projections, not guarantees.
Landlord ↔ Tenant lean methodology
- Overall (STATE)
- 87 Strongly Landlord-Friendly
- State Florida
- 87 Strongly Landlord-Friendly · R+3
- County
- — inherits STATE
- City
- — inherits STATE
ZIP-level market 32209
- Home prices YoY
- -22.1%
- Rents YoY
- 1.8%
- Active inventory
- 394
- Price-to-rent
- 7.1×
Monthly cashflow live
- Estimated rent
- $1,563 high interval (Pro) →
- Mortgage (P&I)
- −$702
- Tax from tax record
- −$93 /mo · $1,120/yr
- Insurance
- −$56
- HOA
- −$0
- Vacancy / Maint / Mgmt
- −$328
- Net cashflow
- $383
Break-even live
UW: 25.0% down · 7.5% · 30yr · 1.5% tax · 5.0% vac · 8.0% maint · 8.0% mgmt
Financing live
Cash to close
- Down payment
- $33,475
- Closing costs
- $4,017
- Reserves months
- —
- Total cash needed
- —
Loan-product check · same deal, 3 products live
Conventional
25% down · 7.5% · 30yr
- Down + closing
- —
- Monthly P&I
- —
- Monthly cashflow
- —
- DSCR
- —
- Eligible?
- —
Personal DTI + credit; lowest rate.
DSCR
20% down · 8.5% · 30yr
- Down + closing
- —
- Monthly P&I
- —
- Monthly cashflow
- —
- DSCR
- —
- Eligible?
- —
No personal income docs; deal must DSCR.
Hard money
10% down · 12.0% · 12mo
- Down + closing
- —
- Monthly P&I
- —
- Monthly cashflow
- —
- DSCR
- —
- Eligible?
- —
Short-term bridge; refi at stabilization.
Rent comps 40 comps
| Address | Beds | Baths | Sqft | Rent | $/sqft | DOM | Units | Dist |
|---|---|---|---|---|---|---|---|---|
| 1454 Francis St Jacksonville, FL | 3.0 | 2.0 | 1084 | $1,243 | $1.15 | 23d | 1 | 0.20mi |
| 1464 N Myrtle Ave Jacksonville, FL | 2.0 | 1.0 | 1136 | $1,400 | $1.23 | 23d | 1 | 0.35mi |
| 1355 Grothe St Jacksonville, FL | 4.0 | 1.0 | 1312 | $1,350 | $1.03 | 17d | 1 | 0.42mi |
| 1470 Windle St Jacksonville, FL | 3.0 | 2.0 | 1170 | $1,425 | $1.22 | 14d | 1 | 0.59mi |
| 1619 Whitner St Jacksonville, FL | 3.0 | 2.0 | 1547 | $1,150 | $0.74 | 1d | 1 | 0.61mi |
| 181 Barstow Pl Jacksonville, FL | 3.0 | 2.5 | 1363 | $2,500 | $1.83 | 23d | 1 | 0.66mi |
| 1545 Union St W Jacksonville, FL | 3.0 | 2.0 | 1253 | $1,400 | $1.12 | 3d | 1 | 0.71mi |
| 1607 Logan St Jacksonville, FL | 4.0 | 2.0 | 1232 | $1,800 | $1.46 | 23d | 1 | 0.74mi |
| 1640 W 4th St Unit 1 Jacksonville, FL | 4.0 | 2.0 | 1119 | $1,675 | $1.50 | 20d | 1 | 0.75mi |
| 421 W Church St Jacksonville, FL | 1.0–2.0 | 1.0–2.0 | 1103 | $1,890 | $1.71 | 3d | 12 | 0.76mi |
| 1514 Silver St Jacksonville, FL | 3.0 | 2.0 | 1726 | $2,275 | $1.32 | 23d | 1 | 0.81mi |
| 2313 Janette St Jacksonville, FL | 4.0 | 2.0 | 1148 | $1,349 | $1.18 | 16d | 1 | 0.81mi |
| 1310 N Laura St Jacksonville, FL | 2.0 | 1.0 | 1225 | $1,650 | $1.35 | 23d | 1 | 0.87mi |
| 146 W 6th St Jacksonville, FL | 3.0 | 1.0 | 1600 | $1,475 | $0.92 | 20d | 1 | 0.87mi |
| 1781 W 3rd St Jacksonville, FL | 4.0 | 2.0 | 1632 | $650 | $0.40 | 23d | 1 | 0.91mi |
| 1148 N Main St Jacksonville, FL | 2.0 | 1.0–2.0 | 931 | $2,195 | $2.36 | 1d | 23 | 0.95mi |
| 231 W 10th St Jacksonville, FL | 3.0 | 1.0 | 1200 | $1,500 | $1.25 | 23d | 1 | 1.01mi |
| 1740 W 9th St Jacksonville, FL | 4.0 | 2.0 | 1148 | $1,285 | $1.12 | 20d | 1 | 1.02mi |
| 1931 Silver St Jacksonville, FL | 3.0 | 2.0 | 2132 | $2,600 | $1.22 | 23d | 1 | 1.02mi |
| 226 Spruce St Jacksonville, FL | 4.0 | 2.0 | 1196 | $1,148 | $0.96 | 3d | 1 | 1.03mi |
| 1319 Woods St Jacksonville, FL | 3.0 | 2.0 | 1103 | $1,221 | $1.11 | 23d | 1 | 1.06mi |
| 1525 W 15th St Jacksonville, FL | 3.0 | 1.0 | 1100 | $1,245 | $1.13 | 23d | 1 | 1.06mi |
| 503 W 16th St Jacksonville, FL | 4.0 | 1.5 | 1216 | $1,420 | $1.17 | 23d | 1 | 1.10mi |
| 100 Magnolia St Jacksonville, FL | 1.0–2.0 | 1.0–2.0 | 921 | $2,202 | $2.39 | 1d | 46 | 1.10mi |
| 2040 N Laura St Jacksonville, FL | 2.0 | 1.5 | 1300 | $1,498 | $1.15 | 23d | 1 | 1.13mi |
| 1866 W 6th St Jacksonville, FL | 3.0 | 1.0 | 1064 | $1,120 | $1.05 | 4d | 1 | 1.13mi |
| 1410 W 20th St Jacksonville, FL | 3.0 | 2.0 | 1170 | $1,485 | $1.27 | 14d | 1 | 1.17mi |
| 200 Riverside Ave Jacksonville, FL | 2.0 | 1.0–2.0 | 808 | $2,501 | $3.09 | 1d | 27 | 1.17mi |
| 429 W 18th St Jacksonville, FL | 2.0 | 1.0 | 1924 | $1,050 | $0.55 | 7d | 1 | 1.21mi |
| 55 E 9th St Jacksonville, FL | 3.0 | 1.5 | 1246 | $1,675 | $1.34 | 14d | 1 | 1.21mi |
| 519 W 19th St Jacksonville, FL | 2.0 | 2.0 | 1071 | $1,075 | $1.00 | 4d | 1 | 1.22mi |
| 519 W 19th St Unit a Jacksonville, FL | 2.0 | 1.5 | 1071 | $1,095 | $1.02 | 21d | 1 | 1.22mi |
| 519 W 19th St Unit a Jacksonville, FL | 2.0 | 1.5 | 1071 | $1,075 | $1.00 | 14d | 1 | 1.22mi |
| 519 W 19th St Jacksonville, FL | 2.0 | 2.0 | 1071 | $1,095 | $1.02 | 21d | 1 | 1.22mi |
| 30 W 12th St Jacksonville, FL | 4.0 | 3.0 | 1792 | $2,580 | $1.44 | 1d | 1 | 1.22mi |
| 122 E Duval St Jacksonville, FL | 2.0 | 2.5 | 1750 | $2,250 | $1.29 | 23d | 1 | 1.22mi |
| 220 Riverside Ave Jacksonville, FL | 2.0 | 1.0–2.0 | 887 | $1,966 | $2.22 | 1d | 33 | 1.23mi |
| 1943 Hardee St #1 Jacksonville, FL | 3.0 | 2.0 | 1622 | $1,248 | $0.77 | 4d | 1 | 1.23mi |
| 138 E Duval St Jacksonville, FL | 3.0 | 1.5 | 1450 | $3,200 | $2.21 | 23d | 1 | 1.24mi |
| 1431 W 21st St Jacksonville, FL | 3.0 | 2.0 | 1199 | $1,425 | $1.19 | 14d | 1 | 1.25mi |
Listing history 27 events
-
2026-06-18days on market $133,900 Active 251 DOM
-
2026-06-17days on market $133,900 Active 250 DOM
-
2026-06-16days on market $133,900 Active 249 DOM
-
2026-06-15days on market $133,900 Active 248 DOM
-
2026-06-10days on market $133,900 Active 242 DOM
-
2026-06-08days on market $133,900 Active 241 DOM
-
2026-06-08days on market $133,900 Active 240 DOM
-
2026-06-03days on market $133,900 Active 236 DOM
-
2026-06-02days on market $133,900 Active 235 DOM
-
2026-06-01days on market $133,900 Active 234 DOM
-
2026-05-31days on market $133,900 Active 233 DOM
-
2026-03-24status Active
-
2026-03-04status Pending
-
2026-02-20price $133,900
-
2026-02-05price $134,900
-
2026-02-02price $135,900
-
2026-01-22price $136,900
-
2025-11-08price $139,800
-
2025-10-30price $139,900
-
2025-10-23price $143,900
-
2025-10-16price $145,900
-
2025-10-09price $147,900
-
2025-09-20$149,900 Active
-
2025-07-24historical $1,399
-
2025-07-10price $1,399
-
2025-05-08$1,450
-
2022-11-30historical
ⓘ Source: listings_history table (triggers on properties + properties_extension) + one-shot
backfill from property_details.listing_events for pre-trigger history.
Tax reassessment forecast FL · Resets to sale price
- Current annual tax
- $1,120 · $93/mo
- Projected year-2 tax
- $1,120 · $93/mo
- Expected delta
- $0/yr ($0/mo · 0.0%)
ⓘ Screening estimate from a state-policy table — verify with the county assessor before closing.
Climate risk First Street
- Flood 4/10 Moderate FEMA zone X (unshaded) · 22% chance over 30 yrs
- Wildfire 1/10 Low
- Heat 9/10 Extreme 7 d/yr ≥107°F today · 20 d/yr by 30 yrs out
- Wind 9/10 Extreme 99% chance of damaging wind over 30 yrs
- Air quality 5/10 Major 7 unhealthy d/yr today · 7 by 30 yrs out
Nearby sold comps map
Loading sold comps map…
Walkable amenities ~0.75 mi
Loading nearby amenities…
Taxation est. · year 1
- Rental income
- $18,753
- − Mortgage interest
- −$7,500
- − Property taxes
- −$1,120
- − Insurance
- −$670
- − Repairs & maintenance
- −$1,500
- − Management
- −$1,500
- − Depreciation
- −$3,895
- Taxable income
- $2,567
- Est. tax owed @ 24.0%
- −$616
- After-tax cash flow
- $3,983/yr
For passive investors: Depreciation is non-cash, so a rental often shows a tax loss while cash-flowing — sheltering income. Rental losses are passive: they offset passive income freely, and up to $25,000/yr can offset ordinary (W-2) income if you actively participate and your MAGI is under $100k (phasing out to $0 by $150k); unused losses carry forward. On sale, claimed depreciation is recaptured at up to 25%, and gains may owe capital-gains tax (a 1031 exchange can defer both). Figures are a year-1 estimate at your 24.0% rate — not tax advice; consult a CPA.
Schools (NCES district)
- District
- Duval
- NCES district ID
- 1200480
- Math proficiency
- 46% ▼ -11.00%
- Reading proficiency
- 45% ▼ -4.00%
- Median HH income
- $48,987
- Composite
- 38.97/100
- National rank
- #4076
- State rank
- #48 of 73 in FL
Livability — Jacksonville
- Score
- 83/100
- State rank
- #50
- US rank
- #911
Category grades
Schools grade is shown separately in the Schools card above.
Census & demographics
- Census place
- Jacksonville, FL
- County
- Duval County · 1,015,274 people
- City population
- 979,034
- Metro
- Jacksonville, FL
- Population (ZIP)
- 34,657
- Household income
- $30,514
- Rent vs Own
- Severe rent burden
- 2921.0
Population outlook (Duval County) Hauer SSP2
- Today (2025)
- 1,013,010 people
- By 2030
- 1,059,228 · +4.6%
- By 2040
- 1,141,439 · +12.7%
- By 2050
- 1,205,258 · +19.0%
- By 2075
- 1,324,282 · +30.7%
- By 2100
- 1,319,620 · +30.3%
Race, ethnicity, and origin ACS 2023
- Neighborhood character
- Predominantly Black (88%)
- Race & ethnicity
- Black 88% White 5% Hispanic / Latino 5% Two or more races 2%
- Hispanic origin (detail)
- Puerto Rican 3%
- Common ancestry
- Hispanic 1% Romanian 1%
- Foreign-born
- 3% · Canada
- Languages at home
- 95% English-only · Spanish 4% French/Haitian/Cajun 1%
Political lean MEDSL · Duval
- 2024 margin
- Toss-up / Even · D 48.7% · R 50.1% · Other 1.2%
- 2008→2024 swing
- +0.4pp no change · 2008: -1.9pp · 2024: -1.5pp
- All cycles
- 2024: R+1.5 2020: D+3.8 2016: R+1.5 2012: R+3.6 2008: R+1.9
Not yet ingested
- Civics
- —
Market trends
- HPI YoY
- ▼ -53.92%
- Current HPI
- 189.5977
- Rent YoY
- ▲ 1.81%
- Metro
- Jacksonville, FL
- State GDP YoY
- ▲ 3.28%
- F500 in state
- 36
Industry mix (Fortune 500 HQ in FL)
| Industry | F500 HQs | Revenue |
|---|---|---|
| Industrial Technology | 2 | $29B |
|
||
| Insurance | 2 | $17B |
|
||
| Retail | 1 | $60B |
|
||
| Technology Distribution | 1 | $58B |
|
||
| Homebuilding | 1 | $35B |
|
||
| Technology Manufacturing | 1 | $35B |
|
||
Price history
+9134.5% since first listed16 events — show timeline
- 2026-03-24 Relisted — realMLS
- 2026-03-04 Pending — realMLS
- 2026-02-20 Price Changed $133,900 realMLS
- 2026-02-05 Price Changed $134,900 realMLS
- 2026-02-02 Price Changed $135,900 realMLS
- 2026-01-22 Price Changed $136,900 realMLS
- 2025-11-08 Price Changed $139,800 realMLS
- 2025-10-30 Price Changed $139,900 realMLS
- 2025-10-23 Price Changed $143,900 realMLS
- 2025-10-16 Price Changed $145,900 realMLS
- 2025-10-09 Price Changed $147,900 realMLS
- 2025-09-20 Listed $149,900 realMLS
- 2025-07-24 Rental Removed $1,399 STELLARMLS
- 2025-07-10 Price Changed $1,399 STELLARMLS
- 2025-05-08 Listed for Rent $1,450 STELLARMLS
- 2022-11-30 Rental Removed — STELLARMLS
Property tax history
+2.0%/yrLatest (2025): $1,120 · +30.8% YoY. Source: county tax records.
Cash-flow waterfall
monthlySold comps — $/sqft
last 12 mo · ≤1 miLoading sold comps…