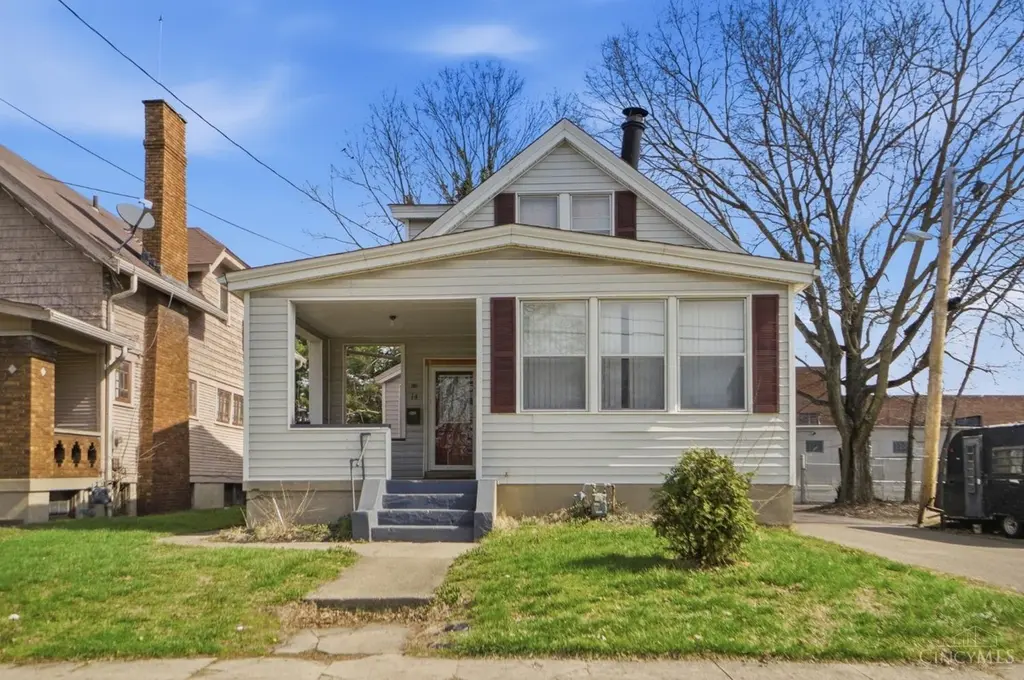
14 Seventy Third St W · Cincinnati, OH
Flood risk 1/10 · Minimal
- FEMA flood zone
- X (unshaded)
- Chance of flooding over 30 yrs
- 0.0%
- Est. flood insurance / yr
- $473 – $860
Fire risk 1/10 · Minimal
- Est. fire insurance / yr
- $713 – $1,323
Heat risk 5/10 · Moderate
- Hot days now (above 103°F)
- 7 days/yr
- Hot days in 30 yrs
- 20 days/yr
Wind risk 2/10 · Minimal
- Chance of severe wind over 30 yrs
- 1.0%
Air-quality risk 3/10 · Minor
- Unhealthy air days now
- 2 days/yr
- Unhealthy air days in 30 yrs
- 3 days/yr
Risk factors via First Street. Map © Google.
Why this score? — see what drove the C grade
The composite is a weighted blend of 9 inputs, each scored 0–100. Each bar is that input's sub-score; the figure is the points it added to the 100-point composite (weight × sub-score).
- Cash flow +21.3/30.0
- ARV discount +12.7/15.0
- DSCR +6.8/10.0
- 1% rule +5.1/10.0
- Livability +4.0/5.0
- Rent growth +2.5/5.0
- Schools +2.5/10.0
- Condition / age +2.5/5.0
- Appreciation +0.0/10.0
$157,000
🖨 Deal sheet 📄 Offer letter ✓ Due diligence
Listing remarks MLS
Nice two story with covered front porch privacy fenced back yard w/ off street pkg. Large Living room with WBFP plenty of space. Walk to school church, busline. Minute to I-75. Freshly painted thru-out, and new kitchen floor.
Key facts
- Newer furnace
- Glass block windows
- Newer water heater
Tags
Property features AI
Finance
- HOA & community: No HOA; Gated community lifestyle
Exterior
- Parking: On-street parking
- Utilities: Water at street; Sewer at street; Gas at street; Electric water heater
- Home design: Cape Cod style; Single-family home; One-and-one-half stories
- Construction: Poured foundation
- Exterior features: Shingle/composition roof; Aluminum windows; Aluminum siding; Property under 0.5 acre; Residential zoning
Interior
- Kitchen: Eat-in kitchen with laminate flooring; Dishwasher; Microwave
- Bedrooms: 3 bedrooms total; Primary bedroom on main (level 1); Two additional bedrooms on upper level
- Flooring: Laminate flooring in kitchen, dining room, living room, family room and foyer; Wall-to-wall carpet in study; Vinyl and concrete flooring in basement
- Bathrooms: One full bathroom; Primary bathroom includes sauna, shower, tub and other features
- Heating & cooling: Electric forced-air heating; Ceiling fans; Window AC units
- Interior features: Open foyer with laminate flooring; Fireplace in family room; 8 total rooms; Partially finished basement with concrete and vinyl flooring, walkout, some carpeted areas, glass block windows
- Laundry & utility: Basement utilities present
Neighborhood map
What this means for you Summary
Snapshot
- This is a 3-bed/1.0-bath single-family listed at $157k.
Deal economics
- At list price, monthly cash flow is $230 ($3k/yr) — positive.
- The deal already cash-flows at list — no discount required.
- Meets the 1% rule at list price ($2k rent vs $157k).
- Recommended offer: $148k (6.0% below list) — sets the bar for market timing.
- Cap rate 8.0% vs local median 3.9% in Cincinnati — top-decile yield for the area; either an underpriced asset or a hidden risk that comps aren't pricing in. Stress-test before assuming the spread holds.
Location & tenants
- Location reads 80/100 on livability (#130 in OH, #1,856 nationally) — a professional / high-income tenant draw. Strengths: amenities A+, commute A+, cost of living A+; Watch: employment D, crime F.
- Cincinnati Public Schools (urban): math 25% / reading 36% proficiency, ranked #581 of 656 in OH (top 89%) — families likely to look elsewhere, expect single-tenant / working-renter base with shorter leases; 70% free/reduced lunch — lower-income household profile, screen leases tightly.
- Market conditions: 19 active listings in the ZIP; 14 comparable units currently listed for rent nearby; rentals at typical pace (median 24d on market — plan ~3-4 weeks tenant-placement turnaround); lower-income renter base — watch delinquency; 801 units permitted in Hamilton County in 2024 (190 in 5+ unit buildings).
- This rent runs 43% of the median local income ($44k/yr) — at the standard rent-burdened threshold; future hikes will face affordability resistance.
Forward outlook
- Local home prices are declining (-3.0%/yr); year-one equity from $1k of loan paydown is wiped out by about $5k of value loss. Plan a longer hold.
Negotiation context
- It's been on market 84 days — a 6% lower offer ($148k) is reasonable based on typical stale-listing flexibility.
- 4 sale attempts since 24y ago with the ask held roughly flat each time — persistent listings suggest the price (not the market) is what's stuck; bring a comps-based counter.
- Current owner paid $78k; list at $157k implies a 103% gain — meaningful room to come down on a strong offer.
Risks & watch-outs
- Watch-outs: built in 1915 — expect roof / HVAC / electrical / plumbing capex.
- Climate carrying-cost: extreme-heat days projected 7→20/yr by 2055 (HVAC capex compounding) — expect insurance premiums to compound above CPI over the hold.
Questions for the listing agent
- It's been on market 84 days. Have you received any prior offers? Is the seller open to a 6% concession, seller financing, or rate buy-down credit?
- Built in 1915 — when were the roof, HVAC, electrical panel, plumbing, and water heater last replaced?
- Why hasn't it sold? Are there any deal-killer items the seller is aware of (foundation, flood, title, zoning, code violations)?
- Is there a deadline driving the sale (1031 exchange, divorce, estate, relocation)? That informs how much negotiation room exists.
- Schools are B-rated — typically a magnet for longer-tenancy family renters. What's the average tenant stay here, and is there a school-zone premium baked into asking?
- Crime grade is F in this area — have there been break-ins, vandalism, or insurance claims at this property in the last 3 years? What carrier currently insures it and at what premium?
- What's the average days-on-market for RENTAL listings here right now (not sales)? A rising rental-DOM trend means longer vacancies and softer asking-rent achievability than the comps imply.
- What's the recent tenant-quality profile in this submarket — average credit score on applications, eviction rate, late-payment / NSF rate, and stable-employment percentage? A property-management company in the area should have these aggregated.
- How much new for-sale + rental construction is in the pipeline within 1–3 miles? Heavy new supply typically softens prices + rents 12–24 months out; constrained supply supports both.
Investment metrics
- 1% rule
- 1.01% ✓
- Cap rate
- 8.05%
- Cash-on-cash
- 6.27%
- DSCR
- 1.28
- GRM
- 8.3
CMA / ARV
- ARV (on-the-fly)
- $177,320
- Comps found
- 12
Show comp detail 12 sales within ~0.75 mi
| Address | Dist | Beds/Ba | Sqft | Sold | Price | $/sf | Match |
|---|---|---|---|---|---|---|---|
| 120 W Seventy Second St | 0.28mi | 3/1.5 | 1,541 (-4%) | 2mo | $200,000 | $130 | 76 |
| 133 W Seventy Third St | 0.12mi | 3/2.0 | 1,536 (-5%) | 9mo | $160,000 | $104 | 75 |
| 3 W Seventy Third St | 0.03mi | 4/3.0 (+1) | 1,730 (+7%) | 1mo | $178,000 | $103 | 72 |
| 1361 Woodland Ave | 0.63mi | 4/1.0 (+1) | 1,620 (+0%) | 2mo | $105,000 | $65 | 63 |
| 38 Escalon St | 0.25mi | 3/1.0 | 1,391 (-14%) | 6mo | $108,000 | $78 | 60 |
| 6617 Fairpark Ave | 0.55mi | 3/2.0 | 1,680 (+4%) | 4mo | $235,000 | $140 | 60 |
| 1418 Lakeland Ave | 0.70mi | 3/1.5 | 1,584 (-2%) | 4mo | $175,000 | $110 | 59 |
| 117 Nansen St | 0.15mi | 2/1.0 (-1) | 1,380 (-14%) | 6mo | $172,000 | $125 | 59 |
| 1422 Beaverton Ave | 0.71mi | 3/1.0 | 1,658 (+3%) | 5mo | $220,900 | $133 | 58 |
| 203 W Sixty Ninth St | 0.39mi | 3/2.0 | 1,451 (-10%) | 10mo | $115,000 | $79 | 53 |
| 6310 Vine St | 0.73mi | 2/2.0 (-1) | 1,509 (-6%) | 1mo | $105,000 | $70 | 45 |
| 1427 Beaverton Ave | 0.72mi | 3/1.0 | 1,790 (+11%) | 10mo | $245,000 | $137 | 40 |
Match score weights: distance 35% · size 25% · config 20% · recency 20%. Top-matched comps best support the ARV.
Projected returns pro-forma
-3.0% appreciation · 3.0% rent growth · sell at horizon
- IRR
- -6.7%
- Equity multiple
- 0.75×
- Total profit
- $-10,829
- Equity at exit
- $23,409
- IRR
- 3.0%
- Equity multiple
- 1.21×
- Total profit
- $9,341
- Equity at exit
- $13,574
Cash invested: $43,960 (down + closing). Projections, not guarantees.
Landlord ↔ Tenant lean methodology
- Overall (STATE)
- 73 Landlord-Friendly
- State Ohio
- 73 Landlord-Friendly · R+6
- County
- — inherits STATE
- City
- — inherits STATE
ZIP-level market 45216
- Home prices YoY
- -19.1%
- Active inventory
- 19
- Price-to-rent
- 8.3×
Monthly cashflow live
- Estimated rent
- $1,582 high interval (Pro) →
- Mortgage (P&I)
- −$823
- Tax from tax record
- −$132 /mo · $1,581/yr
- Insurance
- −$65
- HOA
- −$0
- Vacancy / Maint / Mgmt
- −$332
- Net cashflow
- $230
Break-even live
UW: 25.0% down · 7.5% · 30yr · 1.5% tax · 5.0% vac · 8.0% maint · 8.0% mgmt
Financing live
Cash to close
- Down payment
- $39,250
- Closing costs
- $4,710
- Reserves months
- —
- Total cash needed
- —
Loan-product check · same deal, 3 products live
Conventional
25% down · 7.5% · 30yr
- Down + closing
- —
- Monthly P&I
- —
- Monthly cashflow
- —
- DSCR
- —
- Eligible?
- —
Personal DTI + credit; lowest rate.
DSCR
20% down · 8.5% · 30yr
- Down + closing
- —
- Monthly P&I
- —
- Monthly cashflow
- —
- DSCR
- —
- Eligible?
- —
No personal income docs; deal must DSCR.
Hard money
10% down · 12.0% · 12mo
- Down + closing
- —
- Monthly P&I
- —
- Monthly cashflow
- —
- DSCR
- —
- Eligible?
- —
Short-term bridge; refi at stabilization.
Rent comps 14 comps
| Address | Beds | Baths | Sqft | Rent | $/sqft | DOM | Units | Dist |
|---|---|---|---|---|---|---|---|---|
| 6655 Vine St Cincinnati, OH | 4.0 | 1.5 | 1550 | $1,800 | $1.16 | 23d | 1 | 0.45mi |
| 113 W 66th St Cincinnati, OH | 3.0 | 2.0 | 1166 | $1,800 | $1.54 | 4d | 1 | 0.60mi |
| 5912 Elmwood Ave Cincinnati, OH | 3.0 | 1.0 | 1323 | $1,450 | $1.10 | 4d | 1 | 0.99mi |
| 1635 Section Rd Unit 3 Cincinnati, OH | 2.0 | 1.0 | 1500 | $995 | $0.66 | 23d | 1 | 1.04mi |
| 7209 Brookcrest Dr Unit 1 Cincinnati, OH | 2.0 | 1.0 | 1100 | $1,395 | $1.27 | 4d | 1 | 1.06mi |
| 7209 Brookcrest Dr Unit 2 Cincinnati, OH | 2.0 | 1.0 | 1100 | $1,395 | $1.27 | 17d | 1 | 1.06mi |
| 7734 Greenland Pl Unit 3 Cincinnati, OH | 2.0 | 1.5 | 1200 | $1,200 | $1.00 | 23d | 1 | 1.13mi |
| 7734 Greenland Pl Unit 4 Cincinnati, OH | 2.0 | 2.0 | 1200 | $1,150 | $0.96 | 23d | 1 | 1.13mi |
| 7746 Greenland Pl Apt 2 Cincinnati, OH | 2.0 | 1.5 | 1200 | $1,200 | $1.00 | 23d | 1 | 1.15mi |
| 1617 Pelham Pl Unit 1 Cincinnati, OH | 2.0 | 1.0 | 1100 | $1,450 | $1.32 | 23d | 1 | 1.19mi |
| 7147 Eastlawn Dr Apt 4 Cincinnati, OH | 3.0 | 1.0 | 1100 | $1,600 | $1.45 | 3d | 1 | 1.25mi |
| 7844 Glenorchard Dr Cincinnati, OH | 4.0 | 2.0 | 1400 | $1,800 | $1.29 | 14d | 1 | 1.28mi |
| 1992 E Seymour Ave Cincinnati, OH | 2.0 | 1.0 | 767 | $1,325 | $1.73 | 4d | 7 | 1.33mi |
| 8346 Anthony Wayne Ave Cincinnati, OH | 3.0 | 2.0 | 1716 | $1,750 | $1.02 | 23d | 1 | 1.45mi |
Listing history 27 events
-
2026-06-18days on market $157,000 Active 84 DOM
-
2026-06-17days on market $157,000 Active 83 DOM
-
2026-06-16days on market $157,000 Active 82 DOM
-
2026-06-15days on market $157,000 Active 81 DOM
-
2026-06-13days on market $157,000 Active 79 DOM
-
2026-06-13days on market $157,000 Active 78 DOM
-
2026-06-09days on market $157,000 Active 75 DOM
-
2026-06-08days on market $157,000 Active 74 DOM
-
2026-06-07days on market $157,000 Active 73 DOM
-
2026-06-03days on market $157,000 Active 69 DOM
-
2026-06-02days on market $157,000 Active 68 DOM
-
2026-06-01days on market $157,000 Active 67 DOM
-
2026-05-31days on market $157,000 Active 66 DOM
-
2026-05-21price $157,000
-
2026-04-04price $164,999
-
2026-03-26$165,000 Active
-
2005-06-29soldstatus $77,500
-
2005-06-20soldstatus $77,500 226-char remark
Show marketing remark (226 chars)
Nice two story with covered front porch privacy fenced back yard w/ off street pkg. Large Living room with WBFP plenty of space. Walk to school church, busline. Minute to I-75. Freshly painted thru-out, and new kitchen floor.
-
2005-05-04$79,900 226-char remark
Show marketing remark (226 chars)
Nice two story with covered front porch privacy fenced back yard w/ off street pkg. Large Living room with WBFP plenty of space. Walk to school church, busline. Minute to I-75. Freshly painted thru-out, and new kitchen floor.
-
2005-04-03historical
-
2004-10-12$79,900
-
2003-06-20soldstatus $69,000
-
2003-06-20soldstatus $69,000
-
2002-12-05soldstatus $69,900
-
2002-09-23$69,900
-
1994-12-22soldstatus $35,000
-
1994-08-29soldstatus $30,000
ⓘ Source: listings_history table (triggers on properties + properties_extension) + one-shot
backfill from property_details.listing_events for pre-trigger history.
Tax reassessment forecast OH · Partial reset (capped growth)
- Current annual tax
- $1,581 · $132/mo
- Projected year-2 tax
- $2,015 · $168/mo
- Expected delta
- +$434/yr (+$36/mo · 27.5%)
ⓘ Screening estimate from a state-policy table — verify with the county assessor before closing.
Climate risk First Street
- Flood 1/10 Low FEMA zone X (unshaded) · 0% chance over 30 yrs
- Wildfire 1/10 Low
- Heat 5/10 Major 7 d/yr ≥103°F today · 20 d/yr by 30 yrs out
- Wind 2/10 Low 100% chance of damaging wind over 30 yrs
- Air quality 3/10 Moderate 2 unhealthy d/yr today · 3 by 30 yrs out
Nearby sold comps map
Loading sold comps map…
Walkable amenities ~0.75 mi
Loading nearby amenities…
Taxation est. · year 1
- Rental income
- $18,990
- − Mortgage interest
- −$8,794
- − Property taxes
- −$1,581
- − Insurance
- −$785
- − Repairs & maintenance
- −$1,519
- − Management
- −$1,519
- − Depreciation
- −$4,567
- Taxable income
- $224
- Est. tax owed @ 24.0%
- −$54
- After-tax cash flow
- $2,702/yr
For passive investors: Depreciation is non-cash, so a rental often shows a tax loss while cash-flowing — sheltering income. Rental losses are passive: they offset passive income freely, and up to $25,000/yr can offset ordinary (W-2) income if you actively participate and your MAGI is under $100k (phasing out to $0 by $150k); unused losses carry forward. On sale, claimed depreciation is recaptured at up to 25%, and gains may owe capital-gains tax (a 1031 exchange can defer both). Figures are a year-1 estimate at your 24.0% rate — not tax advice; consult a CPA.
Schools (NCES district)
- District
- Cincinnati Public Schools
- NCES district ID
- 3904375
- Math proficiency
- 25% ▼ -19.00%
- Reading proficiency
- 36% ▼ -14.00%
- Median HH income
- $35,743
- Composite
- 25.21/100
- National rank
- #7508
- State rank
- #581 of 656 in OH
Livability — Cincinnati
- Score
- 80/100
- State rank
- #130
- US rank
- #1856
Category grades
Schools grade is shown separately in the Schools card above.
Census & demographics
- Census place
- Cincinnati, OH
- County
- Hamilton County · 701,295 people
- City population
- 505,555
- Metro
- Cincinnati, OH-KY-IN
- Population (ZIP)
- 9,569
- Household income
- $44,099
- Rent vs Own
- Severe rent burden
- 407.0
Population outlook (Hamilton County) Hauer SSP2
- Today (2025)
- 826,054 people
- By 2030
- 830,947 · +0.6%
- By 2040
- 832,319 · +0.8%
- By 2050
- 822,428 · -0.4%
- By 2075
- 788,688 · -4.5%
- By 2100
- 710,674 · -14.0%
Race, ethnicity, and origin ACS 2023
- Neighborhood character
- Diverse neighborhood (Simpson 0.63)
- Race & ethnicity
- White 56% Black 20% Hispanic / Latino 15% Two or more races 10%
- Hispanic origin (detail)
- Mexican 5%
- Common ancestry
- Romanian 2% Serbian 2% Iranian 1%
- Foreign-born
- 12% · Canada, Guatemala
- Languages at home
- 88% English-only · Spanish 11%
Political lean MEDSL · Hamilton
- 2024 margin
- D (+14.9) · D 57.0% · R 42.1%
- 2008→2024 swing
- +7.9pp toward D · 2008: 7.0pp · 2024: 14.9pp
- All cycles
- 2024: D+14.9 2020: D+15.9 2016: D+9.5 2012: D+4.9 2008: D+7.0
Not yet ingested
- Civics
- —
Market trends
- HPI YoY
- ▼ -58.73%
- Current HPI
- 248.8995
- Rent YoY
- —
- Metro
- Cincinnati, OH-KY-IN
- State GDP YoY
- ▲ 1.98%
- F500 in state
- 48
Industry mix (Fortune 500 HQ in OH)
| Industry | F500 HQs | Revenue |
|---|---|---|
| Insurance | 3 | $145B |
|
||
| Industrial Machinery | 3 | $49B |
|
||
| Financial Services | 3 | $24B |
|
||
| Consumer Goods | 2 | $93B |
|
||
| Aerospace / Defense | 2 | $47B |
|
||
| Utilities | 2 | $33B |
|
||
Price history
+423.3% since first listed14 events — show timeline
- 2026-05-21 Price Changed $157,000 Cincy MLS
- 2026-04-04 Price Changed $164,999 Cincy MLS
- 2026-03-26 Listed $165,000 Cincy MLS
- 2005-06-29 Sold (Public Records) $77,500 Public Records
- 2005-06-20 Sold (MLS) $77,500 Cincy MLS
- 2005-05-04 Listed $79,900 Cincy MLS
- 2005-04-03 Listing Removed — Cincy MLS
- 2004-10-12 Listed $79,900 Cincy MLS
- 2003-06-20 Sold (Public Records) $69,000 Public Records
- 2003-06-20 Sold (Public Records) $69,000 Public Records
- 2002-12-05 Sold (MLS) $69,900 Cincy MLS
- 2002-09-23 Listed $69,900 Cincy MLS
- 1994-12-22 Sold (Public Records) $35,000 Public Records
- 1994-08-29 Sold (Public Records) $30,000 Public Records
Property tax history
+2.2%/yrLatest (2025): $1,581 · +3.0% YoY. Source: county tax records.
Cash-flow waterfall
monthlySold comps — $/sqft
last 12 mo · ≤1 miLoading sold comps…