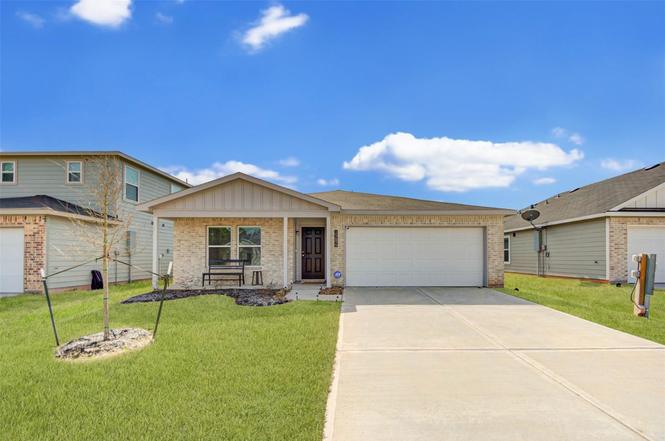
15694 Briar Forest Dr · Deerwood, TX
Flood risk 1/10 · Minimal
- FEMA flood zone
- X (unshaded)
- Chance of flooding over 30 yrs
- 0.0%
- Est. flood insurance / yr
- $507 – $1,088
Fire risk 4/10 · Minor
- Est. fire insurance / yr
- $1,222 – $2,270
Heat risk 8/10 · Major
- Hot days now (above 111°F)
- 7 days/yr
- Hot days in 30 yrs
- 23 days/yr
Wind risk 8/10 · Major
- Chance of severe wind over 30 yrs
- 99.0%
Air-quality risk 2/10 · Minimal
- Unhealthy air days now
- 2 days/yr
- Unhealthy air days in 30 yrs
- 2 days/yr
Risk factors via First Street. Map © Google.
Why this score? — see what drove the C grade
The composite is a weighted blend of 9 inputs, each scored 0–100. Each bar is that input's sub-score; the figure is the points it added to the 100-point composite (weight × sub-score).
- Cash flow +20.1/30.0
- ARV discount +14.3/15.0
- DSCR +6.4/10.0
- 1% rule +5.8/10.0
- Schools +5.1/10.0
- Rent growth +2.5/5.0
- Livability +2.5/5.0
- Condition / age +2.5/5.0
- Appreciation +0.0/10.0
$195,000
🖨 Deal sheet 📄 Offer letter ✓ Due diligence
Listing remarks
If your looking for country living while still being close to the city this is the home for you . Built in 2022 this home has everything you need. Don’t miss this opportunity to own a BEAUTIFUL Home in the Crockett Reserve Community! The desirable floor plan boasts a flex room that could function as a study, a craft room, or whatever else fits your needs. Kitchen highlights include gorgeous cabinets, granite counter tops, and Steel Appliances (Includes, Range with Microwave, and Dishwasher). In the primary suite, there is a private bath with dual vanity sinks and a walk-in closet. The other 3 bedrooms are well-sized and share another full-sized bath. You’ll love the versatile
Key facts
- Private bath
- Flex room
- Steel appliances
Tags
Property features AI
Finance
- Other: Lease considered
- HOA & community: Waterstone Development association; Annual association fee of $265
Exterior
- Parking: Attached 2-car garage
- Security: Smoke detectors
- Utilities: Public water; Public sewer
- Home design: Residential property; North-facing; One story; Full ownership
- Construction: Built in 2022; Brick and cement siding exterior; Composition roof; Slab foundation
- Exterior features: Fenced backyard; Porch
Interior
- Kitchen: Dishwasher; Electric oven; Electric range; Garbage disposal; Microwave; Refrigerator
- Bedrooms: Primary bedroom on the first floor (13 x 11); Bedroom on the first floor (10 x 10); Bedroom on the first floor (11 x 10); Bedroom on the first floor (11 x 10)
- Flooring: Carpet; Vinyl
- Bathrooms: 2 full bathrooms
- Heating & cooling: Central heating (electric); Central air conditioning (electric)
- Interior features: Double vanity; Kitchen/family room combo; Tub with shower; Low emissivity windows
- Laundry & utility: Washer hookup; Electric dryer hookup
Neighborhood map
What this means for you Summary
Snapshot
- This is a 4-bed/2.0-bath single-family listed at $195k.
Deal economics
- At list price, monthly cash flow is $243 ($3k/yr) — positive.
- The deal already cash-flows at list — no discount required.
- Meets the 1% rule at list price ($2k rent vs $195k).
- Recommended offer: $177k (9.0% below list) — sets the bar for market timing.
- Cap rate 7.8% vs local median 5.4% in Deerwood — top-decile yield for the area; either an underpriced asset or a hidden risk that comps aren't pricing in. Stress-test before assuming the spread holds.
Location & tenants
- Location reads: area grade C — affects rentability + tenant quality, not the cash-flow math above.
- Conroe ISD (other): math 57% / reading 57% proficiency, ranked #69 of 826 in TX (top 8%) — acceptable for families but not a draw, mixed tenant base, ~2y average lease.
- Zoned schools: Caney Creek H S (math 33% / reading 42%, grade F, #888 of 1,632 statewide, top 55%, 2,504 students, 79% FRL) — zoned schools average 79% FRL vs 34% district-wide (45 pts higher); higher-poverty schools than district average — tighter screening recommended.
- Zoned-school proficiency averages 38% at this address vs 57% district-wide (-20 pts) — the specific schools serving this property underperform the Conroe ISD average; the district grade overstates school quality for this exact location.
- Market conditions: 414 active listings in the ZIP; 2 comparable units currently listed for rent nearby; solid renter incomes; 13,259 units permitted in Montgomery County in 2024 (1,402 in 5+ unit buildings).
- This rent runs 33% of the median local income ($76k/yr) — at the standard rent-burdened threshold; future hikes will face affordability resistance.
Forward outlook
- Local home prices are declining (-3.0%/yr); year-one equity from $1k of loan paydown is wiped out by about $6k of value loss. Plan a longer hold.
- Montgomery County population projected at +65% by 2050 — long-run rental-demand tailwind backs the buy-and-hold thesis.
Negotiation context
- It's been on market 93 days — a 9% lower offer ($177k) is reasonable based on typical stale-listing flexibility.
- 5 sale attempts since 4y ago; this cycle's ask has dropped $25k (11%) from the opening price — seller is motivated, your offer sets the floor, not the list.
Risks & watch-outs
- Climate carrying-cost: severe wind risk, 99% chance of damaging wind over 30y; extreme-heat days projected 7→23/yr by 2055 (HVAC capex compounding) — expect insurance premiums to compound above CPI over the hold.
Questions for the listing agent
- It's been on market 93 days. Have you received any prior offers? Is the seller open to a 9% concession, seller financing, or rate buy-down credit?
- What does the HOA fee cover, when was the last increase, and are there any pending special assessments or reserve-fund shortfalls?
- Why hasn't it sold? Are there any deal-killer items the seller is aware of (foundation, flood, title, zoning, code violations)?
- Is there a deadline driving the sale (1031 exchange, divorce, estate, relocation)? That informs how much negotiation room exists.
- What's the average days-on-market for RENTAL listings here right now (not sales)? A rising rental-DOM trend means longer vacancies and softer asking-rent achievability than the comps imply.
- What's the recent tenant-quality profile in this submarket — average credit score on applications, eviction rate, late-payment / NSF rate, and stable-employment percentage? A property-management company in the area should have these aggregated.
- How much new for-sale + rental construction is in the pipeline within 1–3 miles? Heavy new supply typically softens prices + rents 12–24 months out; constrained supply supports both.
Investment metrics
- 1% rule
- 1.08% ✓
- Cap rate
- 7.79%
- Cash-on-cash
- 5.34%
- DSCR
- 1.24
- GRM
- 7.7
CMA / ARV
- ARV (on-the-fly)
- $229,908
- Comps found
- 12
Show comp detail 12 sales within ~0.75 mi
| Address | Dist | Beds/Ba | Sqft | Sold | Price | $/sf | Match |
|---|---|---|---|---|---|---|---|
| 15511 Taylorcrest Dr | 0.13mi | 4/2.0 | 1,471 (-12%) | 9mo | $178,000 | $121 | 67 |
| 15616 Del Norte Dr | 0.46mi | 4/2.0 | 1,603 (-4%) | 7mo | $229,900 | $143 | 67 |
| 15670 Briar Forest Dr | 0.06mi | 4/3.0 | 1,884 (+13%) | 12mo | $245,000 | $130 | 61 |
| 10719 Red Flagstone Dr | 0.69mi | 4/2.5 | 1,789 (+7%) | 1mo | $246,900 | $138 | 52 |
| 10715 Red Flagstone Dr | 0.68mi | 3/2.0 (-1) | 1,675 (+0%) | 13mo | $230,900 | $138 | 51 |
| 3952 Highline Oaks E | 0.67mi | 3/2.0 (-1) | 1,788 (+7%) | 2mo | $370,000 | $207 | 50 |
| 10743 Red Flagstone Dr | 0.74mi | 4/2.5 | 1,789 (+7%) | 3mo | $229,900 | $129 | 49 |
| 10739 Red Flagstone Dr | 0.74mi | 3/2.0 (-1) | 1,675 (+0%) | 14mo | $229,900 | $137 | 48 |
| 10707 Red Flagstone Dr | 0.66mi | 3/2.0 (-1) | 1,508 (-10%) | 2mo | $234,900 | $156 | 46 |
| 10734 Red Flagstone Dr | 0.72mi | 4/2.5 | 1,789 (+7%) | 12mo | $237,900 | $133 | 42 |
| 10735 Red Flagstone Dr | 0.73mi | 4/2.5 | 1,882 (+13%) | 12mo | $266,900 | $142 | 32 |
| 10726 Red Flagstone Dr | 0.70mi | 4/2.5 | 1,882 (+13%) | 15mo | $259,990 | $138 | 32 |
Match score weights: distance 35% · size 25% · config 20% · recency 20%. Top-matched comps best support the ARV.
Projected returns pro-forma
-3.0% appreciation · 3.0% rent growth · sell at horizon
- IRR
- -8.0%
- Equity multiple
- 0.71×
- Total profit
- $-16,048
- Equity at exit
- $29,075
- IRR
- 1.6%
- Equity multiple
- 1.11×
- Total profit
- $6,254
- Equity at exit
- $16,860
Cash invested: $54,600 (down + closing). Projections, not guarantees.
Landlord ↔ Tenant lean methodology
- Overall (STATE)
- 87 Strongly Landlord-Friendly
- State Texas
- 87 Strongly Landlord-Friendly · R+5
- County
- — inherits STATE
- City
- — inherits STATE
ZIP-level market 77306
- Home prices YoY
- -4.1%
- Active inventory
- 414
- Price-to-rent
- 7.7×
Monthly cashflow live
- Estimated rent
- $2,101 medium interval (Pro) →
- Mortgage (P&I)
- −$1,023
- Tax from tax record
- −$291 /mo · $3,487/yr
- Insurance
- −$81
- HOA
- −$22
- Vacancy / Maint / Mgmt
- −$441
- Net cashflow
- $243
Break-even live
UW: 25.0% down · 7.5% · 30yr · 1.5% tax · 5.0% vac · 8.0% maint · 8.0% mgmt
Financing live
Cash to close
- Down payment
- $48,750
- Closing costs
- $5,850
- Reserves months
- —
- Total cash needed
- —
Loan-product check · same deal, 3 products live
Conventional
25% down · 7.5% · 30yr
- Down + closing
- —
- Monthly P&I
- —
- Monthly cashflow
- —
- DSCR
- —
- Eligible?
- —
Personal DTI + credit; lowest rate.
DSCR
20% down · 8.5% · 30yr
- Down + closing
- —
- Monthly P&I
- —
- Monthly cashflow
- —
- DSCR
- —
- Eligible?
- —
No personal income docs; deal must DSCR.
Hard money
10% down · 12.0% · 12mo
- Down + closing
- —
- Monthly P&I
- —
- Monthly cashflow
- —
- DSCR
- —
- Eligible?
- —
Short-term bridge; refi at stabilization.
Rent comps 2 comps
| Address | Beds | Baths | Sqft | Rent | $/sqft | DOM | Units | Dist |
|---|---|---|---|---|---|---|---|---|
| 10050 Cerritos Dr Conroe, TX | 4.0 | 2.0 | 1400 | $1,499 | $1.07 | 24d | 1 | 0.19mi |
| 15743 Del Norte Dr Conroe, TX | 4.0 | 3.0 | 1811 | $1,895 | $1.05 | 43d | 1 | 0.19mi |
HOA detail
- Monthly dues
- $22 · $264/yr
Listing history 20 events
-
2026-05-11status Pending
-
2026-05-01status Pending
-
2026-04-07price $195,000
-
2026-03-13price $215,000
-
2026-02-06$220,000 Active
-
2023-06-30historical
-
2023-06-19price $240,000
-
2023-06-12price $252,000
-
2023-05-02price $259,000
-
2023-05-02status Active
-
2023-04-17status Pending
-
2023-04-11status Option Pending
-
2023-04-05$238,000 Active
-
2023-04-05historical
-
2023-03-15price $249,900
-
2023-03-07price $255,000
-
2023-02-17$260,000 Active
-
2022-06-30soldstatus Sold
-
2022-04-29status Pending
-
2022-03-31$253,490 Active
ⓘ Source: listings_history table (triggers on properties + properties_extension) + one-shot
backfill from property_details.listing_events for pre-trigger history.
Tax reassessment forecast TX · Resets to sale price
- Current annual tax
- $3,487 · $291/mo
- Projected year-2 tax
- $3,568 · $297/mo
- Expected delta
- +$81/yr (+$7/mo · 2.3%)
ⓘ Screening estimate from a state-policy table — verify with the county assessor before closing.
Climate risk First Street
- Flood 1/10 Low FEMA zone X (unshaded) · 0% chance over 30 yrs
- Wildfire 4/10 Moderate
- Heat 8/10 Severe 7 d/yr ≥111°F today · 23 d/yr by 30 yrs out
- Wind 8/10 Severe 99% chance of damaging wind over 30 yrs
- Air quality 2/10 Low 2 unhealthy d/yr today · 2 by 30 yrs out
Nearby sold comps map
Loading sold comps map…
Walkable amenities ~0.75 mi
Loading nearby amenities…
Taxation est. · year 1
- Rental income
- $25,206
- − Mortgage interest
- −$10,923
- − Property taxes
- −$3,487
- − Insurance
- −$975
- − Repairs & maintenance
- −$2,017
- − Management
- −$2,017
- − HOA
- −$264
- − Depreciation
- −$5,673
- Taxable loss
- −$148
- Est. tax savings @ 24.0%
- +$36
- After-tax cash flow
- $2,951/yr
For passive investors: Depreciation is non-cash, so a rental often shows a tax loss while cash-flowing — sheltering income. Rental losses are passive: they offset passive income freely, and up to $25,000/yr can offset ordinary (W-2) income if you actively participate and your MAGI is under $100k (phasing out to $0 by $150k); unused losses carry forward. On sale, claimed depreciation is recaptured at up to 25%, and gains may owe capital-gains tax (a 1031 exchange can defer both). Figures are a year-1 estimate at your 24.0% rate — not tax advice; consult a CPA.
Schools (NCES district)
- District
- Conroe ISD
- NCES district ID
- 4815000
- Math proficiency
- 57% ▼ -6.00%
- Reading proficiency
- 57% ▼ -1.00%
- Median HH income
- $71,541
- Composite
- 50.65/100
- National rank
- #1833
- State rank
- #69 of 826 in TX
Livability — Deerwood
No livability data for this city. (Only ~50 U.S. cities are tracked.)
Census & demographics
- County
- Montgomery County · 663,713 people
- Metro
- Houston-The Woodlands-Sugar Land, TX
- Population (ZIP)
- 18,086
- Household income
- $76,257
- Rent vs Own
- Severe rent burden
- 231.0
Population outlook (Montgomery County) Hauer SSP2
- Today (2025)
- 713,896 people
- By 2030
- 805,263 · +12.8%
- By 2040
- 992,708 · +39.1%
- By 2050
- 1,179,590 · +65.2%
- By 2075
- 1,628,084 · +128.1%
- By 2100
- 1,937,880 · +171.5%
Race, ethnicity, and origin ACS 2023
- Neighborhood character
- Majority Hispanic (55%)
- Race & ethnicity
- Hispanic / Latino 55% White 41% Two or more races 11% Black 2%
- Hispanic origin (detail)
- Mexican 51%
- Common ancestry
- Iranian 1% Slovak 1% Lithuanian 1%
- Foreign-born
- 21% · Canada
- Languages at home
- 53% English-only · Spanish 45% German/W. Germanic 1%
Political lean MEDSL · Montgomery
- 2024 margin
- Solid R (+45.5) · D 26.8% · R 72.3%
- 2008→2024 swing
- +7.2pp toward D · 2008: -52.7pp · 2024: -45.5pp
- All cycles
- 2024: R+45.5 2020: R+43.8 2016: R+51.4 2012: R+60.7 2008: R+52.7
Not yet ingested
- Civics
- —
Market trends
- HPI YoY
- ▼ -13.02%
- Current HPI
- 306.3801
- Rent YoY
- —
- Metro
- Houston-The Woodlands-Sugar Land, TX
- State GDP YoY
- ▲ 3.95%
- F500 in state
- 110
Industry mix (Fortune 500 HQ in TX)
| Industry | F500 HQs | Revenue |
|---|---|---|
| Energy | 16 | $1,198B |
|
||
| Technology | 5 | $198B |
|
||
| Engineering / Construction | 4 | $72B |
|
||
| Energy Services | 3 | $60B |
|
||
| Utilities | 3 | $41B |
|
||
| Healthcare | 2 | $330B |
|
||
Price history
-23.1% since first listed20 events — show timeline
- 2026-05-11 Pending — HARMLS
- 2026-05-01 Pending — HARMLS
- 2026-04-07 Price Changed $195,000 HARMLS
- 2026-03-13 Price Changed $215,000 HARMLS
- 2026-02-06 Listed $220,000 HARMLS
- 2023-06-30 Listing Removed — HARMLS
- 2023-06-19 Price Changed $240,000 HARMLS
- 2023-06-12 Price Changed $252,000 HARMLS
- 2023-05-02 Price Changed $259,000 HARMLS
- 2023-05-02 Relisted — HARMLS
- 2023-04-17 Pending — HARMLS
- 2023-04-11 Pending — HARMLS
- 2023-04-05 Listing Removed — HARMLS
- 2023-04-05 Listed $238,000 HARMLS
- 2023-03-15 Price Changed $249,900 HARMLS
- 2023-03-07 Price Changed $255,000 HARMLS
- 2023-02-17 Listed $260,000 HARMLS
- 2022-06-30 Sold (MLS) — HARMLS
- 2022-04-29 Pending — HARMLS
- 2022-03-31 Listed $253,490 HARMLS
Property tax history
+67.5%/yrLatest (2025): $3,487 · -2.5% YoY. Source: county tax records.
Cash-flow waterfall
monthlySold comps — $/sqft
last 12 mo · ≤1 miLoading sold comps…