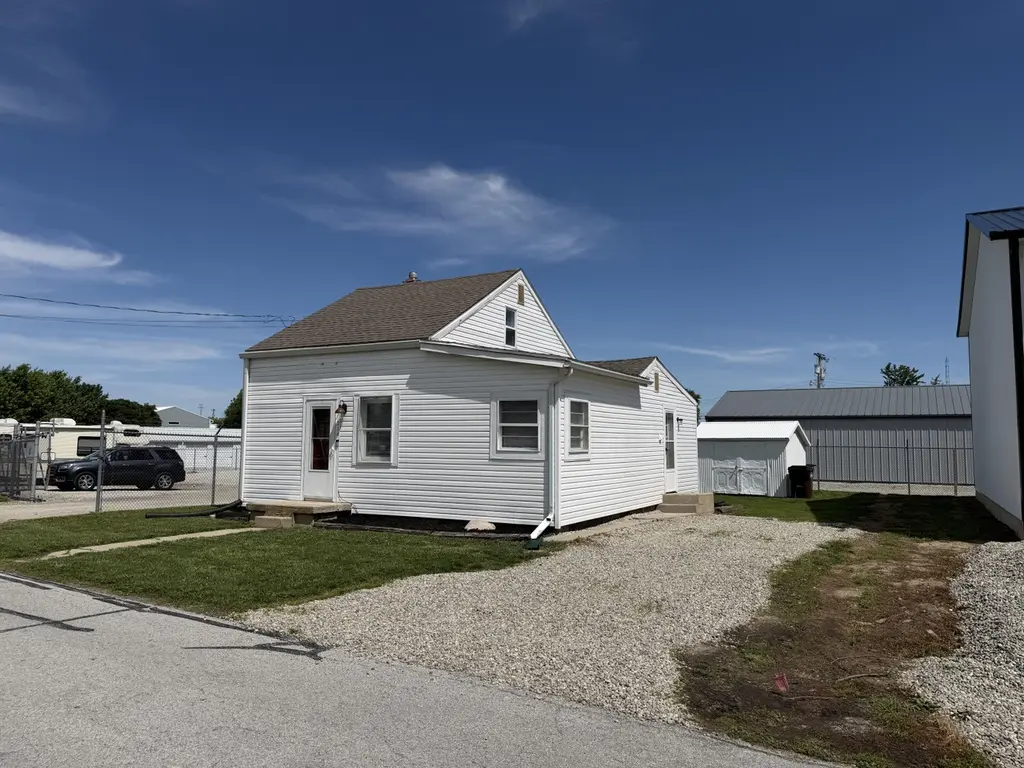
214 Northway Dr · St. Marys, OH
Flood risk 1/10 · Minimal
- FEMA flood zone
- X
- Chance of flooding over 30 yrs
- 0.0%
- Est. flood insurance / yr
- $507 – $1,088
Fire risk 1/10 · Minimal
- Est. fire insurance / yr
- $713 – $1,323
Heat risk 3/10 · Minor
- Hot days now (above 100°F)
- 7 days/yr
- Hot days in 30 yrs
- 18 days/yr
Wind risk 2/10 · Minimal
- Chance of severe wind over 30 yrs
- —
Air-quality risk 2/10 · Minimal
- Unhealthy air days now
- 1 days/yr
- Unhealthy air days in 30 yrs
- 2 days/yr
Risk factors via First Street. Map © Google.
Why this score? — see what drove the C+ grade
The composite is a weighted blend of 9 inputs, each scored 0–100. Each bar is that input's sub-score; the figure is the points it added to the 100-point composite (weight × sub-score).
- Cash flow +21.4/30.0
- ARV discount +15.0/15.0
- DSCR +6.8/10.0
- Schools +5.5/10.0
- 1% rule +4.9/10.0
- Rent growth +2.5/5.0
- Livability +2.5/5.0
- Condition / age +2.5/5.0
- Appreciation +0.0/10.0
$79,900
🖨 Deal sheet 📄 Offer letter ✓ Due diligence
Listing remarks
Welcome to this charming, move-in-ready lake related home near beautiful Grand Lake St Marys!! This cozy 2 bedroom 1 bath residence has been recently updated throughout. Enjoy fresh paint in every room, brand new vinyl plank flooring on the main level, and new carpet on the steps and upstairs!! Whether you're looking for a full time residence, weekend retreat or an investment opportunity, you'll appreciate the convenient location just minutes from the lake, dining, shopping, state park and recreational activities. Affordable, updated, and ready for it's next owner!!
Key facts
- 3,049 sq ft lot
- Built 1941
Property features AI
Exterior
- Utilities: Public sewer; Natural gas connected
- Home design: Single family residence; Residential property; Built in 1941; Regular lot
- Construction: Vinyl siding
- Exterior features: Deck; Shed(s); Supplied water
Interior
- Kitchen: Built-in gas oven
- Flooring: Carpet; Vinyl
- Bathrooms: 1 full bathroom
- Heating & cooling: Baseboard heating; Forced air heating; Window AC unit(s)
- Interior features: Built-in gas oven; Crawl space basement
Neighborhood map
What this means for you Summary
Snapshot
- This is a 2-bed/1.0-bath single-family listed at $80k.
Deal economics
- At list price, monthly cash flow is $118 ($1k/yr) — positive.
- The deal already cash-flows at list — no discount required.
- To meet the 1% rule (rent ≥ 1% of price), the offer needs to be $79k (0.8% below list).
- Recommended offer: $79k (0.8% below list) — sets the bar for 1% rule.
- Cap rate 8.1% vs local median 3.0% in St. Marys — top-decile yield for the area; either an underpriced asset or a hidden risk that comps aren't pricing in. Stress-test before assuming the spread holds.
Location & tenants
- Location reads: area grade C — affects rentability + tenant quality, not the cash-flow math above.
- St Marys City (town): math 64% / reading 65% proficiency, ranked #221 of 656 in OH (top 34%) — acceptable for families but not a draw, mixed tenant base, ~2y average lease.
- Market conditions: 67 active listings in the ZIP; solid renter incomes; 121 units permitted in Auglaize County in 2024 (0 in 5+ unit buildings).
- This rent is only 13% of the median local income ($75k/yr) — well below the 30% rent-burden line; pricing power to push rent on renewal without tenant pushback.
Forward outlook
- Local home prices are declining (-3.0%/yr); year-one equity from $552 of loan paydown is wiped out by about $2k of value loss. Plan a longer hold.
- Auglaize County population projected at -12% by 2050 — secular population decline; favor cash flow + early exit over multi-decade hold.
Negotiation context
- Only 1 days on market — expect competitive offers; lowballing is unlikely to land.
- Current owner paid $14k; list at $80k implies a 492% gain — meaningful room to come down on a strong offer.
Risks & watch-outs
- Watch-outs: built in 1941 — expect roof / HVAC / electrical / plumbing capex.
Questions for the listing agent
- Built in 1941 — when were the roof, HVAC, electrical panel, plumbing, and water heater last replaced?
- Is there a deadline driving the sale (1031 exchange, divorce, estate, relocation)? That informs how much negotiation room exists.
- What's the average days-on-market for RENTAL listings here right now (not sales)? A rising rental-DOM trend means longer vacancies and softer asking-rent achievability than the comps imply.
- What's the recent tenant-quality profile in this submarket — average credit score on applications, eviction rate, late-payment / NSF rate, and stable-employment percentage? A property-management company in the area should have these aggregated.
- How much new for-sale + rental construction is in the pipeline within 1–3 miles? Heavy new supply typically softens prices + rents 12–24 months out; constrained supply supports both.
Investment metrics
- 1% rule
- 0.99% ✗
- Cap rate
- 8.07%
- Cash-on-cash
- 6.35%
- DSCR
- 1.28
- GRM
- 8.4
CMA / ARV
- ARV (on-the-fly)
- $113,208
- Comps found
- 1
Show comp detail 1 sale within ~0.75 mi
| Address | Dist | Beds/Ba | Sqft | Sold | Price | $/sf | Match |
|---|---|---|---|---|---|---|---|
| 104 Villa Nova Blvd | 0.67mi | 2/1.0 | 768 (+8%) | 3mo | $122,000 | $159 | 54 |
Match score weights: distance 35% · size 25% · config 20% · recency 20%. Top-matched comps best support the ARV.
Projected returns pro-forma
-3.0% appreciation · 3.0% rent growth · sell at horizon
- IRR
- -6.5%
- Equity multiple
- 0.76×
- Total profit
- $-5,423
- Equity at exit
- $11,913
- IRR
- 3.1%
- Equity multiple
- 1.22×
- Total profit
- $4,924
- Equity at exit
- $6,908
Cash invested: $22,372 (down + closing). Projections, not guarantees.
Landlord ↔ Tenant lean methodology
- Overall (STATE)
- 73 Landlord-Friendly
- State Ohio
- 73 Landlord-Friendly · R+6
- County
- — inherits STATE
- City
- — inherits STATE
ZIP-level market 45885
- Active inventory
- 67
- Price-to-rent
- 8.4×
Monthly cashflow live
- Estimated rent
- $792 medium interval (Pro) →
- Mortgage (P&I)
- −$419
- Tax from tax record
- −$55 /mo · $663/yr
- Insurance
- −$33
- HOA
- −$0
- Vacancy / Maint / Mgmt
- −$166
- Net cashflow
- $118
Break-even live
UW: 25.0% down · 7.5% · 30yr · 1.5% tax · 5.0% vac · 8.0% maint · 8.0% mgmt
Financing live
Cash to close
- Down payment
- $19,975
- Closing costs
- $2,397
- Reserves months
- —
- Total cash needed
- —
Loan-product check · same deal, 3 products live
Conventional
25% down · 7.5% · 30yr
- Down + closing
- —
- Monthly P&I
- —
- Monthly cashflow
- —
- DSCR
- —
- Eligible?
- —
Personal DTI + credit; lowest rate.
DSCR
20% down · 8.5% · 30yr
- Down + closing
- —
- Monthly P&I
- —
- Monthly cashflow
- —
- DSCR
- —
- Eligible?
- —
No personal income docs; deal must DSCR.
Hard money
10% down · 12.0% · 12mo
- Down + closing
- —
- Monthly P&I
- —
- Monthly cashflow
- —
- DSCR
- —
- Eligible?
- —
Short-term bridge; refi at stabilization.
Listing history 3 events
-
2026-06-15status $79,900 Pending 1 DOM
-
2026-06-14remarks 572-char remark
-
2026-06-14$79,900 Active 1 DOM
ⓘ Source: listings_history table (triggers on properties + properties_extension) + one-shot
backfill from property_details.listing_events for pre-trigger history.
Tax reassessment forecast OH · Partial reset (capped growth)
- Current annual tax
- $663 · $55/mo
- Projected year-2 tax
- $954 · $80/mo
- Expected delta
- +$292/yr (+$24/mo · 44.1%)
ⓘ Screening estimate from a state-policy table — verify with the county assessor before closing.
Climate risk First Street
- Flood 1/10 Low FEMA zone X · 0% chance over 30 yrs
- Wildfire 1/10 Low
- Heat 3/10 Moderate 7 d/yr ≥100°F today · 18 d/yr by 30 yrs out
- Wind 2/10 Low
- Air quality 2/10 Low 1 unhealthy d/yr today · 2 by 30 yrs out
Nearby sold comps map
Loading sold comps map…
Walkable amenities ~0.75 mi
Loading nearby amenities…
Taxation est. · year 1
- Rental income
- $9,507
- − Mortgage interest
- −$4,476
- − Property taxes
- −$663
- − Insurance
- −$400
- − Repairs & maintenance
- −$761
- − Management
- −$761
- − Depreciation
- −$2,324
- Taxable income
- $124
- Est. tax owed @ 24.0%
- −$30
- After-tax cash flow
- $1,391/yr
For passive investors: Depreciation is non-cash, so a rental often shows a tax loss while cash-flowing — sheltering income. Rental losses are passive: they offset passive income freely, and up to $25,000/yr can offset ordinary (W-2) income if you actively participate and your MAGI is under $100k (phasing out to $0 by $150k); unused losses carry forward. On sale, claimed depreciation is recaptured at up to 25%, and gains may owe capital-gains tax (a 1031 exchange can defer both). Figures are a year-1 estimate at your 24.0% rate — not tax advice; consult a CPA.
Schools (NCES district)
- District
- St Marys City
- NCES district ID
- 3904472
- Math proficiency
- 64% ▼ -10.00%
- Reading proficiency
- 65% ▼ -4.00%
- Median HH income
- $49,672
- Composite
- 54.78/100
- National rank
- #1317
- State rank
- #221 of 656 in OH
Livability — St. Marys
No livability data for this city. (Only ~50 U.S. cities are tracked.)
Census & demographics
- County
- Auglaize · 44,666 people
- Population (ZIP)
- 12,744
- Household income
- $75,054
- Rent vs Own
- Severe rent burden
- 3.6
Population outlook (Auglaize County) Hauer SSP2
- Today (2025)
- 45,247 people
- By 2030
- 44,448 · -1.8%
- By 2040
- 42,355 · -6.4%
- By 2050
- 39,722 · -12.2%
- By 2075
- 33,967 · -24.9%
- By 2100
- 26,839 · -40.7%
Race, ethnicity, and origin ACS 2023
- Neighborhood character
- Predominantly White (94%)
- Race & ethnicity
- White 94% Two or more races 4%
- Common ancestry
- Lithuanian 3% Iranian 2% Slovak 1%
- Foreign-born
- 1%
- Languages at home
- 98% English-only · German/W. Germanic 1% Other Asian/Pacific 1%
Political lean MEDSL · Auglaize
- 2024 margin
- Solid R (+64.6) · D 17.3% · R 81.9%
- 2008→2024 swing
- -23.4pp toward R · 2008: -41.2pp · 2024: -64.6pp
- All cycles
- 2024: R+64.6 2020: R+62.6 2016: R+62.6 2012: R+48.9 2008: R+41.2
Not yet ingested
- Civics
- —
Market trends
- HPI YoY
- ▼ -207.83%
- Current HPI
- 197.352
- Rent YoY
- —
- Metro
- —
- State GDP YoY
- ▲ 1.98%
- F500 in state
- 48
Industry mix (Fortune 500 HQ in OH)
| Industry | F500 HQs | Revenue |
|---|---|---|
| Insurance | 3 | $145B |
|
||
| Industrial Machinery | 3 | $49B |
|
||
| Financial Services | 3 | $24B |
|
||
| Consumer Goods | 2 | $93B |
|
||
| Aerospace / Defense | 2 | $47B |
|
||
| Utilities | 2 | $33B |
|
||
Price history
+491.9% since first listed2 events — show timeline
- 2026-06-13 Listed $79,900 WRIST
- 1993-09-15 Sold (Public Records) $13,500 Public Records
Property tax history
+3.7%/yrLatest (2025): $663 · -1.3% YoY. Source: county tax records.
Cash-flow waterfall
monthlySold comps — $/sqft
last 12 mo · ≤1 miLoading sold comps…