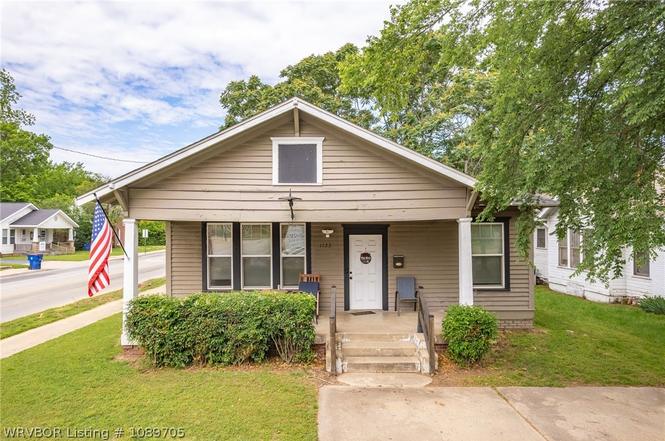
1122 S 21st St · Fort Smith, AR
Flood risk 6/10 · Moderate
- FEMA flood zone
- X (unshaded)
- Chance of flooding over 30 yrs
- 0.68%
- Est. flood insurance / yr
- $507 – $1,088
Fire risk 1/10 · Minimal
- Est. fire insurance / yr
- $1,499 – $2,785
Heat risk 7/10 · Major
- Hot days now (above 111°F)
- 7 days/yr
- Hot days in 30 yrs
- 20 days/yr
Wind risk 2/10 · Minimal
- Chance of severe wind over 30 yrs
- 3.0%
Air-quality risk 2/10 · Minimal
- Unhealthy air days now
- 0 days/yr
- Unhealthy air days in 30 yrs
- 1 days/yr
Risk factors via First Street. Map © Google.
Why this score? — see what drove the C- grade
The composite is a weighted blend of 9 inputs, each scored 0–100. Each bar is that input's sub-score; the figure is the points it added to the 100-point composite (weight × sub-score).
- Cash flow +15.2/30.0
- ARV discount +14.8/15.0
- DSCR +4.7/10.0
- Rent growth +3.6/5.0
- Livability +3.2/5.0
- 1% rule +3.1/10.0
- Schools +3.1/10.0
- Condition / age +2.5/5.0
- Appreciation +0.0/10.0
$124,900
🖨 Deal sheet (PDF) 📄 Offer letter ✓ Due diligence
Listing remarks MLS
Zoned C-2, this property has Residential and Commercial options on a corner lot in the heart of Fort Smith. Less than 1 mile to a major hospital and food options, this trendy home w/ character has so many options available! From wooden floors, large welcoming front porch, and tall ceilings throughout to the new lighting fixtures in July 2020 and brand new windows throughout in June of 2020, come see why this home is the perfect blend of southern hospitality and HGTV inspired updates for all of your needs.
Key facts
- C-2 zoned property
- Detached garage/shop
- Fenced backyard
Tags
Property features AI
Finance
- HOA & community: Curbs and sidewalks in the community
Exterior
- Parking: Concrete parking; Other parking surface
- Security: Smoke detector(s)
- Utilities: Public water; Sewer available; Electricity available; Natural gas available; Cable available; Water available
- Home design: Single-family house; One story
- Construction: Frame construction; Asphalt shingle roof
- Exterior features: Covered porch; Porch; Partial backyard fencing; Outbuilding; Cleared, corner lot; Paved road access
Interior
- Kitchen: Dishwasher; Range
- Flooring: Wood flooring
- Bathrooms: 1 full bathroom
- Heating & cooling: Central heating (natural gas); Central air; Electric cooling; Window unit(s)
- Interior features: Storage; Double-pane windows; Gas starter fireplace
- Laundry & utility: Electric dryer hookup; Gas water heater
Neighborhood map
What this means for you Summary
Snapshot
- This is a 2-bed/1.0-bath single-family listed at $125k.
Deal economics
- At list price, monthly cash flow is $43 ($521/yr) — positive.
- The deal already cash-flows at list — no discount required.
- To meet the 1% rule (rent ≥ 1% of price), the offer needs to be $101k (19.4% below list).
- Recommended offer: $101k (19.4% below list) — sets the bar for 1% rule.
- Cap rate 6.7% vs local median 4.3% in Fort Smith — top-decile yield for the area; either an underpriced asset or a hidden risk that comps aren't pricing in. Stress-test before assuming the spread holds.
Location & tenants
- Location reads 65/100 on livability (#151 in AR) — a middle-class / working-renter tenant base. Strengths: cost of living A+, housing A+, health & safety A+; Watch: crime F, amenities F, commute F.
- Fort Smith School District (urban): math 35% / reading 39% proficiency, ranked #106 of 238 in AR (top 44%) — families likely to look elsewhere, expect single-tenant / working-renter base with shorter leases; 64% free/reduced lunch — lower-income household profile, screen leases tightly.
- Zoned schools: Fairview Elementary School (math 50% / reading 38%, grade F, #164 of 454 statewide, top 37%, 458 students, 77% FRL); William O. Darby Jr. High Sch. (math 20% / reading 30%, grade F, #164 of 201 statewide, top 82%, 700 students, 87% FRL); Northside High School (math 12% / reading 27%, grade F, #239 of 292 statewide, top 85%, 2,433 students, 74% FRL) — zoned schools average 79% FRL vs 64% district-wide (15 pts higher); higher-poverty schools than district average — tighter screening recommended.
- Market conditions: Rents rising fast (+4.4%/yr); 174 active listings in the ZIP; 16 comparable units currently listed for rent nearby; rentals at typical pace (median 22d on market — plan ~3-4 weeks tenant-placement turnaround); lower-income renter base — watch delinquency; 388 units permitted in Sebastian County in 2024 (16 in 5+ unit buildings).
Forward outlook
- Local home prices are declining (-3.0%/yr); year-one equity from $864 of loan paydown is wiped out by about $4k of value loss. Plan a longer hold.
- Sebastian County population projected at +7% by 2050 — modest demand growth; plan on rents tracking national, not racing it.
Negotiation context
- Only 8 days on market — expect competitive offers; lowballing is unlikely to land.
- 4 sale attempts since 12y ago with the ask held roughly flat each time — persistent listings suggest the price (not the market) is what's stuck; bring a comps-based counter.
- Current owner paid $83k; list at $125k implies a 50% gain — meaningful room to come down on a strong offer.
Risks & watch-outs
- Watch-outs: built in 1945 — expect roof / HVAC / electrical / plumbing capex.
- Climate carrying-cost: major flood risk; extreme-heat days projected 7→20/yr by 2055 (HVAC capex compounding) — expect insurance premiums to compound above CPI over the hold.
Questions for the listing agent
- Built in 1945 — when were the roof, HVAC, electrical panel, plumbing, and water heater last replaced?
- Is there a deadline driving the sale (1031 exchange, divorce, estate, relocation)? That informs how much negotiation room exists.
- Schools are D-rated, which usually means shorter tenancies and higher turnover. Who's the typical renter profile here, and what's been the actual vacancy rate?
- Crime grade is F in this area — have there been break-ins, vandalism, or insurance claims at this property in the last 3 years? What carrier currently insures it and at what premium?
- What's the average days-on-market for RENTAL listings here right now (not sales)? A rising rental-DOM trend means longer vacancies and softer asking-rent achievability than the comps imply.
- What's the recent tenant-quality profile in this submarket — average credit score on applications, eviction rate, late-payment / NSF rate, and stable-employment percentage? A property-management company in the area should have these aggregated.
- How much new for-sale + rental construction is in the pipeline within 1–3 miles? Heavy new supply typically softens prices + rents 12–24 months out; constrained supply supports both.
Investment metrics
- 1% rule
- 0.81% ✗
- Cap rate
- 6.71%
- Cash-on-cash
- 1.49%
- DSCR
- 1.07
- GRM
- 10.3
CMA / ARV
- ARV (on-the-fly)
- $148,944
- Comps found
- 12
Show comp detail 12 sales within ~0.75 mi
| Address | Dist | Beds/Ba | Sqft | Sold | Price | $/sf | Match |
|---|---|---|---|---|---|---|---|
| 2203 S M St | 0.18mi | 2/1.0 | 1,208 (-6%) | 2mo | $156,400 | $129 | 80 |
| 2100 S N St | 0.22mi | 2/2.0 | 1,318 (+3%) | 6mo | $169,900 | $129 | 76 |
| 606 S 18th St | 0.42mi | 2/1.5 | 1,298 (+1%) | 3mo | $40,000 | $31 | 74 |
| 2035 S L St | 0.06mi | 3/1.0 (+1) | 1,425 (+11%) | 8mo | $73,700 | $52 | 68 |
| 2307 S M St | 0.23mi | 2/1.0 | 1,424 (+11%) | 7mo | $115,000 | $81 | 65 |
| 1911 S 12th St | 0.70mi | 2/1.0 | 1,314 (+2%) | 3mo | $71,000 | $54 | 61 |
| 2105 S R St | 0.46mi | 2/1.0 | 1,382 (+8%) | 6mo | $161,000 | $116 | 61 |
| 1504 Lexington Ave | 0.49mi | 2/1.0 | 1,176 (-8%) | 4mo | $65,000 | $55 | 60 |
| 218 N 21st St | 0.54mi | 3/1.5 (+1) | 1,311 (+2%) | 7mo | $175,000 | $133 | 59 |
| 1600 S 28th St | 0.57mi | 3/2.0 (+1) | 1,248 (-3%) | 2mo | $67,100 | $54 | 58 |
| 2710 Reeder St | 0.45mi | 2/2.0 | 1,425 (+11%) | 3mo | $192,500 | $135 | 55 |
| 2815 Dodson Ave | 0.51mi | 3/2.5 (+1) | 1,450 (+13%) | 2mo | $212,000 | $146 | 42 |
Match score weights: distance 35% · size 25% · config 20% · recency 20%. Top-matched comps best support the ARV.
Projected returns pro-forma
-3.0% appreciation · 4.37% rent growth · sell at horizon
- IRR
- -12.6%
- Equity multiple
- 0.54×
- Total profit
- $-16,122
- Equity at exit
- $18,623
- IRR
- -1.9%
- Equity multiple
- 0.86×
- Total profit
- $-4,759
- Equity at exit
- $10,799
Cash invested: $34,972 (down + closing). Projections, not guarantees.
Landlord ↔ Tenant lean methodology
- Overall (STATE)
- 92 Strongly Landlord-Friendly
- State Arkansas
- 92 Strongly Landlord-Friendly · R+14
- County
- — inherits STATE
- City
- — inherits STATE
ZIP-level market 72901
- Rents YoY
- 4.4%
- Active inventory
- 174
- Price-to-rent
- 10.3×
Monthly cashflow live
- Estimated rent
- $1,007 high interval (Pro) →
- Mortgage (P&I)
- −$655
- Tax from tax record
- −$45 /mo · $542/yr
- Insurance
- −$52
- HOA
- −$0
- Vacancy / Maint / Mgmt
- −$211
- Net cashflow
- $43
Break-even live
Sensitivity live
| Price | -10% $114 | -5% $79 | +0% $43 | +5% $8 | +10% $-27 |
|---|---|---|---|---|---|
| Rent | -10% $-36 | -5% $4 | +0% $43 | +5% $83 | +10% $123 |
| Rate | -1.0pp $106 | -0.5pp $75 | base $43 | +0.5pp $11 | +1.0pp $-22 |
UW: 25.0% down · 7.5% · 30yr · 1.5% tax · 5.0% vac · 8.0% maint · 8.0% mgmt
Financing live
Cash to close
- Down payment
- $31,225
- Closing costs
- $3,747
- Reserves months
- —
- Total cash needed
- —
Loan-product check · same deal, 3 products live
Conventional
25% down · 7.5% · 30yr
- Down + closing
- —
- Monthly P&I
- —
- Monthly cashflow
- —
- DSCR
- —
- Eligible?
- —
Personal DTI + credit; lowest rate.
DSCR
20% down · 8.5% · 30yr
- Down + closing
- —
- Monthly P&I
- —
- Monthly cashflow
- —
- DSCR
- —
- Eligible?
- —
No personal income docs; deal must DSCR.
Hard money
10% down · 12.0% · 12mo
- Down + closing
- —
- Monthly P&I
- —
- Monthly cashflow
- —
- DSCR
- —
- Eligible?
- —
Short-term bridge; refi at stabilization.
Rent comps 16 comps
| Address | Beds | Baths | Sqft | Rent | $/sqft | DOM | Units | Dist |
|---|---|---|---|---|---|---|---|---|
| 1907 S N St Fort Smith, AR | 2.0 | 1.0 | 1114 | $950 | $0.85 | 22d | 1 | 0.21mi |
| 1307 S 17th St Fort Smith, AR | 3.0 | 1.5 | 1161 | $1,150 | $0.99 | 22d | 1 | 0.24mi |
| 800 S 19th St Fort Smith, AR | 2.0 | 1.0 | 1286 | $1,095 | $0.85 | 4d | 1 | 0.31mi |
| 2820 S O St Fort Smith, AR | 2.0 | 1.5 | 1024 | $875 | $0.85 | 22d | 1 | 0.61mi |
| 1915 S U St Unit A Fort Smith, AR | 2.0 | 2.0 | 900 | $975 | $1.08 | 22d | 1 | 0.63mi |
| 2200 S 17th St Unit D Fort Smith, AR | 3.0 | 2.0 | 1123 | $975 | $0.87 | 22d | 1 | 0.71mi |
| 501 N May Ave Fort Smith, AR | 2.0 | 1.0 | 1022 | $825 | $0.81 | 22d | 1 | 0.74mi |
| 3014 Presley St Fort Smith, AR | 1.0–2.0 | 1.0–1.5 | 782 | $925 | $1.18 | 14d | 4 | 0.76mi |
| 3014 Presley St Unit FB44 Fort Smith, AR | 2.0 | 1.5 | 1040 | $925 | $0.89 | 22d | 1 | 0.76mi |
| 2307 S 23rd St Fort Smith, AR | 3.0 | 2.5 | 1356 | $1,595 | $1.18 | 22d | 1 | 0.76mi |
| 3101 Park Ave Fort Smith, AR | 3.0 | 2.0 | 1634 | $1,650 | $1.01 | 14d | 1 | 0.84mi |
| 2800 Wharton Cir Unit 2323 Fort Smith, AR | 2.0 | 2.0 | 1240 | $925 | $0.75 | 14d | 1 | 0.99mi |
| 3500 S N St Fort Smith, AR | 1.0–2.0 | 1.0–1.5 | 834 | $935 | $1.12 | 22d | 1 | 0.99mi |
| 101 N 11th St Unit 112 Fort Smith, AR | 2.0 | 2.0 | 1040 | $1,240 | $1.19 | 22d | 1 | 1.07mi |
| 101 N 11th St Fort Smith, AR | 1.0–2.0 | 1.0–2.0 | 806 | $1,115 | $1.38 | 4d | 9 | 1.08mi |
| 3906 S N St Unit 3904 Fort Smith, AR | 2.0 | 1.5 | 1024 | $800 | $0.78 | 22d | 1 | 1.24mi |
Listing history 8 events
-
2026-06-19days on market $124,900 Active 8 DOM
-
2026-06-18days on market $124,900 Active 7 DOM
-
2026-06-17days on market $124,900 Active 6 DOM
-
2026-06-16days on market $124,900 Active 5 DOM
-
2026-06-15days on market $124,900 Active 4 DOM
-
2026-06-14days on market $124,900 Active 2 DOM
-
2026-06-13remarks 699-char remark
-
2026-06-13$124,900 Active 1 DOM
ⓘ Source: listings_history table (triggers on properties + properties_extension) + one-shot
backfill from property_details.listing_events for pre-trigger history.
Tax reassessment forecast AR · Resets to sale price
- Current annual tax
- $542 · $45/mo
- Projected year-2 tax
- $799 · $67/mo
- Expected delta
- +$257/yr (+$21/mo · 47.4%)
ⓘ Screening estimate from a state-policy table — verify with the county assessor before closing.
Climate risk First Street
- Flood 6/10 Major FEMA zone X (unshaded) · 68% chance over 30 yrs
- Wildfire 1/10 Low
- Heat 7/10 Severe 7 d/yr ≥111°F today · 20 d/yr by 30 yrs out
- Wind 2/10 Low 3% chance of damaging wind over 30 yrs
- Air quality 2/10 Low 0 unhealthy d/yr today · 1 by 30 yrs out
Nearby sold comps map
Loading sold comps map…
Walkable amenities ~0.75 mi
Loading nearby amenities…
Taxation est. · year 1
- Rental income
- $12,085
- − Mortgage interest
- −$6,996
- − Property taxes
- −$542
- − Insurance
- −$624
- − Repairs & maintenance
- −$967
- − Management
- −$967
- − Depreciation
- −$3,633
- Taxable loss
- −$1,645
- Est. tax savings @ 24.0%
- +$395
- After-tax cash flow
- $915/yr
For passive investors: Depreciation is non-cash, so a rental often shows a tax loss while cash-flowing — sheltering income. Rental losses are passive: they offset passive income freely, and up to $25,000/yr can offset ordinary (W-2) income if you actively participate and your MAGI is under $100k (phasing out to $0 by $150k); unused losses carry forward. On sale, claimed depreciation is recaptured at up to 25%, and gains may owe capital-gains tax (a 1031 exchange can defer both). Figures are a year-1 estimate at your 24.0% rate — not tax advice; consult a CPA.
Schools (NCES district)
- District
- Fort Smith School District
- NCES district ID
- 0506330
- Math proficiency
- 35% ▼ -11.00%
- Reading proficiency
- 39% ▼ -7.00%
- Median HH income
- $36,066
- Composite
- 30.66/100
- National rank
- #6183
- State rank
- #106 of 238 in AR
Livability — Fort Smith
- Score
- 65/100
- State rank
- #151
- US rank
- #13185
Category grades
Schools grade is shown separately in the Schools card above.
Census & demographics
- Census place
- Fort Smith, AR
- County
- Sebastian County · 99,312 people
- City population
- 94,356
- Metro
- Fort Smith, AR-OK
- Population (ZIP)
- 19,819
- Household income
- $42,851
- Rent vs Own
- Severe rent burden
- 1117.0
Population outlook (Sebastian County) Hauer SSP2
- Today (2025)
- 133,992 people
- By 2030
- 136,620 · +2.0%
- By 2040
- 140,832 · +5.1%
- By 2050
- 143,301 · +6.9%
- By 2075
- 147,964 · +10.4%
- By 2100
- 145,848 · +8.8%
Race, ethnicity, and origin ACS 2023
- Neighborhood character
- Diverse neighborhood (Simpson 0.60)
- Race & ethnicity
- White 60% Hispanic / Latino 17% Two or more races 12% Black 10% Asian 2%
- Hispanic origin (detail)
- Mexican 11% Puerto Rican 1%
- Common ancestry
- Slovak 2% Lithuanian 2% Italian 1%
- Foreign-born
- 9% · Canada, Vietnam, Guatemala
- Languages at home
- 83% English-only · Spanish 14% Other Asian/Pacific 1% Vietnamese 1%
Political lean MEDSL · Sebastian
- 2024 margin
- Solid R (+37.5) · D 30.0% · R 67.6% · Other 2.4%
- 2008→2024 swing
- -2.9pp toward R · 2008: -34.6pp · 2024: -37.5pp
- All cycles
- 2024: R+37.5 2020: R+35.5 2016: R+38.1 2012: R+37.1 2008: R+34.6
Not yet ingested
- Civics
- —
Market trends
- HPI YoY
- ▼ -173.82%
- Current HPI
- 172.3777
- Rent YoY
- ▲ 4.37%
- Metro
- Fort Smith, AR-OK
- State GDP YoY
- ▲ 3.80%
- F500 in state
- 10
Industry mix (Fortune 500 HQ in AR)
| Industry | F500 HQs | Revenue |
|---|---|---|
| Retail | 1 | $681B |
|
||
| Food / Agriculture | 1 | $53B |
|
||
| Retail / Energy | 1 | $22B |
|
||
| Transportation / Logistics | 1 | $12B |
|
||
| Energy | 1 | $4B |
|
||
Price history
+31.5% since first listed9 events — show timeline
- 2026-06-11 Listed $124,900 WRVBOR
- 2025-05-21 Listed $124,900 WRVBOR
- 2021-12-31 Price Changed $700 RENT.
- 2020-08-17 Sold (MLS) $83,000 WRVBOR
- 2020-07-12 Listed $95,000 WRVBOR
- 2015-08-04 Sold (Public Records) $33,000 Public Records
- 2014-11-10 Sold (MLS) $38,000 WRVBOR
- 2014-03-10 Listed $45,000 WRVBOR
- 2006-01-05 Sold (Public Records) $95,000 Public Records
Property tax history
+1.1%/yrLatest (2025): $542 · +9.0% YoY. Source: county tax records.
Cash-flow waterfall
monthlySold comps — $/sqft
last 12 mo · ≤1 miLoading sold comps…