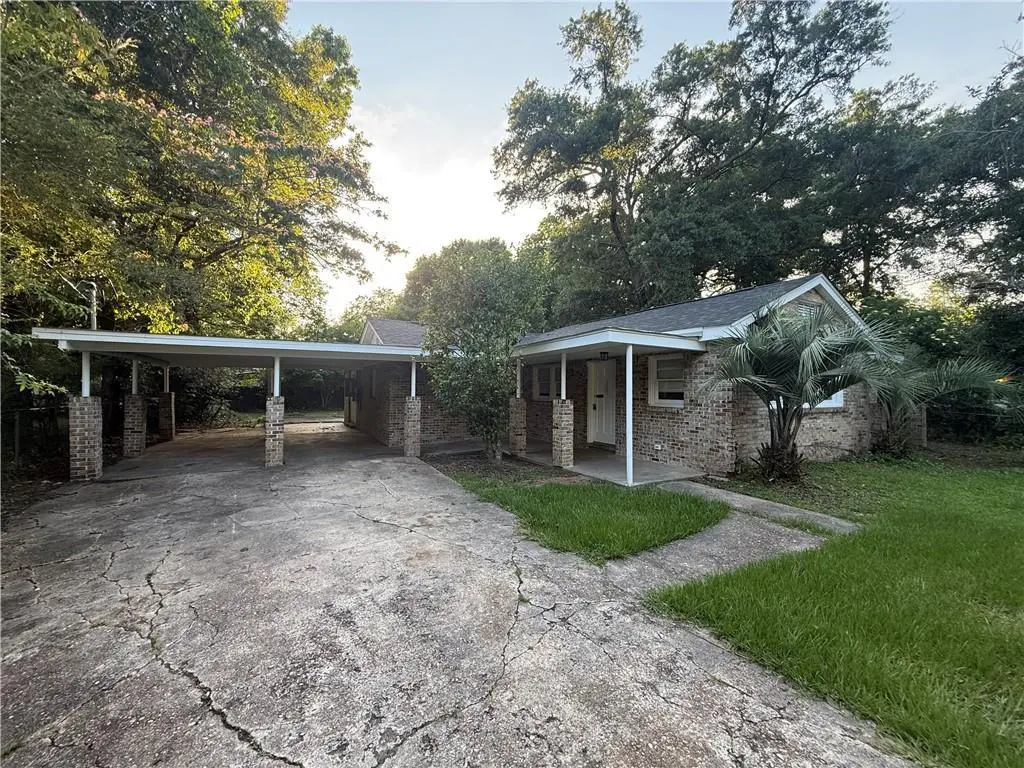
666 Farnell Ln · Mobile, AL
Flood risk 1/10 · Minimal
- FEMA flood zone
- X (unshaded)
- Chance of flooding over 30 yrs
- 0.0%
- Est. flood insurance / yr
- $507 – $1,088
Fire risk 1/10 · Minimal
- Est. fire insurance / yr
- $916 – $1,700
Heat risk 9/10 · Severe
- Hot days now (above 105°F)
- 7 days/yr
- Hot days in 30 yrs
- 20 days/yr
Wind risk 9/10 · Severe
- Chance of severe wind over 30 yrs
- 99.0%
Air-quality risk 2/10 · Minimal
- Unhealthy air days now
- 1 days/yr
- Unhealthy air days in 30 yrs
- 1 days/yr
Risk factors via First Street. Map © Google.
Why this score? — see what drove the B grade
The composite is a weighted blend of 9 inputs, each scored 0–100. Each bar is that input's sub-score; the figure is the points it added to the 100-point composite (weight × sub-score).
- Cash flow +28.3/30.0
- ARV discount +15.0/15.0
- DSCR +10.0/10.0
- 1% rule +7.0/10.0
- Rent growth +3.8/5.0
- Livability +3.8/5.0
- Condition / age +2.5/5.0
- Schools +2.3/10.0
- Appreciation +0.0/10.0
$134,900
🖨 Deal sheet (PDF) 📄 Offer letter ✓ Due diligence
Listing remarks
Welcome to 666 Farnell Lane! This well-maintained 4-bedroom, 1.5-bath home is an excellent opportunity for both investors and owner-occupants. Designed for easy, low-maintenance living, the property features a durable brick exterior, slab foundation, brand-new roof, and tile flooring throughout. Inside, you'll find two separate living areas, providing plenty of space for relaxing, entertaining, or creating a home office. The kitchen offers abundant cabinet storage and includes a gas stove for cooking convenience. Outside, the home features a double carport with ample parking, as well as both a covered front porch and covered back patio—perfect for enjoying the outdoors year-round. Con
Key facts
- Slab foundation
- Brick exterior
- Brand new roof
Tags
Property features AI
Exterior
- Parking: Carport (2 spaces)
- Utilities: Electricity available; Natural gas available; Public sewer
- Home design: Single-family residence; Residential property
- Construction: Shingle roof; Slab foundation
- Exterior features: Storage; Back yard fencing; View present
Interior
- Kitchen: Gas range
- Bedrooms: 4 bedrooms
- Bathrooms: 1 full bathroom; 1 half bathroom
- Heating & cooling: Central heating; Central air; Ceiling fans
- Interior features: Walk-in closets; Dining L layout; Kitchen with additional cabinets; No fireplace; No basement
Neighborhood map
What this means for you Summary
Snapshot
- This is a 4-bed/1.5-bath single-family listed at $135k.
Deal economics
- At list price, monthly cash flow is $434 ($5k/yr) — positive.
- The deal already cash-flows at list — no discount required.
- Meets the 1% rule at list price ($2k rent vs $135k).
- Cap rate 10.2% vs local median 4.9% in Mobile — top-decile yield for the area; either an underpriced asset or a hidden risk that comps aren't pricing in. Stress-test before assuming the spread holds.
Location & tenants
- Location reads 75/100 on livability (#20 in AL, #4,262 nationally) — a middle-class / working-renter tenant base. Strengths: commute A+, cost of living A+, housing A+; Watch: crime F, employment D-.
- Mobile County (urban): math 15% / reading 39% proficiency, ranked #81 of 129 in AL (top 63%) — low school quality limits family demand, transient renter base, plan for 1-2y turnover; 67% free/reduced lunch — lower-income household profile, screen leases tightly.
- Zoned schools: Morningside Elementary School (math 9% / reading 29%, grade F, #478 of 627 statewide, top 76%, 455 students, 98% FRL); Murphy High School (math 10% / reading 19%, grade F, #220 of 305 statewide, top 77%, 1,254 students, 66% FRL).
- Market conditions: Rents rising fast (+5.1%/yr); 175 active listings in the ZIP; 19 comparable units currently listed for rent nearby; rentals at typical pace (median 23d on market — plan ~3-4 weeks tenant-placement turnaround); 42% of comp listings sitting > 30 days — soft ceiling on asking rent; 1,678 units permitted in Mobile County in 2024 (264 in 5+ unit buildings).
- This rent runs 38% of the median local income ($51k/yr) — at the standard rent-burdened threshold; future hikes will face affordability resistance.
Forward outlook
- Local home prices are declining (-3.0%/yr); year-one equity from $933 of loan paydown is wiped out by about $4k of value loss. Plan a longer hold.
- Mobile County population projected to shrink 8% by 2050 — rents likely to lag national; underwrite the cash flow, not the appreciation.
- At projected returns (-3.0% appreciation + 5.1% rent growth), your $38k cash investment doubles in ~8 years — after that, you're playing with house money.
Negotiation context
- Only 2 days on market — expect competitive offers; lowballing is unlikely to land.
Risks & watch-outs
- Climate carrying-cost: severe wind risk, 99% chance of damaging wind over 30y; extreme-heat days projected 7→20/yr by 2055 (HVAC capex compounding) — expect insurance premiums to compound above CPI over the hold.
Questions for the listing agent
- Is there a deadline driving the sale (1031 exchange, divorce, estate, relocation)? That informs how much negotiation room exists.
- Schools are D-rated, which usually means shorter tenancies and higher turnover. Who's the typical renter profile here, and what's been the actual vacancy rate?
- Crime grade is F in this area — have there been break-ins, vandalism, or insurance claims at this property in the last 3 years? What carrier currently insures it and at what premium?
- What's the average days-on-market for RENTAL listings here right now (not sales)? A rising rental-DOM trend means longer vacancies and softer asking-rent achievability than the comps imply.
- What's the recent tenant-quality profile in this submarket — average credit score on applications, eviction rate, late-payment / NSF rate, and stable-employment percentage? A property-management company in the area should have these aggregated.
- How much new for-sale + rental construction is in the pipeline within 1–3 miles? Heavy new supply typically softens prices + rents 12–24 months out; constrained supply supports both.
Investment metrics
- 1% rule
- 1.20% ✓
- Cap rate
- 10.16%
- Cash-on-cash
- 13.80%
- DSCR
- 1.61
- GRM
- 6.9
CMA / ARV
- ARV (on-the-fly)
- $217,750
- Comps found
- 12
Show comp detail 12 sales within ~0.75 mi
| Address | Dist | Beds/Ba | Sqft | Sold | Price | $/sf | Match |
|---|---|---|---|---|---|---|---|
| 3006 Pleasant Valley Rd | 0.22mi | 3/2.0 (-1) | 1,613 (-1%) | 2mo | $110,000 | $68 | 80 |
| 2755 Marcelus Dr | 0.44mi | 3/2.0 (-1) | 1,694 (+4%) | 0mo | $210,000 | $124 | 65 |
| 2758 Brookwood Dr | 0.55mi | 3/2.0 (-1) | 1,678 (+3%) | 3mo | $230,000 | $137 | 60 |
| 509 W Barksdale Dr | 0.45mi | 3/2.0 (-1) | 1,550 (-5%) | 6mo | $250,000 | $161 | 60 |
| 2768 Brookwood Dr | 0.50mi | 3/1.5 (-1) | 1,782 (+10%) | 1mo | $253,000 | $142 | 55 |
| 2755 Kreitner St | 0.50mi | 3/2.0 (-1) | 1,764 (+9%) | 1mo | $229,400 | $130 | 55 |
| 2905 Cottage Hill Rd | 0.36mi | 3/2.0 (-1) | 1,450 (-11%) | 7mo | $188,000 | $130 | 52 |
| 2904 Cottage Hill Rd | 0.40mi | 3/2.0 (-1) | 1,392 (-14%) | 0mo | $124,500 | $89 | 50 |
| 417 Gordonwood Ct | 0.46mi | 3/2.0 (-1) | 1,789 (+10%) | 7mo | $239,750 | $134 | 49 |
| 868 Grant Park Dr | 0.69mi | 3/2.0 (-1) | 1,734 (+7%) | 1mo | $319,500 | $184 | 48 |
| 2762 Marcelus Dr | 0.40mi | 3/2.0 (-1) | 1,846 (+14%) | 5mo | $225,000 | $122 | 47 |
| 919 Grant Park Dr | 0.60mi | 3/2.0 (-1) | 1,846 (+14%) | 6mo | $290,000 | $157 | 37 |
Match score weights: distance 35% · size 25% · config 20% · recency 20%. Top-matched comps best support the ARV.
Projected returns pro-forma
-3.0% appreciation · 5.06% rent growth · sell at horizon
- IRR
- 6.1%
- Equity multiple
- 1.24×
- Total profit
- $9,212
- Equity at exit
- $20,114
- IRR
- 17.2%
- Equity multiple
- 2.54×
- Total profit
- $58,237
- Equity at exit
- $11,664
Cash invested: $37,772 (down + closing). Projections, not guarantees.
Landlord ↔ Tenant lean methodology
- Overall (STATE)
- 90 Strongly Landlord-Friendly
- State Alabama
- 90 Strongly Landlord-Friendly · R+15
- County
- — inherits STATE
- City
- — inherits STATE
ZIP-level market 36606
- Rents YoY
- 5.1%
- Active inventory
- 175
- Price-to-rent
- 6.9×
Monthly cashflow live
- Estimated rent
- $1,624 high interval (Pro) →
- Mortgage (P&I)
- −$707
- Tax from tax record
- −$85 /mo · $1,022/yr
- Insurance
- −$56
- HOA
- −$0
- Vacancy / Maint / Mgmt
- −$341
- Net cashflow
- $434
Break-even live
Sensitivity live
| Price | -10% $511 | -5% $473 | +0% $434 | +5% $396 | +10% $358 |
|---|---|---|---|---|---|
| Rent | -10% $306 | -5% $370 | +0% $434 | +5% $498 | +10% $563 |
| Rate | -1.0pp $502 | -0.5pp $469 | base $434 | +0.5pp $399 | +1.0pp $364 |
UW: 25.0% down · 7.5% · 30yr · 1.5% tax · 5.0% vac · 8.0% maint · 8.0% mgmt
Financing live
Cash to close
- Down payment
- $33,725
- Closing costs
- $4,047
- Reserves months
- —
- Total cash needed
- —
Loan-product check · same deal, 3 products live
Conventional
25% down · 7.5% · 30yr
- Down + closing
- —
- Monthly P&I
- —
- Monthly cashflow
- —
- DSCR
- —
- Eligible?
- —
Personal DTI + credit; lowest rate.
DSCR
20% down · 8.5% · 30yr
- Down + closing
- —
- Monthly P&I
- —
- Monthly cashflow
- —
- DSCR
- —
- Eligible?
- —
No personal income docs; deal must DSCR.
Hard money
10% down · 12.0% · 12mo
- Down + closing
- —
- Monthly P&I
- —
- Monthly cashflow
- —
- DSCR
- —
- Eligible?
- —
Short-term bridge; refi at stabilization.
Rent comps 19 comps
| Address | Beds | Baths | Sqft | Rent | $/sqft | DOM | Units | Dist |
|---|---|---|---|---|---|---|---|---|
| 916 Delmar Dr Mobile, AL | 3.0 | 1.0 | 1100 | $1,400 | $1.27 | 15d | 1 | 0.48mi |
| 955 Cloverdale Dr Mobile, AL | 3.0 | 1.5 | 1128 | $1,125 | $1.00 | 45d | 1 | 0.73mi |
| 315 Hadrian St Mobile, AL | 3.0 | 2.0 | 1843 | $1,800 | $0.98 | 45d | 1 | 0.77mi |
| 418 Durande Dr Mobile, AL | 3.0 | 2.0 | 1456 | $1,350 | $0.93 | 15d | 1 | 0.78mi |
| 713 Iris Ave Mobile, AL | 3.0 | 1.0 | 1617 | $1,300 | $0.80 | 22d | 1 | 0.91mi |
| 2859 Brierwood Dr Mobile, AL | 3.0 | 1.0 | 1057 | $1,500 | $1.42 | 15d | 1 | 0.92mi |
| 3661 Airport Blvd Mobile, AL | 1.0–3.0 | 1.0–2.5 | 1187 | $1,621 | $1.37 | 15d | 24 | 1.03mi |
| 2861 Ralston Rd Mobile, AL | 3.0 | 2.0 | 1617 | $1,650 | $1.02 | 45d | 1 | 1.05mi |
| 817 Hawkins St Mobile, AL | 3.0 | 1.0 | 1217 | $1,200 | $0.99 | 45d | 1 | 1.10mi |
| 2861 Potter Dr Unit 1043844P Mobile, AL | 3.0 | 2.0 | 1496 | $2,492 | $1.67 | 22d | 1 | 1.11mi |
| 2863 Potter Dr Unit 1043693P Mobile, AL | 4.0 | 2.0 | 1496 | $3,049 | $2.04 | 15d | 1 | 1.11mi |
| 3060 Emogene St Mobile, AL | 3.0 | 1.0 | 1200 | $1,400 | $1.17 | 15d | 1 | 1.26mi |
| 150 Dunn Ave Mobile, AL | 3.0 | 2.0 | 1455 | $1,250 | $0.86 | 22d | 1 | 1.27mi |
| 1030 Montlimar Dr Mobile, AL | 1.0–3.0 | 1.0–2.0 | 997 | $1,509 | $1.51 | 15d | 17 | 1.27mi |
| 615 Mohawk St Mobile, AL | 3.0 | 1.0 | 1172 | $1,500 | $1.28 | 45d | 1 | 1.34mi |
| 618 Clarke St Mobile, AL | 3.0 | 1.0 | 1427 | $1,200 | $0.84 | 45d | 1 | 1.35mi |
| 2068 Victory Ct Mobile, AL | 4.0 | 1.0 | 1259 | $1,225 | $0.97 | 45d | 1 | 1.44mi |
| 2507 Taylor Ave Mobile, AL | 3.0 | 1.0 | 1230 | $1,495 | $1.22 | 15d | 1 | 1.47mi |
| 1411 Greenbrier Dr Mobile, AL | 3.0 | 1.0 | 1069 | $995 | $0.93 | 45d | 1 | 1.48mi |
Listing history 3 events
-
2026-06-08status $134,900 Pending 2 DOM
-
2026-06-07remarks 693-char remark
-
2026-06-07$134,900 Active 2 DOM
ⓘ Source: listings_history table (triggers on properties + properties_extension) + one-shot
backfill from property_details.listing_events for pre-trigger history.
Tax reassessment forecast AL · Resets to sale price
- Current annual tax
- $1,022 · $85/mo
- Projected year-2 tax
- $1,022 · $85/mo
- Expected delta
- $0/yr ($0/mo · 0.0%)
ⓘ Screening estimate from a state-policy table — verify with the county assessor before closing.
Climate risk First Street
- Flood 1/10 Low FEMA zone X (unshaded) · 0% chance over 30 yrs
- Wildfire 1/10 Low
- Heat 9/10 Extreme 7 d/yr ≥105°F today · 20 d/yr by 30 yrs out
- Wind 9/10 Extreme 99% chance of damaging wind over 30 yrs
- Air quality 2/10 Low 1 unhealthy d/yr today · 1 by 30 yrs out
Nearby sold comps map
Loading sold comps map…
Walkable amenities ~0.75 mi
Loading nearby amenities…
Taxation est. · year 1
- Rental income
- $19,491
- − Mortgage interest
- −$7,556
- − Property taxes
- −$1,022
- − Insurance
- −$674
- − Repairs & maintenance
- −$1,559
- − Management
- −$1,559
- − Depreciation
- −$3,924
- Taxable income
- $3,195
- Est. tax owed @ 24.0%
- −$767
- After-tax cash flow
- $4,445/yr
For passive investors: Depreciation is non-cash, so a rental often shows a tax loss while cash-flowing — sheltering income. Rental losses are passive: they offset passive income freely, and up to $25,000/yr can offset ordinary (W-2) income if you actively participate and your MAGI is under $100k (phasing out to $0 by $150k); unused losses carry forward. On sale, claimed depreciation is recaptured at up to 25%, and gains may owe capital-gains tax (a 1031 exchange can defer both). Figures are a year-1 estimate at your 24.0% rate — not tax advice; consult a CPA.
Schools (NCES district)
- District
- Mobile County
- NCES district ID
- 0102370
- Math proficiency
- 15% ▼ -28.00%
- Reading proficiency
- 39% ▬ 0.00%
- Median HH income
- $42,455
- Composite
- 22.9/100
- National rank
- #8002
- State rank
- #81 of 129 in AL
Livability — Mobile
- Score
- 75/100
- State rank
- #20
- US rank
- #4262
Category grades
Schools grade is shown separately in the Schools card above.
Census & demographics
- Census place
- Mobile, AL
- County
- Mobile County · 246,577 people
- City population
- 205,729
- Metro
- Mobile, AL
- Population (ZIP)
- 18,728
- Household income
- $51,303
- Rent vs Own
- Severe rent burden
- 999.0
Population outlook (Mobile County) Hauer SSP2
- Today (2025)
- 415,303 people
- By 2030
- 411,755 · -0.9%
- By 2040
- 399,670 · -3.8%
- By 2050
- 382,616 · -7.9%
- By 2075
- 337,353 · -18.8%
- By 2100
- 283,391 · -31.8%
Race, ethnicity, and origin ACS 2023
- Neighborhood character
- Majority Black (56%)
- Race & ethnicity
- Black 56% White 37% Two or more races 5% Hispanic / Latino 4%
- Common ancestry
- Italian 2% Scottish 2% Lithuanian 1%
- Foreign-born
- 3% · Canada
- Languages at home
- 96% English-only · Spanish 3%
Political lean MEDSL · Mobile
- 2024 margin
- R (+16.4) · D 41.3% · R 57.7%
- 2008→2024 swing
- -7.7pp toward R · 2008: -8.7pp · 2024: -16.4pp
- All cycles
- 2024: R+16.4 2020: R+11.9 2016: R+13.9 2012: R+9.3 2008: R+8.7
Not yet ingested
- Civics
- —
Market trends
- HPI YoY
- ▼ -232.19%
- Current HPI
- 145.9025
- Rent YoY
- ▲ 5.06%
- Metro
- Mobile, AL
- State GDP YoY
- ▲ 2.94%
- F500 in state
- 4
Industry mix (Fortune 500 HQ in AL)
| Industry | F500 HQs | Revenue |
|---|---|---|
| Financial Services | 1 | $8B |
|
||
| Healthcare | 1 | $5B |
|
||
Price history
+87.4% since first listed4 events — show timeline
- 2026-06-07 Pending — GCMLS AL
- 2026-06-06 Listed $134,900 GCMLS AL
- 2021-12-09 Sold (Public Records) $210,000 Public Records
- 2012-02-23 Sold (Public Records) $72,000 Public Records
Property tax history
+2.0%/yrLatest (2025): $1,022 · +0.0% YoY. Source: county tax records.
Cash-flow waterfall
monthlySold comps — $/sqft
last 12 mo · ≤1 miLoading sold comps…