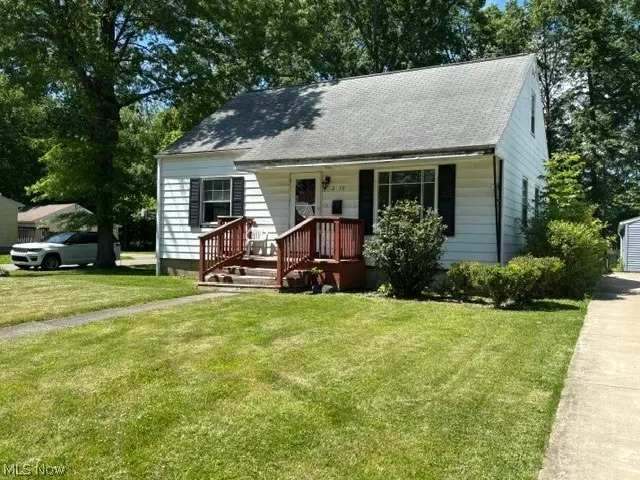
2378 Linda Dr NW · Warren, OH
Flood risk 1/10 · Minimal
- FEMA flood zone
- X (unshaded)
- Chance of flooding over 30 yrs
- 0.0%
- Est. flood insurance / yr
- $473 – $860
Fire risk 1/10 · Minimal
- Est. fire insurance / yr
- $713 – $1,323
Heat risk 3/10 · Minor
- Hot days now (above 97°F)
- 7 days/yr
- Hot days in 30 yrs
- 17 days/yr
Wind risk 1/10 · Minimal
- Chance of severe wind over 30 yrs
- —
Air-quality risk 3/10 · Minor
- Unhealthy air days now
- 1 days/yr
- Unhealthy air days in 30 yrs
- 4 days/yr
Risk factors via First Street. Map © Google.
Why this score? — see what drove the B grade
The composite is a weighted blend of 9 inputs, each scored 0–100. Each bar is that input's sub-score; the figure is the points it added to the 100-point composite (weight × sub-score).
- Cash flow +30.0/30.0
- 1% rule +10.0/10.0
- DSCR +10.0/10.0
- ARV discount +7.5/15.0
- Appreciation +4.4/10.0
- Livability +3.7/5.0
- Rent growth +2.5/5.0
- Condition / age +2.5/5.0
- Schools +2.2/10.0
$49,900
🖨 Deal sheet 📄 Offer letter ✓ Due diligence
Listing remarks
Great opportunity to own this 4-bedroom cape-cod on a nice corner lot. There are 2 first floor bedrooms and first floor bath. Kitchen, dining and living room. Hardwood floors. Furnace new in 2021. 1,248 square feet of living space. 2 car detached garage. Full basement. Wonderful investment! Bring your investors! Come check it out!
Key facts
- 7,248 sq ft lot
- 2 garage spots
- Built 1953
Property features AI
Exterior
- Parking: Driveway; 2-car garage
- Utilities: Public water; Public sewer
- Home design: Fixer condition; Above-grade finished living area approximately 1,248
- Construction: Built (year per public records); Asphalt/fiberglass roof
- Exterior features: Aluminum siding
Interior
- Kitchen: Range; Refrigerator
- Bedrooms: 2 main-level bedrooms
- Bathrooms: 1 full bathroom (main level)
- Heating & cooling: Forced air gas heating; Ceiling fan(s) for cooling
- Interior features: Unfinished basement
- Laundry & utility: Laundry on lower level
Neighborhood map
What this means for you Summary
Snapshot
- This is a 3-bed/1.0-bath single-family listed at $50k.
Deal economics
- At list price, monthly cash flow is $413 ($5k/yr) — positive.
- The deal already cash-flows at list — no discount required.
- Meets the 1% rule at list price ($973 rent vs $50k).
- Cap rate 16.2% vs local median 6.0% in Warren — top-decile yield for the area; either an underpriced asset or a hidden risk that comps aren't pricing in. Stress-test before assuming the spread holds.
Location & tenants
- Location reads 73/100 on livability (#312 in OH) — a middle-class / working-renter tenant base. Strengths: cost of living A+, health & safety A+, housing A; Watch: crime D-, commute F, employment F.
- Warren City (urban): math 22% / reading 32% proficiency, ranked #599 of 656 in OH (top 91%) — low school quality limits family demand, transient renter base, plan for 1-2y turnover; 75% free/reduced lunch — lower-income household profile, screen leases tightly.
- Market conditions: 42 active listings in the ZIP; 3 comparable units currently listed for rent nearby; rentals leasing fast (median 14d on market — plan ~1-2 weeks tenant-placement turnaround); lower-income renter base — watch delinquency; 129 units permitted in Trumbull County in 2024 (0 in 5+ unit buildings).
- This rent runs 35% of the median local income ($34k/yr) — at the standard rent-burdened threshold; future hikes will face affordability resistance.
Forward outlook
- Local home prices are declining (-1.1%/yr); year-one equity from $345 of loan paydown is wiped out by about $568 of value loss. Plan a longer hold.
- Trumbull County population projected at -22% by 2050 — secular population decline; favor cash flow + early exit over multi-decade hold.
- At projected returns (-1.1% appreciation + 3.0% rent growth), your $14k cash investment doubles in ~3 years — after that, you're playing with house money.
Negotiation context
- Only 3 days on market — expect competitive offers; lowballing is unlikely to land.
Risks & watch-outs
- Watch-outs: built in 1953 — expect roof / HVAC / electrical / plumbing capex.
Questions for the listing agent
- Built in 1953 — when were the roof, HVAC, electrical panel, plumbing, and water heater last replaced?
- Is there a deadline driving the sale (1031 exchange, divorce, estate, relocation)? That informs how much negotiation room exists.
- Crime grade is D in this area — have there been break-ins, vandalism, or insurance claims at this property in the last 3 years? What carrier currently insures it and at what premium?
- What's the average days-on-market for RENTAL listings here right now (not sales)? A rising rental-DOM trend means longer vacancies and softer asking-rent achievability than the comps imply.
- What's the recent tenant-quality profile in this submarket — average credit score on applications, eviction rate, late-payment / NSF rate, and stable-employment percentage? A property-management company in the area should have these aggregated.
- How much new for-sale + rental construction is in the pipeline within 1–3 miles? Heavy new supply typically softens prices + rents 12–24 months out; constrained supply supports both.
Investment metrics
- 1% rule
- 1.95% ✓
- Cap rate
- 16.21%
- Cash-on-cash
- 35.43%
- DSCR
- 2.58
- GRM
- 4.3
CMA / ARV
- ARV (on-the-fly)
- $143,520
- Comps found
- 12
Show comp detail 12 sales within ~0.75 mi
| Address | Dist | Beds/Ba | Sqft | Sold | Price | $/sf | Match |
|---|---|---|---|---|---|---|---|
| 1935 Northfield Ave NW | 0.31mi | 3/1.5 | 1,280 (+3%) | 0mo | $120,900 | $94 | 79 |
| 1424 Clemmens Ave NW | 0.45mi | 3/1.0 | 1,241 (-1%) | 1mo | $155,000 | $125 | 77 |
| 1722 Bradford St NW | 0.56mi | 3/1.0 | 1,200 (-4%) | 2mo | $114,000 | $95 | 66 |
| 1737 Westwood Dr NW | 0.63mi | 3/2.5 | 1,240 (-1%) | 1mo | $159,800 | $129 | 63 |
| 2748 Clearwater Dr NW | 0.38mi | 3/1.0 | 1,096 (-12%) | 4mo | $126,000 | $115 | 59 |
| 1731 Denison Ave NW | 0.36mi | 4/1.0 (+1) | 1,152 (-8%) | 10mo | $100,000 | $87 | 57 |
| 1727 Lexington Ave NW | 0.29mi | 3/1.5 | 1,064 (-15%) | 6mo | $125,000 | $117 | 55 |
| 1736 Westwood Dr NW | 0.66mi | 4/1.5 (+1) | 1,326 (+6%) | 4mo | $148,500 | $112 | 49 |
| 2476 Beal St NW | 0.67mi | 3/1.5 | 1,358 (+9%) | 5mo | $86,500 | $64 | 48 |
| 1130 Riverview St NW | 0.75mi | 3/2.0 | 1,152 (-8%) | 0mo | $168,000 | $146 | 48 |
| 1639 Oakdale Dr | 0.64mi | 3/1.5 | 1,400 (+12%) | 4mo | $209,000 | $149 | 45 |
| 1533 Dilley Rd NW | 0.62mi | 3/1.0 | 1,120 (-10%) | 12mo | $25,000 | $22 | 44 |
Match score weights: distance 35% · size 25% · config 20% · recency 20%. Top-matched comps best support the ARV.
Projected returns pro-forma
-1.14% appreciation · 3.0% rent growth · sell at horizon
- IRR
- 34.3%
- Equity multiple
- 2.59×
- Total profit
- $22,226
- Equity at exit
- $11,713
- IRR
- 39.0%
- Equity multiple
- 5.08×
- Total profit
- $57,019
- Equity at exit
- $12,018
Cash invested: $13,972 (down + closing). Projections, not guarantees.
Landlord ↔ Tenant lean methodology
- Overall (STATE)
- 73 Landlord-Friendly
- State Ohio
- 73 Landlord-Friendly · R+6
- County
- — inherits STATE
- City
- — inherits STATE
ZIP-level market 44485
- Home prices YoY
- -0.5%
- Active inventory
- 42
- Price-to-rent
- 4.3×
Monthly cashflow live
- Estimated rent
- $973 medium interval (Pro) →
- Mortgage (P&I)
- −$262
- Tax from tax record
- −$74 /mo · $889/yr
- Insurance
- −$21
- HOA
- −$0
- Vacancy / Maint / Mgmt
- −$204
- Net cashflow
- $413
Break-even live
UW: 25.0% down · 7.5% · 30yr · 1.5% tax · 5.0% vac · 8.0% maint · 8.0% mgmt
Financing live
Cash to close
- Down payment
- $12,475
- Closing costs
- $1,497
- Reserves months
- —
- Total cash needed
- —
Loan-product check · same deal, 3 products live
Conventional
25% down · 7.5% · 30yr
- Down + closing
- —
- Monthly P&I
- —
- Monthly cashflow
- —
- DSCR
- —
- Eligible?
- —
Personal DTI + credit; lowest rate.
DSCR
20% down · 8.5% · 30yr
- Down + closing
- —
- Monthly P&I
- —
- Monthly cashflow
- —
- DSCR
- —
- Eligible?
- —
No personal income docs; deal must DSCR.
Hard money
10% down · 12.0% · 12mo
- Down + closing
- —
- Monthly P&I
- —
- Monthly cashflow
- —
- DSCR
- —
- Eligible?
- —
Short-term bridge; refi at stabilization.
Rent comps 3 comps
| Address | Beds | Baths | Sqft | Rent | $/sqft | DOM | Units | Dist |
|---|---|---|---|---|---|---|---|---|
| 600 Commerce Ave NW Warren, OH | 2.0 | 1.0 | 900 | $900 | $1.00 | 13d | 3 | 0.65mi |
| 1388 Beechcrest St NW Warren, OH | 3.0 | 2.0 | 1297 | $1,195 | $0.92 | 13d | 1 | 0.69mi |
| 437 Nevada Ave NW Warren, OH | 2.0 | 1.0 | 1016 | $750 | $0.74 | 13d | 1 | 0.80mi |
Listing history 3 events
-
2026-06-07statusdays on market $49,900 Pending 3 DOM
-
2026-06-05remarks 332-char remark
-
2026-06-05$49,900 Active 2 DOM
ⓘ Source: listings_history table (triggers on properties + properties_extension) + one-shot
backfill from property_details.listing_events for pre-trigger history.
Tax reassessment forecast OH · Partial reset (capped growth)
- Current annual tax
- $889 · $74/mo
- Projected year-2 tax
- $889 · $74/mo
- Expected delta
- $0/yr ($0/mo · 0.0%)
ⓘ Screening estimate from a state-policy table — verify with the county assessor before closing.
Climate risk First Street
- Flood 1/10 Low FEMA zone X (unshaded) · 0% chance over 30 yrs
- Wildfire 1/10 Low
- Heat 3/10 Moderate 7 d/yr ≥97°F today · 17 d/yr by 30 yrs out
- Wind 1/10 Low
- Air quality 3/10 Moderate 1 unhealthy d/yr today · 4 by 30 yrs out
Nearby sold comps map
Loading sold comps map…
Walkable amenities ~0.75 mi
Loading nearby amenities…
Taxation est. · year 1
- Rental income
- $11,682
- − Mortgage interest
- −$2,795
- − Property taxes
- −$889
- − Insurance
- −$250
- − Repairs & maintenance
- −$935
- − Management
- −$935
- − Depreciation
- −$1,452
- Taxable income
- $4,428
- Est. tax owed @ 24.0%
- −$1,063
- After-tax cash flow
- $3,888/yr
For passive investors: Depreciation is non-cash, so a rental often shows a tax loss while cash-flowing — sheltering income. Rental losses are passive: they offset passive income freely, and up to $25,000/yr can offset ordinary (W-2) income if you actively participate and your MAGI is under $100k (phasing out to $0 by $150k); unused losses carry forward. On sale, claimed depreciation is recaptured at up to 25%, and gains may owe capital-gains tax (a 1031 exchange can defer both). Figures are a year-1 estimate at your 24.0% rate — not tax advice; consult a CPA.
Schools (NCES district)
- District
- Warren City
- NCES district ID
- 3904499
- Math proficiency
- 22% ▼ -16.00%
- Reading proficiency
- 32% ▼ -9.00%
- Median HH income
- $28,222
- Composite
- 21.6/100
- National rank
- #8299
- State rank
- #599 of 656 in OH
Livability — Warren
- Score
- 73/100
- State rank
- #312
- US rank
- #5068
Category grades
Schools grade is shown separately in the Schools card above.
Census & demographics
- Census place
- Warren, OH
- County
- Trumbull · 193,293 people
- City population
- 25,805
- Metro
- Youngstown-Warren, OH
- Population (ZIP)
- 15,194
- Household income
- $33,720
- Rent vs Own
- Severe rent burden
- 14.2
Population outlook (Trumbull County) Hauer SSP2
- Today (2025)
- 191,696 people
- By 2030
- 184,015 · -4.0%
- By 2040
- 166,810 · -13.0%
- By 2050
- 149,857 · -21.8%
- By 2075
- 115,769 · -39.6%
- By 2100
- 83,617 · -56.4%
Race, ethnicity, and origin ACS 2023
- Neighborhood character
- Diverse neighborhood (Simpson 0.57)
- Race & ethnicity
- White 54% Black 38% Two or more races 5% Hispanic / Latino 3%
- Common ancestry
- Lithuanian 1% Slovak 1% Iranian 1%
- Foreign-born
- 1%
- Languages at home
- 99% English-only · Other Indo-European 1%
Political lean MEDSL · Trumbull
- 2024 margin
- R (+16.8) · D 41.2% · R 58.0%
- 2008→2024 swing
- -39.2pp toward R · 2008: 22.4pp · 2024: -16.8pp
- All cycles
- 2024: R+16.8 2020: R+10.6 2016: R+6.4 2012: D+22.2 2008: D+22.4
Not yet ingested
- Civics
- —
Market trends
- HPI YoY
- ▼ -1.14%
- Current HPI
- 212.5324
- Rent YoY
- —
- Metro
- —
- State GDP YoY
- ▲ 1.98%
- F500 in state
- 48
Industry mix (Fortune 500 HQ in OH)
| Industry | F500 HQs | Revenue |
|---|---|---|
| Insurance | 3 | $145B |
|
||
| Industrial Machinery | 3 | $49B |
|
||
| Financial Services | 3 | $24B |
|
||
| Consumer Goods | 2 | $93B |
|
||
| Aerospace / Defense | 2 | $47B |
|
||
| Utilities | 2 | $33B |
|
||
Price history
+69.2% since first listed3 events — show timeline
- 2026-06-02 Listed $49,900 MLSNOW
- 1999-04-16 Sold (Public Records) $58,000 Public Records
- 1986-06-03 Sold (Public Records) $29,500 Public Records
Property tax history
+0.0%/yrLatest (2025): $889 · +1.9% YoY. Source: county tax records.
Cash-flow waterfall
monthlySold comps — $/sqft
last 12 mo · ≤1 miLoading sold comps…