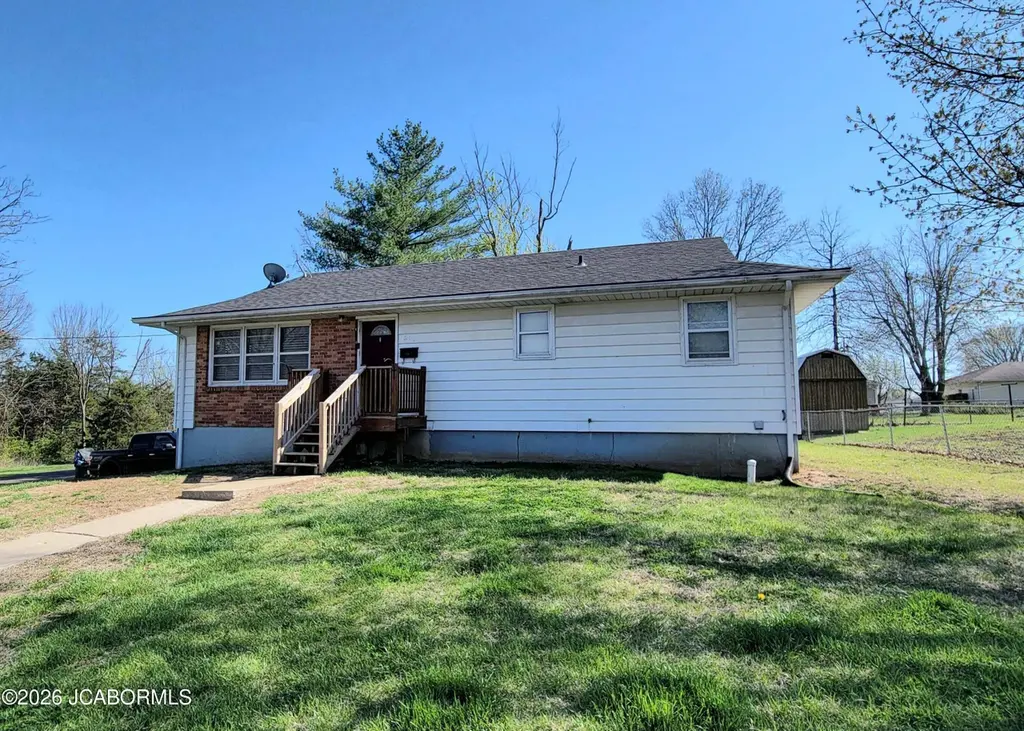
1208 Perry Ln · Fulton, MO
Flood risk 1/10 · Minimal
- FEMA flood zone
- X (unshaded)
- Chance of flooding over 30 yrs
- 0.0%
- Est. flood insurance / yr
- $473 – $860
Fire risk 2/10 · Minimal
- Est. fire insurance / yr
- $1,054 – $1,958
Heat risk 4/10 · Minor
- Hot days now (above 106°F)
- 7 days/yr
- Hot days in 30 yrs
- 19 days/yr
Wind risk 2/10 · Minimal
- Chance of severe wind over 30 yrs
- —
Air-quality risk 2/10 · Minimal
- Unhealthy air days now
- 1 days/yr
- Unhealthy air days in 30 yrs
- 1 days/yr
Risk factors via First Street. Map © Google.
Why this score? — see what drove the C grade
The composite is a weighted blend of 9 inputs, each scored 0–100. Each bar is that input's sub-score; the figure is the points it added to the 100-point composite (weight × sub-score).
- Cash flow +18.4/30.0
- ARV discount +15.0/15.0
- DSCR +5.8/10.0
- 1% rule +4.3/10.0
- Livability +3.6/5.0
- Schools +3.3/10.0
- Rent growth +2.5/5.0
- Condition / age +2.5/5.0
- Appreciation +0.0/10.0
$140,000
🖨 Deal sheet 📄 Offer letter ✓ Due diligence
Listing remarks MLS
Cute 3 bedroom, 1-bath home in a great Fulton location! Situated on a large corner lot (91x101), this property features a spacious unfinished basement with a rec room and a potential non-conforming bedroom, washer/dryer hookups, and a 1-car basement garage. Enjoy the large rear deck and outdoor space. Excellent investment opportunity or income-producing rental.
Key facts
- Unfinished basement
- Rec room
- Outdoor space
Tags
Neighborhood map
What this means for you Summary
Snapshot
- This is a 3-bed/1.0-bath single-family listed at $140k.
Deal economics
- At list price, monthly cash flow is $130 ($2k/yr) — positive.
- The deal already cash-flows at list — no discount required.
- To meet the 1% rule (rent ≥ 1% of price), the offer needs to be $130k (7.3% below list).
- Recommended offer: $130k (7.3% below list) — sets the bar for 1% rule.
- Cap rate 7.4% vs local median 4.0% in Fulton — top-decile yield for the area; either an underpriced asset or a hidden risk that comps aren't pricing in. Stress-test before assuming the spread holds.
Location & tenants
- Location reads 71/100 on livability (#115 in MO) — a middle-class / working-renter tenant base. Strengths: cost of living A+, housing A+, crime B+; Watch: amenities F, commute F, employment D-.
- Fulton 58 (town): math 36% / reading 42% proficiency, ranked #158 of 324 in MO (top 49%) — families likely to look elsewhere, expect single-tenant / working-renter base with shorter leases.
- Market conditions: 134 active listings in the ZIP; 2 comparable units currently listed for rent nearby; 40 units permitted in Callaway County in 2024 (0 in 5+ unit buildings).
Forward outlook
- Local home prices are declining (-3.0%/yr); year-one equity from $968 of loan paydown is wiped out by about $4k of value loss. Plan a longer hold.
Negotiation context
- It's been on market 47 days — a 3% lower offer ($136k) is reasonable based on typical stale-listing flexibility.
- 4 sale attempts since 23y ago with the ask held roughly flat each time — persistent listings suggest the price (not the market) is what's stuck; bring a comps-based counter.
Questions for the listing agent
- It's been on market 47 days. Have you received any prior offers? Is the seller open to a 7% concession, seller financing, or rate buy-down credit?
- Built in 1972 — when were the roof, HVAC, electrical panel, plumbing, and water heater last replaced?
- Is there a deadline driving the sale (1031 exchange, divorce, estate, relocation)? That informs how much negotiation room exists.
- What's the average days-on-market for RENTAL listings here right now (not sales)? A rising rental-DOM trend means longer vacancies and softer asking-rent achievability than the comps imply.
- What's the recent tenant-quality profile in this submarket — average credit score on applications, eviction rate, late-payment / NSF rate, and stable-employment percentage? A property-management company in the area should have these aggregated.
- How much new for-sale + rental construction is in the pipeline within 1–3 miles? Heavy new supply typically softens prices + rents 12–24 months out; constrained supply supports both.
Investment metrics
- 1% rule
- 0.93% ✗
- Cap rate
- 7.41%
- Cash-on-cash
- 3.98%
- DSCR
- 1.18
- GRM
- 9.0
CMA / ARV
- ARV (median comp)
- $185,157
- List price
- $140,000
- Delta
- -24.39%
- Verdict
- UNDERPRICED
- Comps
- 20 within 1.0 mi
Show comp detail 7 sales within ~0.75 mi
| Address | Dist | Beds/Ba | Sqft | Sold | Price | $/sf | Match |
|---|---|---|---|---|---|---|---|
| 1101 Donna Ln | 0.12mi | 3/1.5 | 1,232 (0%) | 16mo | $210,000 | $170 | 79 |
| 1205 Perry Ln | 0.04mi | 3/1.0 | 1,120 (-9%) | 16mo | $157,000 | $140 | 70 |
| 1308 Kathy St | 0.20mi | 3/1.5 | 1,350 (+10%) | 18mo | $178,000 | $132 | 57 |
| 807 W Morningside Dr | 0.43mi | 3/2.0 | 1,200 (-3%) | 22mo | $219,900 | $183 | 54 |
| 831 Middle St | 0.47mi | 2/1.0 (-1) | 1,128 (-8%) | 20mo | $140,000 | $124 | 42 |
| 1102 Vine St | 0.74mi | 2/1.0 (-1) | 1,350 (+10%) | 5mo | $189,900 | $141 | 40 |
| 1701 Hollywood Blvd | 0.58mi | 3/2.0 | 1,344 (+9%) | 24mo | $219,000 | $163 | 34 |
Match score weights: distance 35% · size 25% · config 20% · recency 20%. Top-matched comps best support the ARV.
Projected returns pro-forma
-3.0% appreciation · 3.0% rent growth · sell at horizon
- IRR
- -10.1%
- Equity multiple
- 0.63×
- Total profit
- $-14,433
- Equity at exit
- $20,874
- IRR
- -0.7%
- Equity multiple
- 0.95×
- Total profit
- $-2,010
- Equity at exit
- $12,105
Cash invested: $39,200 (down + closing). Projections, not guarantees.
Landlord ↔ Tenant lean methodology
- Overall (STATE)
- 81 Strongly Landlord-Friendly
- State Missouri
- 81 Strongly Landlord-Friendly · R+10
- County
- — inherits STATE
- City
- — inherits STATE
ZIP-level market 65251
- Active inventory
- 134
- Price-to-rent
- 9.0×
Monthly cashflow live
- Estimated rent
- $1,298 medium interval (Pro) →
- Mortgage (P&I)
- −$734
- Tax from tax record
- −$103 /mo · $1,231/yr
- Insurance
- −$58
- HOA
- −$0
- Vacancy / Maint / Mgmt
- −$272
- Net cashflow
- $130
Break-even live
UW: 25.0% down · 7.5% · 30yr · 1.5% tax · 5.0% vac · 8.0% maint · 8.0% mgmt
Financing live
Cash to close
- Down payment
- $35,000
- Closing costs
- $4,200
- Reserves months
- —
- Total cash needed
- —
Loan-product check · same deal, 3 products live
Conventional
25% down · 7.5% · 30yr
- Down + closing
- —
- Monthly P&I
- —
- Monthly cashflow
- —
- DSCR
- —
- Eligible?
- —
Personal DTI + credit; lowest rate.
DSCR
20% down · 8.5% · 30yr
- Down + closing
- —
- Monthly P&I
- —
- Monthly cashflow
- —
- DSCR
- —
- Eligible?
- —
No personal income docs; deal must DSCR.
Hard money
10% down · 12.0% · 12mo
- Down + closing
- —
- Monthly P&I
- —
- Monthly cashflow
- —
- DSCR
- —
- Eligible?
- —
Short-term bridge; refi at stabilization.
Rent comps 2 comps
| Address | Beds | Baths | Sqft | Rent | $/sqft | DOM | Units | Dist |
|---|---|---|---|---|---|---|---|---|
| 103 E 10th St Fulton, MO | 2.0 | 1.5 | 850 | $815 | $0.96 | 13d | 1 | 0.96mi |
| 301 W 14th St Fulton, MO | 3.0 | 1.0 | 1240 | $1,500 | $1.21 | 13d | 1 | 1.27mi |
Listing history 8 events
-
2026-04-23historical Active Under Contract 363-char remark
Show marketing remark (363 chars)
Cute 3 bedroom, 1-bath home in a great Fulton location! Situated on a large corner lot (91x101), this property features a spacious unfinished basement with a rec room and a potential non-conforming bedroom, washer/dryer hookups, and a 1-car basement garage. Enjoy the large rear deck and outdoor space. Excellent investment opportunity or income-producing rental.
-
2026-04-09$140,000 Active 363-char remark
Show marketing remark (363 chars)
Cute 3 bedroom, 1-bath home in a great Fulton location! Situated on a large corner lot (91x101), this property features a spacious unfinished basement with a rec room and a potential non-conforming bedroom, washer/dryer hookups, and a 1-car basement garage. Enjoy the large rear deck and outdoor space. Excellent investment opportunity or income-producing rental.
-
2026-04-09$140,000 Active
Show marketing remark (363 chars)
Cute 3 bedroom, 1-bath home in a great Fulton location! Situated on a large corner lot (91x101), this property features a spacious unfinished basement with a rec room and a potential non-conforming bedroom, washer/dryer hookups, and a 1-car basement garage. Enjoy the large rear deck and outdoor space. Excellent investment opportunity or income-producing rental.
-
2026-04-09$140,000 Active 363-char remark
Show marketing remark (363 chars)
Cute 3 bedroom, 1-bath home in a great Fulton location! Situated on a large corner lot (91x101), this property features a spacious unfinished basement with a rec room and a potential non-conforming bedroom, washer/dryer hookups, and a 1-car basement garage. Enjoy the large rear deck and outdoor space. Excellent investment opportunity or income-producing rental.
-
2004-03-01soldstatus
-
2004-03-01soldstatus
-
2003-08-26$89,500
-
1999-04-23soldstatus
ⓘ Source: listings_history table (triggers on properties + properties_extension) + one-shot
backfill from property_details.listing_events for pre-trigger history.
Tax reassessment forecast MO · Resets to sale price
- Current annual tax
- $1,231 · $103/mo
- Projected year-2 tax
- $1,358 · $113/mo
- Expected delta
- +$127/yr (+$11/mo · 10.3%)
ⓘ Screening estimate from a state-policy table — verify with the county assessor before closing.
Climate risk First Street
- Flood 1/10 Low FEMA zone X (unshaded) · 0% chance over 30 yrs
- Wildfire 2/10 Low
- Heat 4/10 Moderate 7 d/yr ≥106°F today · 19 d/yr by 30 yrs out
- Wind 2/10 Low
- Air quality 2/10 Low 1 unhealthy d/yr today · 1 by 30 yrs out
Nearby sold comps map
Loading sold comps map…
Walkable amenities ~0.75 mi
Loading nearby amenities…
Taxation est. · year 1
- Rental income
- $15,571
- − Mortgage interest
- −$7,842
- − Property taxes
- −$1,231
- − Insurance
- −$700
- − Repairs & maintenance
- −$1,246
- − Management
- −$1,246
- − Depreciation
- −$4,073
- Taxable loss
- −$767
- Est. tax savings @ 24.0%
- +$184
- After-tax cash flow
- $1,744/yr
For passive investors: Depreciation is non-cash, so a rental often shows a tax loss while cash-flowing — sheltering income. Rental losses are passive: they offset passive income freely, and up to $25,000/yr can offset ordinary (W-2) income if you actively participate and your MAGI is under $100k (phasing out to $0 by $150k); unused losses carry forward. On sale, claimed depreciation is recaptured at up to 25%, and gains may owe capital-gains tax (a 1031 exchange can defer both). Figures are a year-1 estimate at your 24.0% rate — not tax advice; consult a CPA.
Schools (NCES district)
- District
- Fulton 58
- NCES district ID
- 2912550
- Math proficiency
- 36% ▼ -1.00%
- Reading proficiency
- 42% ▼ -4.00%
- Median HH income
- $46,431
- Composite
- 33.31/100
- National rank
- #5504
- State rank
- #158 of 324 in MO
Livability — Fulton
- Score
- 71/100
- State rank
- #115
- US rank
- #7204
Category grades
Schools grade is shown separately in the Schools card above.
Census & demographics
- Census place
- Fulton, MO
- County
- Callaway County · 22,579 people
- City population
- 22,579
- Metro
- Jefferson City, MO
- Population (ZIP)
- 22,579
- Household income
- $63,072
- Rent vs Own
- Severe rent burden
- 551.0
Population outlook (Callaway County) Hauer SSP2
- Today (2025)
- 45,390 people
- By 2030
- 45,493 · +0.2%
- By 2040
- 45,092 · -0.7%
- By 2050
- 44,069 · -2.9%
- By 2075
- 41,875 · -7.7%
- By 2100
- 38,094 · -16.1%
Race, ethnicity, and origin ACS 2023
- Neighborhood character
- Predominantly White (86%)
- Race & ethnicity
- White 86% Two or more races 6% Black 5% Hispanic / Latino 3%
- Common ancestry
- Italian 5% Lithuanian 3% Serbian 2%
- Foreign-born
- 1% · Canada
- Languages at home
- 98% English-only · Spanish 1%
Political lean MEDSL · Callaway
- 2024 margin
- Solid R (+43.3) · D 27.6% · R 70.9% · Other 1.5%
- 2008→2024 swing
- -23.6pp toward R · 2008: -19.7pp · 2024: -43.3pp
- All cycles
- 2024: R+43.3 2020: R+42.3 2016: R+42.2 2012: R+31.1 2008: R+19.7
Not yet ingested
- Civics
- —
Market trends
- HPI YoY
- ▼ -119.33%
- Current HPI
- 205.5205
- Rent YoY
- —
- Metro
- Jefferson City, MO
- State GDP YoY
- ▲ 1.84%
- F500 in state
- 20
Industry mix (Fortune 500 HQ in MO)
| Industry | F500 HQs | Revenue |
|---|---|---|
| Healthcare | 1 | $163B |
|
||
| Insurance | 1 | $21B |
|
||
| Industrial Technology | 1 | $17B |
|
||
| Retail | 1 | $16B |
|
||
| Industrial Distribution | 1 | $10B |
|
||
| Utilities | 1 | $9B |
|
||
Price history
+56.4% since first listed8 events — show timeline
- 2026-04-23 Contingent — JCMLS
- 2026-04-09 Listed $140,000 CBORMLS
- 2026-04-09 Listed $140,000 HMMLS
- 2026-04-09 Listed $140,000 JCMLS
- 2004-03-01 Sold (Public Records) — Public Records
- 2004-03-01 Sold (MLS) — CBORMLS
- 2003-08-26 Listed $89,500 CBORMLS
- 1999-04-23 Sold (Public Records) — Public Records
Property tax history
+4.1%/yrLatest (2025): $1,231 · -0.1% YoY. Source: county tax records.
Cash-flow waterfall
monthlySold comps — $/sqft
last 12 mo · ≤1 miLoading sold comps…