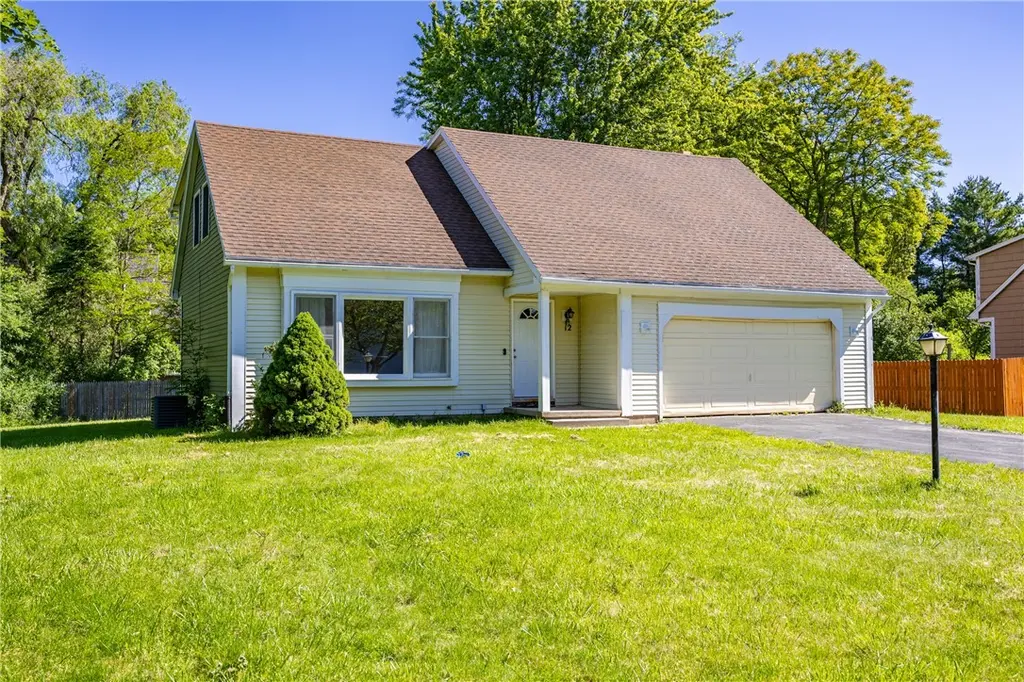
12 French Meadow Ln · Brighton, NY
Flood risk 1/10 · Minimal
- FEMA flood zone
- X (unshaded)
- Chance of flooding over 30 yrs
- 0.0%
- Est. flood insurance / yr
- $473 – $860
Fire risk 1/10 · Minimal
- Est. fire insurance / yr
- $691 – $1,283
Heat risk 2/10 · Minimal
- Hot days now (above 96°F)
- 7 days/yr
- Hot days in 30 yrs
- 15 days/yr
Wind risk 1/10 · Minimal
- Chance of severe wind over 30 yrs
- —
Air-quality risk 2/10 · Minimal
- Unhealthy air days now
- 1 days/yr
- Unhealthy air days in 30 yrs
- 1 days/yr
Risk factors via First Street. Map © Google.
Why this score? — see what drove the D+ grade
The composite is a weighted blend of 9 inputs, each scored 0–100. Each bar is that input's sub-score; the figure is the points it added to the 100-point composite (weight × sub-score).
- Cash flow +12.7/30.0
- ARV discount +11.3/15.0
- Schools +6.1/10.0
- 1% rule +4.7/10.0
- Livability +4.0/5.0
- DSCR +3.8/10.0
- Rent growth +2.5/5.0
- Condition / age +2.5/5.0
- Appreciation +0.0/10.0
$349,900
🖨 Deal sheet (PDF) 📄 Offer letter ✓ Due diligence
Listing remarks MLS
SIngle Family house with 2 car garage. Master bedroom with extra room. Fireplaced family room. Laundry hookups.
Key facts
- 0.32 acre lot
- 2 garage spots
- Built 1982
Tags
Property features AI
Finance
- Other: Lot approximately 0.32 acres (100 x 140); Lot on a cul-de-sac, rectangular residential lot near public transit; City street frontage
Exterior
- Parking: Attached garage with electricity; 2 garage spaces
- Utilities: Cable available; Public water (connected); Sewer connected; Circuit breaker electric service
- Home design: 2-story house; Existing construction; Resale property
- Construction: Vinyl siding; Architectural shingle roof; Block foundation; Built as existing (year built details listed as existing)
- Exterior features: Blacktop driveway; Open porch
Interior
- Kitchen: Dishwasher; Gas oven; Gas range; Range hood; Refrigerator; Exhaust fan
- Bedrooms: Total rooms: 9
- Flooring: Carpet; Laminate; Varied flooring
- Bathrooms: 3 full bathrooms; 1 main-level bathroom
- Heating & cooling: Gas forced-air heating; Central air conditioning
- Interior features: Separate/formal dining room; Separate/formal living room; Country kitchen; Full basement; One fireplace
- Laundry & utility: Gas water heater
Neighborhood map
What this means for you Summary
Snapshot
- This is a 4-bed/2.0-bath single-family listed at $350k.
Deal economics
- At list price, monthly cash flow is $-35 ($-423/yr) — negative.
- To cash-flow at today's rent, offer at most $344k (1.8% below list).
- To meet the 1% rule (rent ≥ 1% of price), the offer needs to be $338k (3.3% below list).
- Recommended offer: $338k (3.3% below list) — sets the bar for 1% rule.
- Cap rate 6.2% vs local median 3.9% in Brighton — top-decile yield for the area; either an underpriced asset or a hidden risk that comps aren't pricing in. Stress-test before assuming the spread holds.
Location & tenants
- Location reads 81/100 on livability (#89 in NY, #1,379 nationally) — a professional / high-income tenant draw. Strengths: housing A+, health & safety A+, employment B+; Watch: crime D+, amenities D-.
- Brighton Central School District (suburban): math 64% / reading 74% proficiency, ranked #142 of 590 in NY (top 24%) — acceptable for families but not a draw, mixed tenant base, ~2y average lease; only 10% free/reduced lunch — higher-income household profile.
- Zoned schools: French Road Elementary School (math 62% / reading 74%, grade B+, #522 of 2,108 statewide, top 25%, 711 students, 23% FRL); Twelve Corners Middle School (math 50% / reading 71%, grade B+, #153 of 729 statewide, top 21%, 781 students, 25% FRL); Brighton High School (math 100% / reading 92%, grade A+, #71 of 1,100 statewide, top 7%, 1,243 students, 23% FRL).
- Market conditions: 116 active listings in the ZIP; 1 comparable units currently listed for rent nearby; high-income renter base; 1,169 units permitted in Monroe County in 2024 (591 in 5+ unit buildings).
- This rent runs 32% of the median local income ($125k/yr) — at the standard rent-burdened threshold; future hikes will face affordability resistance.
Forward outlook
- Local home prices are declining (-3.0%/yr); year-one equity from $2k of loan paydown is wiped out by about $10k of value loss. Plan a longer hold.
- Monroe County population projected to shrink 6% by 2050 — rents likely to lag national; underwrite the cash flow, not the appreciation.
Negotiation context
- It's been on market 17 days — a 2% lower offer ($345k) is reasonable based on typical stale-listing flexibility.
- 2 sale attempts since 22y ago with the ask held roughly flat each time — persistent listings suggest the price (not the market) is what's stuck; bring a comps-based counter.
- Current owner paid $163k; list at $350k implies a 115% gain — meaningful room to come down on a strong offer.
Questions for the listing agent
- What do current leases actually rent for vs. the listed asking? Can we see a recent rent roll and the last 12 months of T-12 income?
- Is there a deadline driving the sale (1031 exchange, divorce, estate, relocation)? That informs how much negotiation room exists.
- Schools are B-rated — typically a magnet for longer-tenancy family renters. What's the average tenant stay here, and is there a school-zone premium baked into asking?
- Crime grade is D in this area — have there been break-ins, vandalism, or insurance claims at this property in the last 3 years? What carrier currently insures it and at what premium?
- The area grade is low — what's the realistic commute time and amenity access for the typical tenant pool here? Any planned neighborhood developments (good or bad) we should know about?
- What's the average days-on-market for RENTAL listings here right now (not sales)? A rising rental-DOM trend means longer vacancies and softer asking-rent achievability than the comps imply.
- What's the recent tenant-quality profile in this submarket — average credit score on applications, eviction rate, late-payment / NSF rate, and stable-employment percentage? A property-management company in the area should have these aggregated.
- How much new for-sale + rental construction is in the pipeline within 1–3 miles? Heavy new supply typically softens prices + rents 12–24 months out; constrained supply supports both.
Investment metrics
- 1% rule
- 0.97% ✗
- Cap rate
- 6.17%
- Cash-on-cash
- -0.43%
- DSCR
- 0.98
- GRM
- 8.6
CMA / ARV
- ARV (on-the-fly)
- $382,046
- Comps found
- 12
Show comp detail 12 sales within ~0.75 mi
| Address | Dist | Beds/Ba | Sqft | Sold | Price | $/sf | Match |
|---|---|---|---|---|---|---|---|
| 29 French Meadow Ln | 0.08mi | 4/2.5 | 1,981 (+5%) | 12mo | $365,000 | $184 | 75 |
| 120 Viennawood Dr | 0.36mi | 4/2.5 | 1,828 (-3%) | 15mo | $390,100 | $213 | 64 |
| 56 Hunters Ln | 0.53mi | 3/2.5 (-1) | 1,926 (+2%) | 2mo | $506,000 | $263 | 62 |
| 275 Viennawood Dr | 0.14mi | 4/2.5 | 2,132 (+13%) | 10mo | $500,000 | $235 | 61 |
| 135 Crandon Way | 0.71mi | 4/2.5 | 1,932 (+3%) | 1mo | $393,000 | $203 | 60 |
| 20 Chadwick Dr | 0.30mi | 4/2.5 | 2,054 (+9%) | 14mo | $451,000 | $220 | 57 |
| 301 Idlewood Rd | 0.63mi | 4/1.5 | 1,810 (-4%) | 6mo | $475,000 | $262 | 57 |
| 68 Branchwood Ln | 0.34mi | 3/2.5 (-1) | 1,652 (-12%) | 11mo | $335,000 | $203 | 47 |
| 1121 Edgewood Ave | 0.59mi | 4/2.0 | 1,688 (-10%) | 10mo | $316,000 | $187 | 47 |
| 5 Dunrovin Ln | 0.60mi | 3/1.5 (-1) | 1,747 (-7%) | 11mo | $270,000 | $155 | 44 |
| 621 Edgewood Ave | 0.65mi | 3/2.0 (-1) | 1,628 (-14%) | 6mo | $318,000 | $195 | 37 |
| 472 French Rd | 0.75mi | 4/2.5 | 2,144 (+14%) | 10mo | $370,000 | $173 | 32 |
Match score weights: distance 35% · size 25% · config 20% · recency 20%. Top-matched comps best support the ARV.
Projected returns pro-forma
-3.0% appreciation · 3.0% rent growth · sell at horizon
- IRR
- -16.9%
- Equity multiple
- 0.40×
- Total profit
- $-58,717
- Equity at exit
- $52,171
- IRR
- -8.7%
- Equity multiple
- 0.46×
- Total profit
- $-53,094
- Equity at exit
- $30,253
Cash invested: $97,972 (down + closing). Projections, not guarantees.
Landlord ↔ Tenant lean methodology
- Overall (STATE)
- 15 Strongly Tenant-Friendly
- State New York
- 15 Strongly Tenant-Friendly · D+10
- County
- — inherits STATE
- City
- — inherits STATE
ZIP-level market 14618
- Active inventory
- 116
- Price-to-rent
- 8.6×
Monthly cashflow live
- Estimated rent
- $3,382 medium interval (Pro) →
- Mortgage (P&I)
- −$1,835
- Tax from tax record
- −$726 /mo · $8,717/yr
- Insurance
- −$146
- HOA
- −$0
- Vacancy / Maint / Mgmt
- −$710
- Net cashflow
- $-35
Break-even live
Sensitivity live
| Price | -10% $163 | -5% $64 | +0% $-35 | +5% $-134 | +10% $-233 |
|---|---|---|---|---|---|
| Rent | -10% $-302 | -5% $-169 | +0% $-35 | +5% $98 | +10% $232 |
| Rate | -1.0pp $141 | -0.5pp $54 | base $-35 | +0.5pp $-126 | +1.0pp $-218 |
UW: 25.0% down · 7.5% · 30yr · 1.5% tax · 5.0% vac · 8.0% maint · 8.0% mgmt
Financing live
Cash to close
- Down payment
- $87,475
- Closing costs
- $10,497
- Reserves months
- —
- Total cash needed
- —
Loan-product check · same deal, 3 products live
Conventional
25% down · 7.5% · 30yr
- Down + closing
- —
- Monthly P&I
- —
- Monthly cashflow
- —
- DSCR
- —
- Eligible?
- —
Personal DTI + credit; lowest rate.
DSCR
20% down · 8.5% · 30yr
- Down + closing
- —
- Monthly P&I
- —
- Monthly cashflow
- —
- DSCR
- —
- Eligible?
- —
No personal income docs; deal must DSCR.
Hard money
10% down · 12.0% · 12mo
- Down + closing
- —
- Monthly P&I
- —
- Monthly cashflow
- —
- DSCR
- —
- Eligible?
- —
Short-term bridge; refi at stabilization.
Rent comps 1 comps
| Address | Beds | Baths | Sqft | Rent | $/sqft | DOM | Units | Dist |
|---|---|---|---|---|---|---|---|---|
| 130 Brooklawn Dr Rochester, NY | 3.0 | 1.0 | 1380 | $2,950 | $2.14 | 45d | 1 | 1.29mi |
Listing history 12 events
-
2026-06-21days on market $349,900 Active 17 DOM
-
2026-06-18days on market $349,900 Active 14 DOM
-
2026-06-17days on market $349,900 Active 13 DOM
-
2026-06-16days on market $349,900 Active 12 DOM
-
2026-06-15days on market $349,900 Active 11 DOM
-
2026-06-13days on market $349,900 Active 9 DOM
-
2026-06-10days on market $349,900 Active 6 DOM
-
2026-06-09days on market $349,900 Active 5 DOM
-
2026-06-08days on market $349,900 Active 4 DOM
-
2026-06-07days on market $349,900 Active 3 DOM
-
2026-06-05remarks 687-char remark
-
2026-06-05$349,900 Active 1 DOM
ⓘ Source: listings_history table (triggers on properties + properties_extension) + one-shot
backfill from property_details.listing_events for pre-trigger history.
Tax reassessment forecast NY · Partial reset (capped growth)
- Current annual tax
- $8,717 · $726/mo
- Projected year-2 tax
- $8,717 · $726/mo
- Expected delta
- $0/yr ($0/mo · 0.0%)
ⓘ Screening estimate from a state-policy table — verify with the county assessor before closing.
Climate risk First Street
- Flood 1/10 Low FEMA zone X (unshaded) · 0% chance over 30 yrs
- Wildfire 1/10 Low
- Heat 2/10 Low 7 d/yr ≥96°F today · 15 d/yr by 30 yrs out
- Wind 1/10 Low
- Air quality 2/10 Low 1 unhealthy d/yr today · 1 by 30 yrs out
Nearby sold comps map
Loading sold comps map…
Walkable amenities ~0.75 mi
Loading nearby amenities…
Taxation est. · year 1
- Rental income
- $40,585
- − Mortgage interest
- −$19,600
- − Property taxes
- −$8,717
- − Insurance
- −$1,750
- − Repairs & maintenance
- −$3,247
- − Management
- −$3,247
- − Depreciation
- −$10,179
- Taxable loss
- −$6,154
- Est. tax savings @ 24.0%
- +$1,477
- After-tax cash flow
- $1,054/yr
For passive investors: Depreciation is non-cash, so a rental often shows a tax loss while cash-flowing — sheltering income. Rental losses are passive: they offset passive income freely, and up to $25,000/yr can offset ordinary (W-2) income if you actively participate and your MAGI is under $100k (phasing out to $0 by $150k); unused losses carry forward. On sale, claimed depreciation is recaptured at up to 25%, and gains may owe capital-gains tax (a 1031 exchange can defer both). Figures are a year-1 estimate at your 24.0% rate — not tax advice; consult a CPA.
Schools (NCES district)
- District
- Brighton Central School District
- NCES district ID
- 3605460
- Math proficiency
- 64% ▼ -8.00%
- Reading proficiency
- 74% ▲ 6.00%
- Median HH income
- $71,403
- Composite
- 60.55/100
- National rank
- #837
- State rank
- #142 of 590 in NY
Livability — Brighton
- Score
- 81/100
- State rank
- #89
- US rank
- #1379
Category grades
Schools grade is shown separately in the Schools card above.
Census & demographics
- Census place
- Brighton, NY
- County
- Monroe County · 674,131 people
- City population
- 38,703
- Metro
- Rochester, NY
- Population (ZIP)
- 25,476
- Household income
- $125,098
- Rent vs Own
- Severe rent burden
- 548.0
Population outlook (Monroe County) Hauer SSP2
- Today (2025)
- 759,460 people
- By 2030
- 757,154 · -0.3%
- By 2040
- 740,644 · -2.5%
- By 2050
- 714,443 · -5.9%
- By 2075
- 645,883 · -15.0%
- By 2100
- 547,084 · -28.0%
Race, ethnicity, and origin ACS 2023
- Neighborhood character
- Predominantly White (80%)
- Race & ethnicity
- White 80% Asian 8% Two or more races 6% Black 4% Hispanic / Latino 3%
- Common ancestry
- Romanian 5% Scotch-Irish 3% Slovak 3%
- Foreign-born
- 10% · Canada, China, South Korea
- Languages at home
- 88% English-only · Other Asian/Pacific 2% Other Indo-European 2% Spanish 2%
Political lean MEDSL · Monroe
- 2024 margin
- D (+19.1) · D 59.5% · R 40.5%
- 2008→2024 swing
- +1.4pp toward D · 2008: 17.7pp · 2024: 19.1pp
- All cycles
- 2024: D+19.1 2020: D+21.0 2016: D+14.1 2012: D+17.4 2008: D+17.7
Not yet ingested
- Civics
- —
Market trends
- HPI YoY
- ▼ -246.83%
- Current HPI
- 271.6387
- Rent YoY
- —
- Metro
- Rochester, NY
- State GDP YoY
- ▲ 2.60%
- F500 in state
- 92
Industry mix (Fortune 500 HQ in NY)
| Industry | F500 HQs | Revenue |
|---|---|---|
| Financial Services | 10 | $950B |
|
||
| Consumer Goods | 9 | $162B |
|
||
| Insurance | 4 | $225B |
|
||
| Telecommunications | 2 | $144B |
|
||
| Pharmaceuticals | 2 | $112B |
|
||
| Media / Entertainment | 2 | $69B |
|
||
Price history
+24892.9% since first listed4 events — show timeline
- 2026-06-04 Listed $349,900 UNYREIS
- 2007-07-31 Sold (Public Records) $163,000 Public Records
- 2004-04-16 Sold (MLS) $1,400 UNYREIS
- 2004-03-18 Listed $1,400 UNYREIS
Property tax history
+1.8%/yrLatest (2025): $8,717 · +11.8% YoY. Source: county tax records.
Cash-flow waterfall
monthlySold comps — $/sqft
last 12 mo · ≤1 miLoading sold comps…