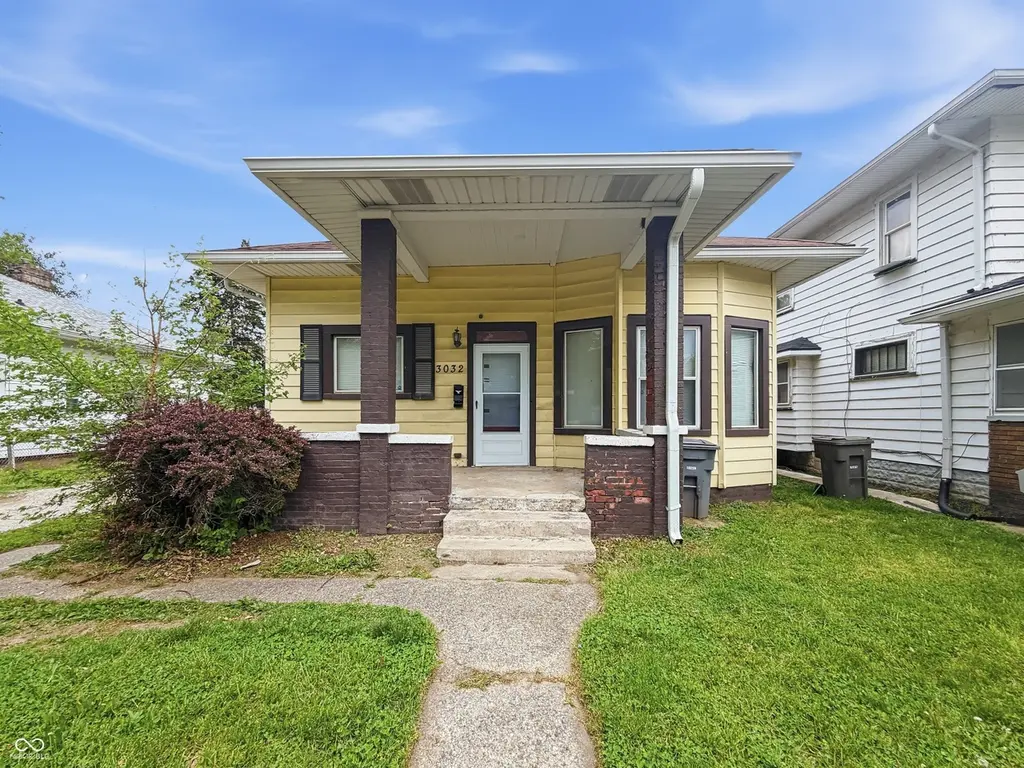
3032 Boulevard Pl · Indianapolis city (balance), IN
Flood risk 6/10 · Moderate
- FEMA flood zone
- X (unshaded)
- Chance of flooding over 30 yrs
- 0.71%
- Est. flood insurance / yr
- $473 – $860
Fire risk 1/10 · Minimal
- Est. fire insurance / yr
- $717 – $1,331
Heat risk 4/10 · Minor
- Hot days now (above 101°F)
- 7 days/yr
- Hot days in 30 yrs
- 19 days/yr
Wind risk 2/10 · Minimal
- Chance of severe wind over 30 yrs
- 0.0%
Air-quality risk 4/10 · Minor
- Unhealthy air days now
- 5 days/yr
- Unhealthy air days in 30 yrs
- 7 days/yr
Risk factors via First Street. Map © Google.
Why this score? — see what drove the C+ grade
The composite is a weighted blend of 9 inputs, each scored 0–100. Each bar is that input's sub-score; the figure is the points it added to the 100-point composite (weight × sub-score).
- Cash flow +22.6/30.0
- ARV discount +15.0/15.0
- DSCR +7.2/10.0
- 1% rule +6.3/10.0
- Rent growth +4.1/5.0
- Livability +2.5/5.0
- Condition / age +2.5/5.0
- Schools +1.4/10.0
- Appreciation +0.0/10.0
$118,000
🖨 Deal sheet (PDF) 📄 Offer letter ✓ Due diligence
Listing remarks
This classic bungalow is full of charm and ready for someone to make it their own. From the moment you arrive, you'll appreciate the character and cozy feel that only a home of this era can offer. Whether you're looking for a place to settle in or an opportunity to add your personal touch, this one is worth a closer look. Built in 1901, this single-level home offers 1,092 square feet of living space and features aluminum siding with a mix of wood and vinyl windows. Inside, you'll find 2 bedrooms and 1 bath, with a layout that feels both comfortable and functional. With no garage, the property keeps things simple while offering plenty of potential to create a space that truly feels like home
Key facts
- 6,011 sq ft lot
- Built 1901
- Listed 55 days
Property features AI
Exterior
- Utilities: Public water; Municipal sewer connected; Solid waste service available
- Home design: Single-family residence; One level
- Construction: Brick partial foundation; Aluminum, vinyl, and wood siding
- Exterior features: Less than 1/4 acre lot
Interior
- Kitchen: Electric oven; Refrigerator
- Bedrooms: Two bedrooms on the main level
- Bathrooms: One full bathroom (main level)
- Heating & cooling: Forced air heating (natural gas); No central cooling
- Interior features: Stained or painted woodwork
- Laundry & utility: Washer; Dryer
Neighborhood map
What this means for you Summary
Snapshot
- This is a 2-bed/1.0-bath single-family listed at $118k.
Deal economics
- At list price, monthly cash flow is $201 ($2k/yr) — positive.
- The deal already cash-flows at list — no discount required.
- Meets the 1% rule at list price ($1k rent vs $118k).
- Recommended offer: $114k (3.0% below list) — sets the bar for market timing.
- Cap rate 8.3% vs local median 4.4% in Indianapolis city (balance) — top-decile yield for the area; either an underpriced asset or a hidden risk that comps aren't pricing in. Stress-test before assuming the spread holds.
Location & tenants
- Location reads: area grade C — affects rentability + tenant quality, not the cash-flow math above.
- Indianapolis Public Schools (urban): math 14% / reading 20% proficiency, ranked #286 of 301 in IN (top 95%) — low school quality limits family demand, transient renter base, plan for 1-2y turnover; 77% free/reduced lunch — lower-income household profile, screen leases tightly.
- Zoned schools: Center For Inquiry School 27 (math 25% / reading 29%, grade F, #737 of 994 statewide, top 76%, 525 students, 51% FRL); H L Harshman Middle School (math 3% / reading 16%, grade F, #316 of 330 statewide, top 96%, 549 students, 84% FRL); Arsenal Technical High School (math 6% / reading 27%, grade F, #353 of 369 statewide, top 96%, 2,366 students, 74% FRL).
- Market conditions: Rents rising fast (+6.4%/yr); 283 active listings in the ZIP; 40 comparable units currently listed for rent nearby; rentals at typical pace (median 26d on market — plan ~3-4 weeks tenant-placement turnaround); 1,906 units permitted in Marion County in 2024 (621 in 5+ unit buildings).
Forward outlook
- Local home prices are declining (-3.0%/yr); year-one equity from $816 of loan paydown is wiped out by about $4k of value loss. Plan a longer hold.
- Marion County population projected at +18% by 2050 — long-run rental-demand tailwind backs the buy-and-hold thesis.
- At projected returns (-3.0% appreciation + 6.4% rent growth), your $33k cash investment doubles in ~9 years — after that, you're playing with house money.
Negotiation context
- It's been on market 55 days — a 3% lower offer ($114k) is reasonable based on typical stale-listing flexibility.
- 3 sale attempts since 10y ago; this cycle's ask has dropped $15k (11%) from the opening price — seller is motivated, your offer sets the floor, not the list.
Risks & watch-outs
- Watch-outs: built in 1901 — expect roof / HVAC / electrical / plumbing capex.
- Climate carrying-cost: major flood risk — expect insurance premiums to compound above CPI over the hold.
Questions for the listing agent
- It's been on market 55 days. Have you received any prior offers? Is the seller open to a 3% concession, seller financing, or rate buy-down credit?
- Built in 1901 — when were the roof, HVAC, electrical panel, plumbing, and water heater last replaced?
- Is there a deadline driving the sale (1031 exchange, divorce, estate, relocation)? That informs how much negotiation room exists.
- What's the average days-on-market for RENTAL listings here right now (not sales)? A rising rental-DOM trend means longer vacancies and softer asking-rent achievability than the comps imply.
- What's the recent tenant-quality profile in this submarket — average credit score on applications, eviction rate, late-payment / NSF rate, and stable-employment percentage? A property-management company in the area should have these aggregated.
- How much new for-sale + rental construction is in the pipeline within 1–3 miles? Heavy new supply typically softens prices + rents 12–24 months out; constrained supply supports both.
Investment metrics
- 1% rule
- 1.13% ✓
- Cap rate
- 8.33%
- Cash-on-cash
- 7.29%
- DSCR
- 1.32
- GRM
- 7.4
CMA / ARV
- ARV (median comp)
- $168,931
- List price
- $118,000
- Delta
- -30.15%
- Verdict
- UNDERPRICED
- Comps
- 20 within 1.0 mi
Show comp detail 12 sales within ~0.75 mi
| Address | Dist | Beds/Ba | Sqft | Sold | Price | $/sf | Match |
|---|---|---|---|---|---|---|---|
| 2949 Shriver Ave | 0.13mi | 3/1.0 (+1) | 1,080 (-1%) | 2mo | $138,000 | $128 | 85 |
| 538 W 28th St | 0.41mi | 2/1.0 | 1,100 (+1%) | 4mo | $110,000 | $100 | 76 |
| 330 Congress Ave | 0.11mi | 3/2.0 (+1) | 1,156 (+6%) | 3mo | $210,000 | $182 | 74 |
| 3017 Ethel Ave | 0.25mi | 3/1.5 (+1) | 1,079 (-1%) | 7mo | $90,000 | $83 | 73 |
| 3151 Graceland Ave | 0.15mi | 3/1.0 (+1) | 1,200 (+10%) | 1mo | $169,900 | $142 | 70 |
| 3042 Graceland Ave | 0.06mi | 3/2.0 (+1) | 1,200 (+10%) | 3mo | $163,700 | $136 | 69 |
| 3035 Graceland Ave | 0.09mi | 3/2.0 (+1) | 1,001 (-8%) | 10mo | $140,000 | $140 | 64 |
| 721 W 32nd St | 0.50mi | 3/2.0 (+1) | 1,108 (+2%) | 3mo | $174,900 | $158 | 63 |
| 727 W 25th St | 0.70mi | 2/1.0 | 1,130 (+4%) | 9mo | $25,500 | $23 | 54 |
| 260 W 33rd St | 0.31mi | 3/1.5 (+1) | 1,200 (+10%) | 10mo | $115,000 | $96 | 54 |
| 2709 Shriver Ave | 0.38mi | 3/2.0 (+1) | 1,212 (+11%) | 6mo | $123,016 | $101 | 50 |
| 2442 Ethel Ave | 0.67mi | 2/1.0 | 1,214 (+11%) | 3mo | $150,000 | $124 | 47 |
Match score weights: distance 35% · size 25% · config 20% · recency 20%. Top-matched comps best support the ARV.
Projected returns pro-forma
-3.0% appreciation · 6.43% rent growth · sell at horizon
- IRR
- -1.2%
- Equity multiple
- 0.95×
- Total profit
- $-1,532
- Equity at exit
- $17,594
- IRR
- 12.0%
- Equity multiple
- 2.10×
- Total profit
- $36,283
- Equity at exit
- $10,202
Cash invested: $33,040 (down + closing). Projections, not guarantees.
Landlord ↔ Tenant lean methodology
- Overall (STATE)
- 90 Strongly Landlord-Friendly
- State Indiana
- 90 Strongly Landlord-Friendly · R+11
- County
- — inherits STATE
- City
- — inherits STATE
ZIP-level market 46208
- Rents YoY
- 6.4%
- Active inventory
- 283
- Price-to-rent
- 7.4×
Monthly cashflow live
- Estimated rent
- $1,335 high interval (Pro) →
- Mortgage (P&I)
- −$619
- Tax from tax record
- −$186 /mo · $2,230/yr
- Insurance
- −$49
- HOA
- −$0
- Vacancy / Maint / Mgmt
- −$280
- Net cashflow
- $201
Break-even live
Sensitivity live
| Price | -10% $267 | -5% $234 | +0% $201 | +5% $167 | +10% $134 |
|---|---|---|---|---|---|
| Rent | -10% $95 | -5% $148 | +0% $201 | +5% $253 | +10% $306 |
| Rate | -1.0pp $260 | -0.5pp $231 | base $201 | +0.5pp $170 | +1.0pp $139 |
UW: 25.0% down · 7.5% · 30yr · 1.5% tax · 5.0% vac · 8.0% maint · 8.0% mgmt
Financing live
Cash to close
- Down payment
- $29,500
- Closing costs
- $3,540
- Reserves months
- —
- Total cash needed
- —
Loan-product check · same deal, 3 products live
Conventional
25% down · 7.5% · 30yr
- Down + closing
- —
- Monthly P&I
- —
- Monthly cashflow
- —
- DSCR
- —
- Eligible?
- —
Personal DTI + credit; lowest rate.
DSCR
20% down · 8.5% · 30yr
- Down + closing
- —
- Monthly P&I
- —
- Monthly cashflow
- —
- DSCR
- —
- Eligible?
- —
No personal income docs; deal must DSCR.
Hard money
10% down · 12.0% · 12mo
- Down + closing
- —
- Monthly P&I
- —
- Monthly cashflow
- —
- DSCR
- —
- Eligible?
- —
Short-term bridge; refi at stabilization.
Rent comps 40 comps
| Address | Beds | Baths | Sqft | Rent | $/sqft | DOM | Units | Dist |
|---|---|---|---|---|---|---|---|---|
| 3031 Boulevard Pl Indianapolis, IN | 3.0 | 1.5 | 1395 | $1,450 | $1.04 | 19d | 1 | 0.02mi |
| 3017 Ethel Ave Indianapolis, IN | 3.0 | 1.5 | 1079 | $1,400 | $1.30 | 25d | 1 | 0.25mi |
| 2808 N Capitol Ave Indianapolis, IN | 2.0 | 1.0 | 900 | $975 | $1.08 | 25d | 1 | 0.31mi |
| 538 W 29th St Unit B Indianapolis, IN | 3.0 | 1.0 | 1031 | $1,349 | $1.31 | 0d | 1 | 0.34mi |
| 538 W 29th St Indianapolis, IN | 3.0 | 1.0 | 1132 | $1,349 | $1.19 | 25d | 1 | 0.34mi |
| 538 W 29th St Indianapolis, IN | 2.0 | 1.0 | 1132 | $1,099 | $0.97 | 0d | 1 | 0.34mi |
| 541 W 29th St Indianapolis, IN | 1.0 | 1.0 | 740 | $900 | $1.22 | 21d | 1 | 0.36mi |
| 516 W 28th St Indianapolis, IN | 2.0 | 1.0 | 1005 | $1,100 | $1.09 | 25d | 1 | 0.39mi |
| 560 Udell St Indianapolis, IN | 3.0 | 1.5 | 1176 | $1,190 | $1.01 | 25d | 1 | 0.40mi |
| 648 W 30th St Indianapolis, IN | 3.0 | 2.0 | 1300 | $1,500 | $1.15 | 25d | 1 | 0.44mi |
| 3413 N Capitol Ave Indianapolis, IN | 3.0 | 1.0 | 1176 | $1,249 | $1.06 | 12d | 1 | 0.49mi |
| 1 W 28th St Indianapolis, IN | 1.0 | 1.0 | 656 | $970 | $1.48 | 4d | 15 | 0.49mi |
| 3415 N Capitol Ave Indianapolis, IN | 3.0 | 1.0 | 1176 | $1,249 | $1.06 | 25d | 1 | 0.49mi |
| 3310 N Meridian St Indianapolis, IN | 1.0–2.0 | 1.0 | 750 | $1,150 | $1.53 | 45d | 3 | 0.49mi |
| 2901 N Talbott St Indianapolis, IN | 3.0 | 1.5 | 1388 | $1,400 | $1.01 | 0d | 1 | 0.56mi |
| 2901 N Talbott St Indianapolis, IN | 3.0 | 1.5 | 1388 | $1,400 | $1.01 | 45d | 1 | 0.56mi |
| 826 W 29th St Indianapolis, IN | 3.0 | 2.0 | 1200 | $1,595 | $1.33 | 45d | 1 | 0.56mi |
| 824 W 29th St Indianapolis, IN | 3.0 | 2.0 | 1200 | $1,595 | $1.33 | 45d | 1 | 0.57mi |
| 3469 Graceland Ave Indianapolis, IN | 2.0 | 1.0 | 1000 | $1,200 | $1.20 | 45d | 1 | 0.57mi |
| 143 W 35th St Indianapolis, IN | 3.0 | 1.0 | 1235 | $1,175 | $0.95 | 9d | 1 | 0.59mi |
| 2955 N Delaware St Indianapolis, IN | 3.0 | 1.5 | 1400 | $1,600 | $1.14 | 45d | 1 | 0.59mi |
| 2625 N Meridian St Indianapolis, IN | 1.0–2.0 | 1.0–2.0 | 850 | $2,150 | $2.53 | 9d | 8 | 0.60mi |
| 2801 N Talbott St Unit A Indianapolis, IN | 3.0 | 2.0 | 1296 | $1,850 | $1.43 | 45d | 1 | 0.60mi |
| 2813 N Talbott St Indianapolis, IN | 3.0 | 2.0 | 1297 | $1,800 | $1.39 | 45d | 1 | 0.60mi |
| 2923 N Delaware St Indianapolis, IN | 3.0 | 1.5 | 1320 | $1,350 | $1.02 | 0d | 1 | 0.60mi |
| 2925 N Delaware St Indianapolis, IN | 3.0 | 1.5 | 1322 | $1,275 | $0.96 | 25d | 1 | 0.60mi |
| 2809 N Talbott St Indianapolis, IN | 3.0 | 2.0 | 1250 | $1,750 | $1.40 | 45d | 1 | 0.61mi |
| 2805 N Talbott St Indianapolis, IN | 3.0 | 2.0 | 1296 | $1,800 | $1.39 | 45d | 1 | 0.61mi |
| 3457 N Illinois St Indianapolis, IN | 3.0 | 2.0 | 1230 | $1,145 | $0.93 | 25d | 1 | 0.61mi |
| 3502 N Kenwood Ave Indianapolis, IN | 3.0 | 2.0 | 1094 | $1,220 | $1.12 | 45d | 1 | 0.61mi |
| 3501 N Illinois St Unit 3 Indianapolis, IN | 2.0 | 2.0 | 1087 | $1,350 | $1.24 | 9d | 1 | 0.65mi |
| 321 E 31st St Indianapolis, IN | 3.0 | 1.0 | 1390 | $1,400 | $1.01 | 45d | 1 | 0.68mi |
| 926 W 32nd St Indianapolis, IN | 3.0 | 2.0 | 1050 | $1,295 | $1.23 | 9d | 1 | 0.68mi |
| 55 W Fall Creek Parkway South Dr Unit C Indianapolis, IN | 2.0 | 1.0 | 1000 | $1,035 | $1.03 | 45d | 1 | 0.68mi |
| 3540 N Meridian St Indianapolis, IN | 1.0 | 1.0 | 757 | $789 | $1.04 | 6d | 3 | 0.75mi |
| 3622 N Capitol Ave Indianapolis, IN | 3.0 | 1.0 | 1300 | $1,300 | $1.00 | 9d | 1 | 0.75mi |
| 2437 N Pennsylvania St Indianapolis, IN | 3.0 | 2.0 | 1400 | $1,650 | $1.18 | 25d | 1 | 0.76mi |
| 3217 Rader St Indianapolis, IN | 3.0 | 1.0 | 1200 | $1,299 | $1.08 | 45d | 1 | 0.77mi |
| 3541 N Meridian St Indianapolis, IN | 1.0–2.0 | 1.0 | 987 | $880 | $0.89 | 45d | 1 | 0.78mi |
| 3524 N Pennsylvania St Indianapolis, IN | 2.0 | 1.0 | 725 | $872 | $1.20 | 4d | 4 | 0.79mi |
Listing history 22 events
-
2026-06-21days on market $118,000 Active 55 DOM
-
2026-06-18days on market $118,000 Active 52 DOM
-
2026-06-17days on market $118,000 Active 51 DOM
-
2026-06-16days on market $118,000 Active 50 DOM
-
2026-06-15days on market $118,000 Active 49 DOM
-
2026-06-13days on market $118,000 Active 47 DOM
-
2026-06-13days on market $118,000 Active 46 DOM
-
2026-06-09days on market $118,000 Active 43 DOM
-
2026-06-08days on market $118,000 Active 42 DOM
-
2026-06-07days on market $118,000 Active 41 DOM
-
2026-06-03days on market $118,000 Active 37 DOM
-
2026-06-02days on market $118,000 Active 36 DOM
-
2026-06-01days on market $118,000 Active 35 DOM
-
2026-05-31days on market $118,000 Active 34 DOM
-
2026-05-12price $123,000 703-char remark
-
2026-04-27$133,000 Active 703-char remark
-
2020-09-14historical
-
2020-08-23status Pending
-
2020-08-15$68,000 Active
-
2016-08-13historical
-
2016-07-22price $21,000
-
2016-05-26$24,900 Active
ⓘ Source: listings_history table (triggers on properties + properties_extension) + one-shot
backfill from property_details.listing_events for pre-trigger history.
Tax reassessment forecast IN · Partial reset (capped growth)
- Current annual tax
- $2,230 · $186/mo
- Projected year-2 tax
- $2,230 · $186/mo
- Expected delta
- $0/yr ($0/mo · 0.0%)
ⓘ Screening estimate from a state-policy table — verify with the county assessor before closing.
Climate risk First Street
- Flood 6/10 Major FEMA zone X (unshaded) · 71% chance over 30 yrs
- Wildfire 1/10 Low
- Heat 4/10 Moderate 7 d/yr ≥101°F today · 19 d/yr by 30 yrs out
- Wind 2/10 Low 0% chance of damaging wind over 30 yrs
- Air quality 4/10 Moderate 5 unhealthy d/yr today · 7 by 30 yrs out
Nearby sold comps map
Loading sold comps map…
Walkable amenities ~0.75 mi
Loading nearby amenities…
Taxation est. · year 1
- Rental income
- $16,018
- − Mortgage interest
- −$6,610
- − Property taxes
- −$2,230
- − Insurance
- −$590
- − Repairs & maintenance
- −$1,281
- − Management
- −$1,281
- − Depreciation
- −$3,433
- Taxable income
- $592
- Est. tax owed @ 24.0%
- −$142
- After-tax cash flow
- $2,266/yr
For passive investors: Depreciation is non-cash, so a rental often shows a tax loss while cash-flowing — sheltering income. Rental losses are passive: they offset passive income freely, and up to $25,000/yr can offset ordinary (W-2) income if you actively participate and your MAGI is under $100k (phasing out to $0 by $150k); unused losses carry forward. On sale, claimed depreciation is recaptured at up to 25%, and gains may owe capital-gains tax (a 1031 exchange can defer both). Figures are a year-1 estimate at your 24.0% rate — not tax advice; consult a CPA.
Schools (NCES district)
- District
- Indianapolis Public Schools
- NCES district ID
- 1804770
- Math proficiency
- 14% ▼ -7.00%
- Reading proficiency
- 20% ▼ -3.00%
- Median HH income
- $32,034
- Composite
- 13.69/100
- National rank
- #9499
- State rank
- #286 of 301 in IN
Livability — Indianapolis city (balance)
No livability data for this city. (Only ~50 U.S. cities are tracked.)
Census & demographics
- Census place
- Indianapolis city (balance), IN
- County
- Marion County · 998,460 people
- City population
- 881,119
- Metro
- Indianapolis-Carmel-Anderson, IN
- Population (ZIP)
- 22,379
- Household income
- $60,062
- Rent vs Own
- Severe rent burden
- 978.0
Population outlook (Marion County) Hauer SSP2
- Today (2025)
- 1,025,572 people
- By 2030
- 1,065,727 · +3.9%
- By 2040
- 1,141,577 · +11.3%
- By 2050
- 1,208,920 · +17.9%
- By 2075
- 1,367,288 · +33.3%
- By 2100
- 1,438,201 · +40.2%
Race, ethnicity, and origin ACS 2023
- Neighborhood character
- Diverse neighborhood (Simpson 0.62)
- Race & ethnicity
- White 46% Black 40% Hispanic / Latino 8% Two or more races 6% Asian 2%
- Hispanic origin (detail)
- Mexican 4%
- Common ancestry
- Romanian 2% Slovak 2% Italian 1%
- Foreign-born
- 4% · Canada
- Languages at home
- 93% English-only · Spanish 5% French/Haitian/Cajun 1% Other Indo-European 1%
Political lean MEDSL · Marion
- 2024 margin
- Strong D (+27.7) · D 63.0% · R 35.3% · Other 1.7%
- 2008→2024 swing
- -0.7pp no change · 2008: 28.4pp · 2024: 27.7pp
- All cycles
- 2024: D+27.7 2020: D+29.1 2016: D+22.8 2012: D+22.2 2008: D+28.4
Not yet ingested
- Civics
- —
Market trends
- HPI YoY
- ▼ -324.63%
- Current HPI
- 319.7725
- Rent YoY
- ▲ 6.43%
- Metro
- Indianapolis-Carmel-Anderson, IN
- State GDP YoY
- ▲ 2.90%
- F500 in state
- 18
Industry mix (Fortune 500 HQ in IN)
| Industry | F500 HQs | Revenue |
|---|---|---|
| Industrial Machinery | 2 | $37B |
|
||
| Healthcare | 1 | $177B |
|
||
| Pharmaceuticals | 1 | $45B |
|
||
| Metals / Steel | 1 | $18B |
|
||
| Agriculture | 1 | $17B |
|
||
| Packaging | 1 | $12B |
|
||
Price history
+373.9% since first listed9 events — show timeline
- 2026-05-26 Price Changed $118,000 MIBOR as Distributed by MLS Grid
- 2026-05-12 Price Changed $123,000 MIBOR as Distributed by MLS Grid
- 2026-04-27 Listed $133,000 MIBOR as Distributed by MLS Grid
- 2020-09-14 Listing Removed — MIBOR as Distributed by MLS Grid
- 2020-08-23 Pending — MIBOR as Distributed by MLS Grid
- 2020-08-15 Listed $68,000 MIBOR as Distributed by MLS Grid
- 2016-08-13 Listing Removed — MIBOR as Distributed by MLS Grid
- 2016-07-22 Price Changed $21,000 MIBOR as Distributed by MLS Grid
- 2016-05-26 Listed $24,900 MIBOR as Distributed by MLS Grid
Property tax history
+20.9%/yrLatest (2025): $2,230 · +5.9% YoY. Source: county tax records.
Cash-flow waterfall
monthlySold comps — $/sqft
last 12 mo · ≤1 miLoading sold comps…