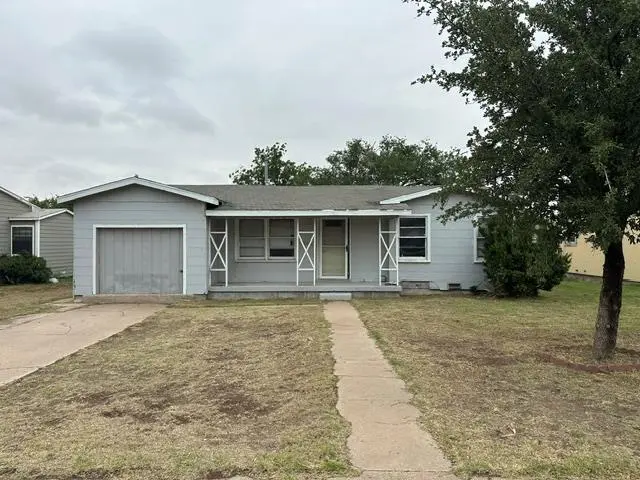
2707 E 31st St · Odessa, TX
Flood risk 1/10 · Minimal
- FEMA flood zone
- X (unshaded)
- Chance of flooding over 30 yrs
- 0.0%
- Est. flood insurance / yr
- $507 – $1,088
Fire risk 2/10 · Minimal
- Est. fire insurance / yr
- $1,222 – $2,270
Heat risk 6/10 · Moderate
- Hot days now (above 101°F)
- 7 days/yr
- Hot days in 30 yrs
- 22 days/yr
Wind risk 2/10 · Minimal
- Chance of severe wind over 30 yrs
- 3.0%
Air-quality risk 1/10 · Minimal
- Unhealthy air days now
- 0 days/yr
- Unhealthy air days in 30 yrs
- 0 days/yr
Risk factors via First Street. Map © Google.
Why this score? — see what drove the B- grade
The composite is a weighted blend of 9 inputs, each scored 0–100. Each bar is that input's sub-score; the figure is the points it added to the 100-point composite (weight × sub-score).
- Cash flow +28.0/30.0
- DSCR +9.9/10.0
- 1% rule +8.5/10.0
- ARV discount +7.5/15.0
- Livability +3.8/5.0
- Rent growth +2.8/5.0
- Condition / age +2.5/5.0
- Schools +2.2/10.0
- Appreciation +0.0/10.0
$137,000
🖨 Deal sheet 📄 Offer letter ✓ Due diligence
Listing remarks
3 bedroom home that's ready for a new owner with a new vision! Nice layout w/ living area in front plus an oversized flex room that can be used as den/gameroom/play area. Separate formal area. Large backyard!
Key facts
- Large backyard
- Oversized flex room
- 0.26 acre lot
Tags
Property features AI
Exterior
- Parking: Parking pad
- Utilities: Public water; Public sewer; Propane available
- Home design: Single-family residence; Residential property
- Construction: Composition roof; Pillar/post/pier foundation; Built on 0.264-acre lot
- Exterior features: Paved road access; Solar energy generation
Interior
- Flooring: Vinyl flooring; Other flooring
- Bathrooms: 1 full bathroom; 1 half bathroom
- Heating & cooling: Natural gas heating; Electric cooling
- Interior features: Gas water heater; No fireplace
Neighborhood map
What this means for you Summary
Snapshot
- This is a 3-bed/1.5-bath single-family listed at $137k.
Deal economics
- At list price, monthly cash flow is $426 ($5k/yr) — positive.
- The deal already cash-flows at list — no discount required.
- Meets the 1% rule at list price ($2k rent vs $137k).
- Recommended offer: $135k (1.5% below list) — sets the bar for market timing.
Location & tenants
- Location reads 75/100 on livability (#132 in TX, #3,928 nationally) — a middle-class / working-renter tenant base. Strengths: cost of living A+, housing A+, health & safety A+; Watch: commute D+, amenities D.
- Ector County ISD (urban): math 22% / reading 27% proficiency, ranked #707 of 826 in TX (top 86%) — low school quality limits family demand, transient renter base, plan for 1-2y turnover.
- Zoned schools: Dowling El (math 22% / reading 22%, grade F, #3,333 of 4,322 statewide, top 80%, 440 students, 88% FRL); Bonham Middle (math 9% / reading 16%, grade F, #1,616 of 1,662 statewide, top 97%, 867 students, 65% FRL); Permian H S (math 19% / reading 29%, grade F, #1,333 of 1,632 statewide, top 82%, 3,978 students, 51% FRL).
- Market conditions: Rents rising (+1.4%/yr); 263 active listings in the ZIP; 40 comparable units currently listed for rent nearby; rentals at typical pace (median 21d on market — plan ~3-4 weeks tenant-placement turnaround); solid renter incomes; 1,004 units permitted in Ector County in 2024 (0 in 5+ unit buildings).
Forward outlook
- Local home prices are declining (-3.0%/yr); year-one equity from $947 of loan paydown is wiped out by about $4k of value loss. Plan a longer hold.
- Ector County population projected at +78% by 2050 — long-run rental-demand tailwind backs the buy-and-hold thesis.
Negotiation context
- It's been on market 29 days — a 2% lower offer ($135k) is reasonable based on typical stale-listing flexibility.
Risks & watch-outs
- Watch-outs: built in 1951 — expect roof / HVAC / electrical / plumbing capex.
- Climate carrying-cost: extreme-heat days projected 7→22/yr by 2055 (HVAC capex compounding) — expect insurance premiums to compound above CPI over the hold.
Questions for the listing agent
- Built in 1951 — when were the roof, HVAC, electrical panel, plumbing, and water heater last replaced?
- Is there a deadline driving the sale (1031 exchange, divorce, estate, relocation)? That informs how much negotiation room exists.
- Schools are F-rated, which usually means shorter tenancies and higher turnover. Who's the typical renter profile here, and what's been the actual vacancy rate?
- What's the average days-on-market for RENTAL listings here right now (not sales)? A rising rental-DOM trend means longer vacancies and softer asking-rent achievability than the comps imply.
- What's the recent tenant-quality profile in this submarket — average credit score on applications, eviction rate, late-payment / NSF rate, and stable-employment percentage? A property-management company in the area should have these aggregated.
- How much new for-sale + rental construction is in the pipeline within 1–3 miles? Heavy new supply typically softens prices + rents 12–24 months out; constrained supply supports both.
Investment metrics
- 1% rule
- 1.35% ✓
- Cap rate
- 10.03%
- Cash-on-cash
- 13.33%
- DSCR
- 1.59
- GRM
- 6.2
CMA / ARV
No comps found within radius.
Projected returns pro-forma
-3.0% appreciation · 1.36% rent growth · sell at horizon
- IRR
- 1.4%
- Equity multiple
- 1.05×
- Total profit
- $2,013
- Equity at exit
- $20,427
- IRR
- 9.2%
- Equity multiple
- 1.65×
- Total profit
- $25,083
- Equity at exit
- $11,845
Cash invested: $38,360 (down + closing). Projections, not guarantees.
Landlord ↔ Tenant lean methodology
- Overall (STATE)
- 87 Strongly Landlord-Friendly
- State Texas
- 87 Strongly Landlord-Friendly · R+5
- County
- — inherits STATE
- City
- — inherits STATE
ZIP-level market 79762
- Rents YoY
- 1.4%
- Active inventory
- 263
- Price-to-rent
- 6.2×
Monthly cashflow live
- Estimated rent
- $1,856 high interval (Pro) →
- Mortgage (P&I)
- −$718
- Tax from tax record
- −$265 /mo · $3,176/yr
- Insurance
- −$57
- HOA
- −$0
- Vacancy / Maint / Mgmt
- −$390
- Net cashflow
- $426
Break-even live
UW: 25.0% down · 7.5% · 30yr · 1.5% tax · 5.0% vac · 8.0% maint · 8.0% mgmt
Financing live
Cash to close
- Down payment
- $34,250
- Closing costs
- $4,110
- Reserves months
- —
- Total cash needed
- —
Loan-product check · same deal, 3 products live
Conventional
25% down · 7.5% · 30yr
- Down + closing
- —
- Monthly P&I
- —
- Monthly cashflow
- —
- DSCR
- —
- Eligible?
- —
Personal DTI + credit; lowest rate.
DSCR
20% down · 8.5% · 30yr
- Down + closing
- —
- Monthly P&I
- —
- Monthly cashflow
- —
- DSCR
- —
- Eligible?
- —
No personal income docs; deal must DSCR.
Hard money
10% down · 12.0% · 12mo
- Down + closing
- —
- Monthly P&I
- —
- Monthly cashflow
- —
- DSCR
- —
- Eligible?
- —
Short-term bridge; refi at stabilization.
Rent comps 40 comps
| Address | Beds | Baths | Sqft | Rent | $/sqft | DOM | Units | Dist |
|---|---|---|---|---|---|---|---|---|
| 2702 S Colonial Dr Odessa, TX | 3.0 | 1.0 | 1490 | $1,500 | $1.01 | 13d | 1 | 0.14mi |
| 2826 Hilltop Dr Odessa, TX | 4.0 | 2.0 | 1307 | $2,000 | $1.53 | 13d | 1 | 0.36mi |
| 1212 E Century Ave Odessa, TX | 3.0 | 1.0 | 1359 | $1,300 | $0.96 | 21d | 1 | 0.37mi |
| 3009 N Century Ave Odessa, TX | 3.0 | 2.0 | 1909 | $2,600 | $1.36 | 43d | 1 | 0.46mi |
| 3624 Walnut Ave Odessa, TX | 3.0 | 1.0 | 1488 | $1,950 | $1.31 | 43d | 1 | 0.50mi |
| 1401 E 18th St Odessa, TX | 3.0 | 2.0 | 1690 | $2,000 | $1.18 | 13d | 1 | 0.55mi |
| 2901 Nabors Ln Odessa, TX | 3.0 | 1.0 | 1508 | $1,800 | $1.19 | 13d | 1 | 0.56mi |
| 2901 Nabors Ln Odessa, TX | 3.0 | 1.0 | 1374 | $1,800 | $1.31 | 21d | 1 | 0.56mi |
| 2905 Byron Ave Odessa, TX | 3.0 | 2.0 | 1816 | $2,400 | $1.32 | 13d | 1 | 0.74mi |
| 1202 E 42nd St Odessa, TX | 3.0 | 1.0 | 1100 | $1,650 | $1.50 | 43d | 1 | 0.74mi |
| 1308 Alpine St Odessa, TX | 3.0 | 2.0 | 1800 | $2,195 | $1.22 | 13d | 1 | 0.81mi |
| 4207 Dakota Ave Odessa, TX | 3.0 | 2.0 | 1904 | $2,300 | $1.21 | 43d | 1 | 0.90mi |
| 1706 Emerald Ave Odessa, TX | 3.0 | 2.0 | 1992 | $2,500 | $1.26 | 43d | 1 | 0.94mi |
| 2801 Redbud Ave Odessa, TX | 3.0 | 2.0 | 1558 | $1,800 | $1.16 | 13d | 1 | 0.95mi |
| 1709 Byron Ave Odessa, TX | 3.0 | 2.0 | 1981 | $1,975 | $1.00 | 43d | 1 | 0.96mi |
| 1513 E 11th St Odessa, TX | 3.0 | 2.0 | 1728 | $3,300 | $1.91 | 43d | 1 | 1.04mi |
| 3420 Fairlane Ave Odessa, TX | 3.0 | 2.0 | 2164 | $2,100 | $0.97 | 21d | 1 | 1.09mi |
| 237 Orchard Dr Odessa, TX | 4.0 | 2.0 | 1768 | $2,000 | $1.13 | 13d | 1 | 1.11mi |
| 1220 Adams Ave Unit 4 Odessa, TX | 4.0 | 1.0 | 1063 | $1,750 | $1.65 | 43d | 1 | 1.11mi |
| 4233 Bonham Ave Odessa, TX | 3.0 | 2.0 | 1144 | $1,600 | $1.40 | 43d | 1 | 1.22mi |
| 4217 Redbud Ave Odessa, TX | 3.0 | 1.5 | 1203 | $2,200 | $1.83 | 13d | 1 | 1.23mi |
| 1012 Adams Ave Unit C2BBUILDING C Odessa, TX | 4.0 | 1.0 | 1066 | $1,750 | $1.64 | 43d | 1 | 1.25mi |
| 1012 Adams Ave Unit C1BBUILDING C Odessa, TX | 4.0 | 1.0 | 1066 | $1,800 | $1.69 | 43d | 1 | 1.25mi |
| 3812 E Everglade Ave Odessa, TX | 3.0 | 2.0 | 1861 | $2,500 | $1.34 | 21d | 1 | 1.25mi |
| 3800 N Golder Ave Odessa, TX | 3.0 | 2.0 | 1050 | $1,600 | $1.52 | 21d | 1 | 1.27mi |
| 1315 N Jackson Ave Odessa, TX | 3.0 | 2.0 | 1216 | $1,500 | $1.23 | 13d | 1 | 1.29mi |
| 2608 Cumberland Rd Odessa, TX | 2.0 | 2.0 | 1404 | $1,500 | $1.07 | 13d | 1 | 1.29mi |
| 4256 Bonham Ave Odessa, TX | 3.0 | 2.0 | 1261 | $1,600 | $1.27 | 21d | 1 | 1.30mi |
| 1813 Petroleum Dr Odessa, TX | 3.0 | 2.0 | 1299 | $1,700 | $1.31 | 21d | 1 | 1.38mi |
| 3824 Englewood Cir Odessa, TX | 2.0 | 1.5 | 1150 | $1,295 | $1.13 | 13d | 1 | 1.39mi |
| 3902 Englewood Cir Odessa, TX | 2.0 | 1.5 | 1280 | $1,445 | $1.13 | 13d | 1 | 1.39mi |
| 3904 Englewood Cir Odessa, TX | 2.0 | 1.0 | 1280 | $1,445 | $1.13 | 13d | 1 | 1.41mi |
| 701 Hillcrest Ave Odessa, TX | 3.0 | 2.0 | 1344 | $1,400 | $1.04 | 43d | 1 | 1.42mi |
| 3907 Englewood Cir Odessa, TX | 2.0 | 1.5 | 1170 | $1,395 | $1.19 | 13d | 1 | 1.43mi |
| 1604 N Sam Houston Ave Odessa, TX | 2.0 | 1.0 | 1142 | $2,000 | $1.75 | 43d | 1 | 1.44mi |
| 3509 N Golder Ave Odessa, TX | 3.0 | 2.0 | 1216 | $1,700 | $1.40 | 13d | 1 | 1.45mi |
| 3616 E 30th St Odessa, TX | 3.0 | 2.0 | 1436 | $1,995 | $1.39 | 43d | 1 | 1.45mi |
| 3802 Englewood Cir Odessa, TX | 2.0 | 1.5 | 1150 | $1,295 | $1.13 | 13d | 1 | 1.46mi |
| 1119 E 51st St Odessa, TX | 2.0 | 1.5 | 1169 | $1,500 | $1.28 | 13d | 1 | 1.46mi |
| 1322 N Lincoln Ave Odessa, TX | 3.0 | 1.0 | 1218 | $2,100 | $1.72 | 21d | 1 | 1.48mi |
Listing history 17 events
-
2026-06-19days on market $137,000 Active 29 DOM
-
2026-06-18days on market $137,000 Active 28 DOM
-
2026-06-17days on market $137,000 Active 27 DOM
-
2026-06-16days on market $137,000 Active 26 DOM
-
2026-06-15days on market $137,000 Active 25 DOM
-
2026-06-14days on market $137,000 Active 23 DOM
-
2026-06-13days on market $137,000 Active 22 DOM
-
2026-06-10days on market $137,000 Active 20 DOM
-
2026-06-09days on market $137,000 Active 19 DOM
-
2026-06-08days on market $137,000 Active 18 DOM
-
2026-06-07days on market $137,000 Active 17 DOM
-
2026-06-03days on market $137,000 Active 12 DOM
-
2026-06-01days on market $137,000 Active 11 DOM
-
2026-05-31days on market $137,000 Active 10 DOM
-
2026-05-30days on market $137,000 Active 9 DOM
-
2026-05-21$137,000 Active
-
1992-09-01soldstatus
ⓘ Source: listings_history table (triggers on properties + properties_extension) + one-shot
backfill from property_details.listing_events for pre-trigger history.
Tax reassessment forecast TX · Resets to sale price
- Current annual tax
- $3,176 · $265/mo
- Projected year-2 tax
- $3,176 · $265/mo
- Expected delta
- $0/yr ($0/mo · 0.0%)
ⓘ Screening estimate from a state-policy table — verify with the county assessor before closing.
Climate risk First Street
- Flood 1/10 Low FEMA zone X (unshaded) · 0% chance over 30 yrs
- Wildfire 2/10 Low
- Heat 6/10 Major 7 d/yr ≥101°F today · 22 d/yr by 30 yrs out
- Wind 2/10 Low 3% chance of damaging wind over 30 yrs
- Air quality 1/10 Low 0 unhealthy d/yr today · 0 by 30 yrs out
Nearby sold comps map
Loading sold comps map…
Walkable amenities ~0.75 mi
Loading nearby amenities…
Taxation est. · year 1
- Rental income
- $22,273
- − Mortgage interest
- −$7,674
- − Property taxes
- −$3,176
- − Insurance
- −$685
- − Repairs & maintenance
- −$1,782
- − Management
- −$1,782
- − Depreciation
- −$3,985
- Taxable income
- $3,189
- Est. tax owed @ 24.0%
- −$765
- After-tax cash flow
- $4,348/yr
For passive investors: Depreciation is non-cash, so a rental often shows a tax loss while cash-flowing — sheltering income. Rental losses are passive: they offset passive income freely, and up to $25,000/yr can offset ordinary (W-2) income if you actively participate and your MAGI is under $100k (phasing out to $0 by $150k); unused losses carry forward. On sale, claimed depreciation is recaptured at up to 25%, and gains may owe capital-gains tax (a 1031 exchange can defer both). Figures are a year-1 estimate at your 24.0% rate — not tax advice; consult a CPA.
Schools (NCES district)
- District
- Ector County ISD
- NCES district ID
- 4818000
- Math proficiency
- 22% ▼ -9.00%
- Reading proficiency
- 27% ▼ -4.00%
- Median HH income
- $52,740
- Composite
- 21.89/100
- National rank
- #8233
- State rank
- #707 of 826 in TX
Livability — Odessa
- Score
- 75/100
- State rank
- #132
- US rank
- #3928
Category grades
Schools grade is shown separately in the Schools card above.
Census & demographics
- Census place
- Odessa, TX
- County
- Ector County · 131,169 people
- City population
- 131,169
- Metro
- Odessa, TX
- Population (ZIP)
- 39,927
- Household income
- $75,272
- Rent vs Own
- Severe rent burden
- 1477.0
Population outlook (Ector County) Hauer SSP2
- Today (2025)
- 212,765 people
- By 2030
- 241,962 · +13.7%
- By 2040
- 306,582 · +44.1%
- By 2050
- 379,755 · +78.5%
- By 2075
- 568,991 · +167.4%
- By 2100
- 709,829 · +233.6%
Race, ethnicity, and origin ACS 2023
- Neighborhood character
- Diverse neighborhood (Simpson 0.58)
- Race & ethnicity
- Hispanic / Latino 52% White 38% Two or more races 22% Black 6% Asian 2% Native American 1%
- Hispanic origin (detail)
- Mexican 45% Cuban 3%
- Common ancestry
- Slovak 1% Lithuanian 1% Italian 1%
- Foreign-born
- 12% · Canada, Vietnam
- Languages at home
- 68% English-only · Spanish 30%
Political lean MEDSL · Ector
- 2024 margin
- Solid R (+52.9) · D 23.2% · R 76.1%
- 2008→2024 swing
- -4.9pp toward R · 2008: -48.0pp · 2024: -52.9pp
- All cycles
- 2024: R+52.9 2020: R+47.8 2016: R+40.6 2012: R+48.9 2008: R+48.0
Not yet ingested
- Civics
- —
Market trends
- HPI YoY
- ▼ -194.97%
- Current HPI
- 229.6022
- Rent YoY
- ▲ 1.36%
- Metro
- Odessa, TX
- State GDP YoY
- ▲ 3.95%
- F500 in state
- 110
Industry mix (Fortune 500 HQ in TX)
| Industry | F500 HQs | Revenue |
|---|---|---|
| Energy | 16 | $1,198B |
|
||
| Technology | 5 | $198B |
|
||
| Engineering / Construction | 4 | $72B |
|
||
| Energy Services | 3 | $60B |
|
||
| Utilities | 3 | $41B |
|
||
| Healthcare | 2 | $330B |
|
||
Price history
2 events — show timeline
- 2026-05-21 Listed $137,000 ODMLS
- 1992-09-01 Sold (Public Records) — Public Records
Property tax history
+5.1%/yrLatest (2025): $3,176 · +4.3% YoY. Source: county tax records.
Cash-flow waterfall
monthlySold comps — $/sqft
last 12 mo · ≤1 miLoading sold comps…