 Duplex
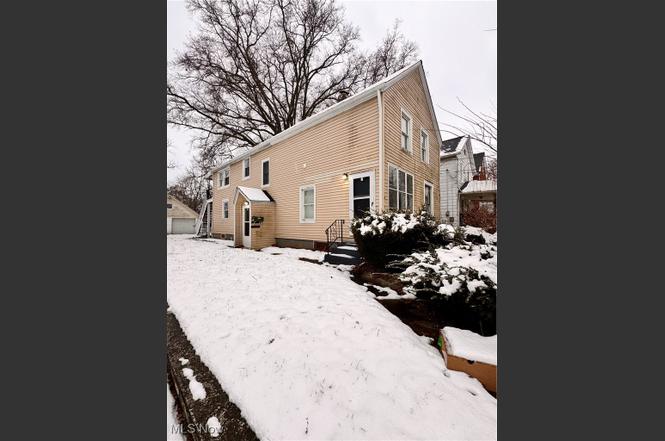
338 17th St · Elyria, OH
Flood risk 1/10 · Minimal
- FEMA flood zone
- X (unshaded)
- Chance of flooding over 30 yrs
- 0.0%
- Est. flood insurance / yr
- $507 – $1,088
Fire risk 1/10 · Minimal
- Est. fire insurance / yr
- $713 – $1,323
Heat risk 3/10 · Minor
- Hot days now (above 98°F)
- 7 days/yr
- Hot days in 30 yrs
- 16 days/yr
Wind risk 1/10 · Minimal
- Chance of severe wind over 30 yrs
- —
Air-quality risk 3/10 · Minor
- Unhealthy air days now
- 2 days/yr
- Unhealthy air days in 30 yrs
- 4 days/yr
Risk factors via First Street. Map © Google.
Why this score? — see what drove the B- grade
The composite is a weighted blend of 9 inputs, each scored 0–100. Each bar is that input's sub-score; the figure is the points it added to the 100-point composite (weight × sub-score).
- Cash flow +30.0/30.0
- DSCR +10.0/10.0
- 1% rule +9.5/10.0
- ARV discount +5.3/15.0
- Rent growth +4.2/5.0
- Livability +3.8/5.0
- Condition / age +3.8/5.0
- Schools +2.4/10.0
- Appreciation +0.0/10.0
$125,000
🖨 Deal sheet 📄 Offer letter ✓ Due diligence
Multi-family units
County records classify this as Multi-Family (2-4 Unit). Listing-text estimate: 2 units. confirmed
Listing remarks
Turnkey duplex in the heart of South Elyria, ideally located near UH Elyria Medical Center, EMH Hospital, LCCC, and major commuter routes. Perfect for strong, reliable rental demand. The entire property has been updated with a clean, modern feel, featuring neutral paint, new LVP flooring, refreshed kitchens, and baths enhanced with custom tile work for a polished finish. Unit 1 offers 3 beds/1 bath - 1 bed on main and 2 beds up. Unit 2 features 2 beds/1 bath. Major improvements include a new roof and gutters (Jan 2025) and a new downstairs furnace (Jan 2025). Property also includes an oversized 2-car garage. A stylish, low-maintenance investment opportunity in a high-demand rental corridor.
Key facts
- Updated property
- Refreshed kitchens
- Turnkey duplex
Tags
Neighborhood map
What this means for you Summary
Snapshot
- This is a 2 × 2-bed/1.0-bath units multifamily listed at $125k. Condition is rated good.
Deal economics
- At list price, monthly cash flow is $566 ($7k/yr) — positive. Per door: $283/mo.
- The deal already cash-flows at list — no discount required.
- Meets the 1% rule at list price ($2k rent vs $125k).
- Recommended offer: $118k (6.0% below list) — sets the bar for market timing.
- Cap rate 11.7% vs local median 3.8% in Elyria — top-decile yield for the area; either an underpriced asset or a hidden risk that comps aren't pricing in. Stress-test before assuming the spread holds.
Location & tenants
- Location reads 75/100 on livability (#243 in OH, #3,869 nationally) — a middle-class / working-renter tenant base. Strengths: cost of living A+, housing A+, health & safety A; Watch: schools C-, employment D, commute F.
- Elyria City Schools (urban): math 21% / reading 37% proficiency, ranked #586 of 656 in OH (top 89%) — low school quality limits family demand, transient renter base, plan for 1-2y turnover.
- Market conditions: Rents rising fast (+6.7%/yr); 356 active listings in the ZIP; 2 comparable units currently listed for rent nearby; 1,098 units permitted in Lorain County in 2024 (20 in 5+ unit buildings).
- This rent runs 39% of the median local income ($56k/yr) — at the standard rent-burdened threshold; future hikes will face affordability resistance.
Forward outlook
- Local home prices are declining (-3.0%/yr); year-one equity from $864 of loan paydown is wiped out by about $4k of value loss. Plan a longer hold.
- At projected returns (-3.0% appreciation + 6.7% rent growth), your $35k cash investment doubles in ~6 years — after that, you're playing with house money.
Negotiation context
- It's been on market 71 days — a 6% lower offer ($118k) is reasonable based on typical stale-listing flexibility.
- 2 sale attempts; this cycle's ask has dropped $10k (7%) from the opening price — seller is motivated, your offer sets the floor, not the list.
Risks & watch-outs
- Watch-outs: built in 1900 — expect roof / HVAC / electrical / plumbing capex.
Questions for the listing agent
- It's been on market 71 days. Have you received any prior offers? Is the seller open to a 6% concession, seller financing, or rate buy-down credit?
- Can we see the unit-by-unit rent roll, current vacancy, and any below-market leases? What's the average tenancy length?
- What capital expenditures (roof, boiler, parking lot, exteriors) have been made in the last 5 years, and what's planned in the next 2?
- Built in 1900 — when were the roof, HVAC, electrical panel, plumbing, and water heater last replaced?
- Why hasn't it sold? Are there any deal-killer items the seller is aware of (foundation, flood, title, zoning, code violations)?
- Is there a deadline driving the sale (1031 exchange, divorce, estate, relocation)? That informs how much negotiation room exists.
- What's the average days-on-market for RENTAL listings here right now (not sales)? A rising rental-DOM trend means longer vacancies and softer asking-rent achievability than the comps imply.
- What's the recent tenant-quality profile in this submarket — average credit score on applications, eviction rate, late-payment / NSF rate, and stable-employment percentage? A property-management company in the area should have these aggregated.
- How much new apartment / multifamily construction is in the pipeline within 1–3 miles? Heavy new supply (>2% of stock underway) typically softens rents 12–24 months out; light construction supports rent growth.
Investment metrics
- 1% rule
- 1.45% ✓
- Cap rate
- 11.73%
- Cash-on-cash
- 19.41%
- DSCR
- 1.86
- GRM
- 5.8
CMA / ARV
- ARV (on-the-fly)
- $119,280
- Comps found
- 5
Show comp detail 5 sales within ~0.75 mi
| Address | Dist | Beds/Ba | Sqft | Sold | Price | $/sf | Match |
|---|---|---|---|---|---|---|---|
| 338 17th St | 0.00mi | 5/2.0 (+1) | 1,680 (0%) | 1mo | $127,000 | $76 | 94 |
| 312 16th St | 0.07mi | 4/2.0 | 1,632 (-3%) | 9mo | $129,900 | $80 | 84 |
| 1406 Middle Ave | 0.20mi | 3/2.0 (-1) | 1,618 (-4%) | 15mo | $65,000 | $40 | 67 |
| 804 West Ave | 0.60mi | 3/2.0 (-1) | 1,591 (-5%) | 12mo | $28,000 | $18 | 48 |
| 802 East Ave | 0.66mi | 3/2.0 (-1) | 1,498 (-11%) | 22mo | $105,900 | $71 | 28 |
Match score weights: distance 35% · size 25% · config 20% · recency 20%. Top-matched comps best support the ARV.
Projected returns pro-forma
-3.0% appreciation · 6.74% rent growth · sell at horizon
- IRR
- 15.6%
- Equity multiple
- 1.65×
- Total profit
- $22,891
- Equity at exit
- $18,638
- IRR
- 26.8%
- Equity multiple
- 3.79×
- Total profit
- $97,789
- Equity at exit
- $10,808
Cash invested: $35,000 (down + closing). Projections, not guarantees.
Landlord ↔ Tenant lean methodology
- Overall (STATE)
- 73 Landlord-Friendly
- State Ohio
- 73 Landlord-Friendly · R+6
- County
- — inherits STATE
- City
- — inherits STATE
ZIP-level market 44035
- Rents YoY
- 6.7%
- Active inventory
- 356
- Price-to-rent
- 11.5×
Monthly cashflow live
- Estimated rent
- $1,810 high interval (Pro) →
- Mortgage (P&I)
- −$656
- Tax est. 1.5%
- −$156 /mo · $1,875/yr
- Insurance
- −$52
- HOA
- −$0
- Vacancy / Maint / Mgmt
- −$380
- Net cashflow
- $566
Break-even live
2-unit breakdown (identical units grouped — click to expand)
| Units | Beds | Baths | Est. rent |
|---|---|---|---|
| 2× units | 2 | 1 | $1,810 |
| #1 | 2 | 1 | $905 |
| #2 | 2 | 1 | $905 |
| Total (2 units) | $1,810 | ||
UW: 25.0% down · 7.5% · 30yr · 1.5% tax · 5.0% vac · 8.0% maint · 8.0% mgmt
Financing live
Cash to close
- Down payment
- $31,250
- Closing costs
- $3,750
- Reserves months
- —
- Total cash needed
- —
Loan-product check · same deal, 3 products live
Conventional
25% down · 7.5% · 30yr
- Down + closing
- —
- Monthly P&I
- —
- Monthly cashflow
- —
- DSCR
- —
- Eligible?
- —
Personal DTI + credit; lowest rate.
DSCR
20% down · 8.5% · 30yr
- Down + closing
- —
- Monthly P&I
- —
- Monthly cashflow
- —
- DSCR
- —
- Eligible?
- —
No personal income docs; deal must DSCR.
Hard money
10% down · 12.0% · 12mo
- Down + closing
- —
- Monthly P&I
- —
- Monthly cashflow
- —
- DSCR
- —
- Eligible?
- —
Short-term bridge; refi at stabilization.
Rent comps 2 comps
| Address | Beds | Baths | Sqft | Rent | $/sqft | DOM | Units | Dist |
|---|---|---|---|---|---|---|---|---|
| 222 Georgia Ave Elyria, OH | 3.0 | 2.5 | 1850 | $1,750 | $0.95 | 2d | 1 | 0.68mi |
| 10425 Middle Ave Elyria, OH | 3.0–4.0 | 2.0 | 1424 | $1,469 | $1.03 | 2d | 1 | 0.87mi |
Listing history 5 events
-
2026-04-13status Pending
-
2026-03-17price $125,000
-
2026-02-19status Active
-
2026-01-08status Pending
-
2025-12-22$135,000 Active
ⓘ Source: listings_history table (triggers on properties + properties_extension) + one-shot
backfill from property_details.listing_events for pre-trigger history.
Climate risk First Street
- Flood 1/10 Low FEMA zone X (unshaded) · 0% chance over 30 yrs
- Wildfire 1/10 Low
- Heat 3/10 Moderate 7 d/yr ≥98°F today · 16 d/yr by 30 yrs out
- Wind 1/10 Low
- Air quality 3/10 Moderate 2 unhealthy d/yr today · 4 by 30 yrs out
Nearby sold comps map
Loading sold comps map…
Walkable amenities ~0.75 mi
Loading nearby amenities…
Taxation est. · year 1
- Rental income
- $21,720
- − Mortgage interest
- −$7,002
- − Property taxes
- −$1,875
- − Insurance
- −$625
- − Repairs & maintenance
- −$1,738
- − Management
- −$1,738
- − Depreciation
- −$3,636
- Taxable income
- $5,106
- Est. tax owed @ 24.0%
- −$1,226
- After-tax cash flow
- $5,567/yr
For passive investors: Depreciation is non-cash, so a rental often shows a tax loss while cash-flowing — sheltering income. Rental losses are passive: they offset passive income freely, and up to $25,000/yr can offset ordinary (W-2) income if you actively participate and your MAGI is under $100k (phasing out to $0 by $150k); unused losses carry forward. On sale, claimed depreciation is recaptured at up to 25%, and gains may owe capital-gains tax (a 1031 exchange can defer both). Figures are a year-1 estimate at your 24.0% rate — not tax advice; consult a CPA.
Condition & rehab AI · 14 photos
This turnkey duplex is in excellent condition with recent updates, including a new roof, furnace, and interior finishes. It's located in a high-demand rental corridor, making it a solid investment opportunity.
Value-add opportunities
- Both Paint touch-ups — Enhances curb appeal and interior aesthetics.
- Both Landscaping improvements — Enhances curb appeal and adds value for both resale and rental.
Renovation cost estimate screening
Value-add ROI direction
- Both Paint touch-ups — Enhances curb appeal and interior aesthetics. ↑
- Both Landscaping improvements — Enhances curb appeal and adds value for both resale and rental. ↑
ⓘ Cost ranges are severity-bucket heuristics (US national rule-of-thumb). Get contractor quotes + a written scope before underwriting a rehab budget.
Schools (NCES district)
- District
- Elyria City Schools
- NCES district ID
- 3904394
- Math proficiency
- 21% ▼ -25.00%
- Reading proficiency
- 37% ▼ -15.00%
- Median HH income
- $40,992
- Composite
- 24.45/100
- National rank
- #7670
- State rank
- #586 of 656 in OH
Livability — Elyria
- Score
- 75/100
- State rank
- #243
- US rank
- #3869
Category grades
Schools grade is shown separately in the Schools card above.
Census & demographics
- Census place
- Elyria, OH
- County
- Lorain County · 219,437 people
- City population
- 62,179
- Metro
- Cleveland-Elyria, OH
- Population (ZIP)
- 62,179
- Household income
- $56,408
- Rent vs Own
- Severe rent burden
- 2229.0
Population outlook (Lorain County) Hauer SSP2
- Today (2025)
- 314,924 people
- By 2030
- 317,546 · +0.8%
- By 2040
- 317,962 · +1.0%
- By 2050
- 312,872 · -0.7%
- By 2075
- 301,806 · -4.2%
- By 2100
- 278,271 · -11.6%
Race, ethnicity, and origin ACS 2023
- Neighborhood character
- Predominantly White (70%)
- Race & ethnicity
- White 70% Two or more races 12% Black 11% Hispanic / Latino 10% Asian 1%
- Hispanic origin (detail)
- Mexican 2% Puerto Rican 6%
- Common ancestry
- Romanian 5% Slovak 2% Lithuanian 2%
- Foreign-born
- 2% · China, Canada
- Languages at home
- 94% English-only · Spanish 4% Chinese 1%
Political lean MEDSL · Lorain
- 2024 margin
- Lean R (+5.7) · D 46.7% · R 52.4%
- 2008→2024 swing
- -23.6pp toward R · 2008: 17.9pp · 2024: -5.7pp
- All cycles
- 2024: R+5.7 2020: R+2.5 2016: R+0.3 2012: D+14.4 2008: D+17.9
Not yet ingested
- Civics
- —
Market trends
- HPI YoY
- ▼ -139.09%
- Current HPI
- 199.7354
- Rent YoY
- ▲ 6.74%
- Metro
- Cleveland-Elyria, OH
- State GDP YoY
- ▲ 1.98%
- F500 in state
- 48
Industry mix (Fortune 500 HQ in OH)
| Industry | F500 HQs | Revenue |
|---|---|---|
| Insurance | 3 | $145B |
|
||
| Industrial Machinery | 3 | $49B |
|
||
| Financial Services | 3 | $24B |
|
||
| Consumer Goods | 2 | $93B |
|
||
| Aerospace / Defense | 2 | $47B |
|
||
| Utilities | 2 | $33B |
|
||
Price history
-7.4% since first listed5 events — show timeline
- 2026-04-13 Pending — MLSNOW
- 2026-03-17 Price Changed $125,000 MLSNOW
- 2026-02-19 Relisted — MLSNOW
- 2026-01-08 Pending — MLSNOW
- 2025-12-22 Listed $135,000 MLSNOW
Cash-flow waterfall
monthlySold comps — $/sqft
last 12 mo · ≤1 miLoading sold comps…