25693 Gill Rd · Denham Springs, LA
Flood risk No data
- FEMA flood zone
- —
- Chance of flooding over 30 yrs
- —
- Est. flood insurance / yr
- —
Fire risk No data
- Est. fire insurance / yr
- —
Heat risk No data
- Hot days now (above threshold)
- —
- Hot days in 30 yrs
- —
Wind risk No data
- Chance of severe wind over 30 yrs
- —
Air-quality risk No data
- Unhealthy air days now
- —
- Unhealthy air days in 30 yrs
- —
Risk factors via First Street. Map © Google.
Why this score? — see what drove the B- grade
The composite is a weighted blend of 9 inputs, each scored 0–100. Each bar is that input's sub-score; the figure is the points it added to the 100-point composite (weight × sub-score).
- Cash flow +28.2/30.0
- DSCR +10.0/10.0
- 1% rule +8.5/10.0
- ARV discount +7.5/15.0
- Schools +4.0/10.0
- Condition / age +4.0/5.0
- Livability +3.7/5.0
- Rent growth +3.5/5.0
- Appreciation +0.0/10.0
$123,000
🖨 Deal sheet 📄 Offer letter ✓ Due diligence
Listing remarks MLS
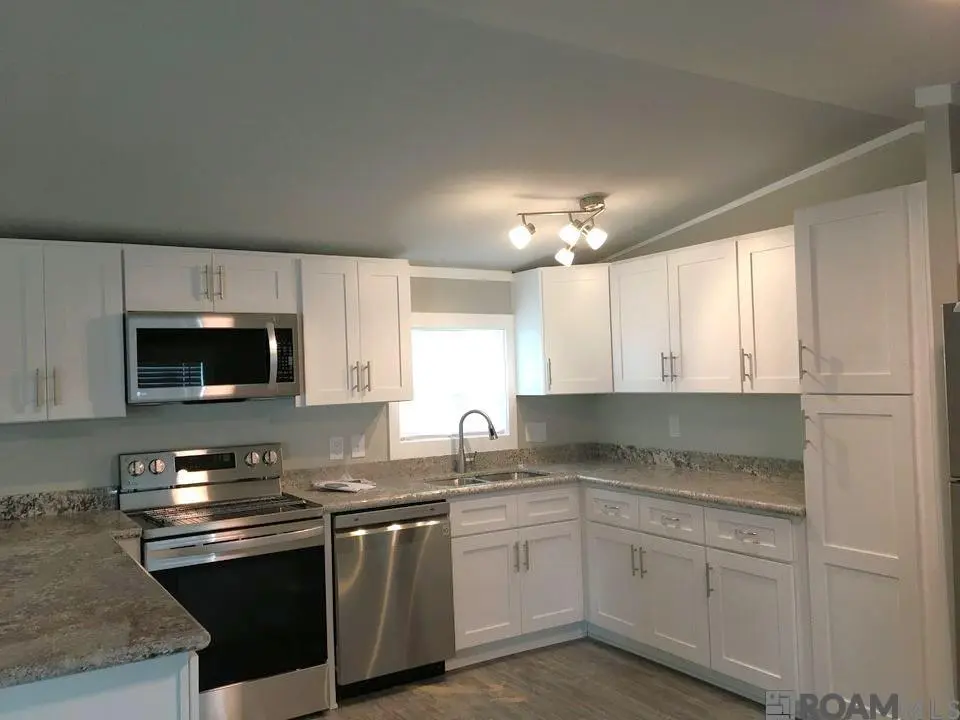
Tucked away in a charming and quiet 5-parcel subdivision, this beautifully updated 3-bedroom, 2-bath home offers modern style, comfort, and excellent investment potential. Completely renovated inside and out in 2019, nearly everything was replaced while preserving only the original frame. The home features an inviting open floor plan with stylish wood-look vinyl flooring throughout, granite countertops, custom kitchen cabinetry, updated appliances, modern tubs and vanities, contemporary lighting, and soothing neutral paint colors that create a fresh, move-in-ready feel. Also, a covered front porch and all Lawn service included in HOA. Well-maintained and thoughtfully updated, this property is currently tenant occupied and produces strong rental income, making it an excellent opportunity for investors or future homeowners alike. Please do not disturb tenants.
Key facts
- Updated appliances
- Covered front porch
- Open floor plan
Tags
Property features AI
Finance
- HOA & community: Homeowners association with management; Annual association fee of $900 (about $75/month) covering grounds maintenance
Exterior
- Parking: 2 parking spaces
- Security: Smoke detectors
- Utilities: Public water; Public sewer
- Home design: Manufactured home (Southern Mobile Home); Residential property
- Construction: Vinyl siding; Block foundation; Shingle roof; Built as a manufactured home
- Exterior features: Outdoor lighting; Porch
Interior
- Flooring: Tile; Vinyl
- Bathrooms: 2 full bathrooms
- Heating & cooling: Central heating (electric); Central air; Ceiling fans
- Interior features: Window treatments; Tile and vinyl flooring
- Laundry & utility: Washer hookup; Electric dryer hookup
Neighborhood map
What this means for you Summary
Snapshot
- This is a 3-bed/2.0-bath manufactured listed at $123k. Condition is rated good.
Deal economics
- At list price, monthly cash flow is $390 ($5k/yr) — positive.
- The deal already cash-flows at list — no discount required.
- Meets the 1% rule at list price ($2k rent vs $123k).
- Recommended offer: $121k (1.5% below list) — sets the bar for market timing.
- Cap rate 10.1% vs local median 3.9% in Denham Springs — top-decile yield for the area; either an underpriced asset or a hidden risk that comps aren't pricing in. Stress-test before assuming the spread holds.
Location & tenants
- Location reads 74/100 on livability (#29 in LA, #4,939 nationally) — a middle-class / working-renter tenant base. Strengths: cost of living A+, housing A+, health & safety A+; Watch: crime C-, amenities F, commute F.
- Livingston Parish (suburban): math 40% / reading 52% proficiency, ranked #13 of 98 in LA (top 13%) — families likely to look elsewhere, expect single-tenant / working-renter base with shorter leases.
- Market conditions: Rents rising (+3.8%/yr); 976 active listings in the ZIP; 8 comparable units currently listed for rent nearby; rentals lingering (median 44d on market — plan ~5-8 weeks vacancy on turnover, expect pricing pressure); 50% of comp listings sitting > 30 days — soft ceiling on asking rent; solid renter incomes; 794 units permitted in Livingston Parish in 2024 (99 in 5+ unit buildings).
Forward outlook
- Local home prices are declining (-3.0%/yr); year-one equity from $850 of loan paydown is wiped out by about $4k of value loss. Plan a longer hold.
- Livingston County population projected at +27% by 2050 — long-run rental-demand tailwind backs the buy-and-hold thesis.
- At projected returns (-3.0% appreciation + 3.8% rent growth), your $34k cash investment doubles in ~8 years — after that, you're playing with house money.
Negotiation context
- It's been on market 16 days — a 2% lower offer ($121k) is reasonable based on typical stale-listing flexibility.
- 2 sale attempts with the ask held roughly flat each time — persistent listings suggest the price (not the market) is what's stuck; bring a comps-based counter.
Questions for the listing agent
- What does the HOA fee cover, when was the last increase, and are there any pending special assessments or reserve-fund shortfalls?
- Is there a deadline driving the sale (1031 exchange, divorce, estate, relocation)? That informs how much negotiation room exists.
- Schools are B-rated — typically a magnet for longer-tenancy family renters. What's the average tenant stay here, and is there a school-zone premium baked into asking?
- What's the average days-on-market for RENTAL listings here right now (not sales)? A rising rental-DOM trend means longer vacancies and softer asking-rent achievability than the comps imply.
- What's the recent tenant-quality profile in this submarket — average credit score on applications, eviction rate, late-payment / NSF rate, and stable-employment percentage? A property-management company in the area should have these aggregated.
- How much new for-sale + rental construction is in the pipeline within 1–3 miles? Heavy new supply typically softens prices + rents 12–24 months out; constrained supply supports both.
Investment metrics
- 1% rule
- 1.35% ✓
- Cap rate
- 10.10%
- Cash-on-cash
- 13.59%
- DSCR
- 1.60
- GRM
- 6.2
CMA / ARV
No comps found within radius.
Projected returns pro-forma
-3.0% appreciation · 3.83% rent growth · sell at horizon
- IRR
- 4.7%
- Equity multiple
- 1.19×
- Total profit
- $6,384
- Equity at exit
- $18,340
- IRR
- 15.0%
- Equity multiple
- 2.27×
- Total profit
- $43,687
- Equity at exit
- $10,635
Cash invested: $34,440 (down + closing). Projections, not guarantees.
Landlord ↔ Tenant lean methodology
- Overall (STATE)
- 90 Strongly Landlord-Friendly
- State Louisiana
- 90 Strongly Landlord-Friendly · R+12
- County
- — inherits STATE
- City
- — inherits STATE
ZIP-level market 70726
- Rents YoY
- 3.8%
- Active inventory
- 976
- Price-to-rent
- 6.2×
Monthly cashflow live
- Estimated rent
- $1,665 high interval (Pro) →
- Mortgage (P&I)
- −$645
- Tax est. 1.5%
- −$154 /mo · $1,845/yr
- Insurance
- −$51
- HOA
- −$75
- Vacancy / Maint / Mgmt
- −$350
- Net cashflow
- $390
Break-even live
UW: 25.0% down · 7.5% · 30yr · 1.5% tax · 5.0% vac · 8.0% maint · 8.0% mgmt
Financing live
Cash to close
- Down payment
- $30,750
- Closing costs
- $3,690
- Reserves months
- —
- Total cash needed
- —
Loan-product check · same deal, 3 products live
Conventional
25% down · 7.5% · 30yr
- Down + closing
- —
- Monthly P&I
- —
- Monthly cashflow
- —
- DSCR
- —
- Eligible?
- —
Personal DTI + credit; lowest rate.
DSCR
20% down · 8.5% · 30yr
- Down + closing
- —
- Monthly P&I
- —
- Monthly cashflow
- —
- DSCR
- —
- Eligible?
- —
No personal income docs; deal must DSCR.
Hard money
10% down · 12.0% · 12mo
- Down + closing
- —
- Monthly P&I
- —
- Monthly cashflow
- —
- DSCR
- —
- Eligible?
- —
Short-term bridge; refi at stabilization.
Rent comps 8 comps
| Address | Beds | Baths | Sqft | Rent | $/sqft | DOM | Units | Dist |
|---|---|---|---|---|---|---|---|---|
| 8708 Montclair St Denham Springs, LA | 3.0 | 2.0 | 1184 | $1,600 | $1.35 | 21d | 1 | 0.19mi |
| 25397 Lake Providence Dr Denham Springs, LA | 3.0 | 2.0 | 1732 | $1,900 | $1.10 | 14d | 1 | 0.50mi |
| 8275 Vincent Rd Denham Springs, LA | 1.0–3.0 | 1.0–2.0 | 958 | $1,495 | $1.56 | 14d | 20 | 0.50mi |
| 25842 Shadow Brook Ave Denham Springs, LA | 4.0 | 2.0 | 1790 | $1,750 | $0.98 | 21d | 1 | 0.65mi |
| 9133 Shadow Bluff Ave Denham Springs, LA | 4.0 | 2.0 | 1808 | $1,950 | $1.08 | 43d | 1 | 0.71mi |
| 2630 Kelli Dr Unit 1 Denham Springs, LA | 2.0 | 1.5 | 1100 | $1,250 | $1.14 | 43d | 1 | 0.95mi |
| 155 Aspen Sq #30 Denham Springs, LA | 3.0 | 2.0 | 1234 | $1,375 | $1.11 | 43d | 1 | 1.40mi |
| 153 Aspen Sq Denham Springs, LA | 3.0 | 2.0 | 1236 | $1,295 | $1.05 | 43d | 1 | 1.41mi |
HOA detail
- Monthly dues
- $75 · $900/yr
Listing history 12 events
-
2026-06-18days on market $123,000 Active 16 DOM
-
2026-06-17days on market $123,000 Active 15 DOM
-
2026-06-16days on market $123,000 Active 14 DOM
-
2026-06-15days on market $123,000 Active 13 DOM
-
2026-06-14days on market $123,000 Active 11 DOM
-
2026-06-13days on market $123,000 Active 10 DOM
-
2026-06-10days on market $123,000 Active 8 DOM
-
2026-06-09days on market $123,000 Active 7 DOM
-
2026-06-08days on market $123,000 Active 6 DOM
-
2026-06-07days on market $123,000 Active 5 DOM
-
2026-06-03remarks 699-char remark
-
2026-06-03$123,000 Active 1 DOM
ⓘ Source: listings_history table (triggers on properties + properties_extension) + one-shot
backfill from property_details.listing_events for pre-trigger history.
Nearby sold comps map
Loading sold comps map…
Walkable amenities ~0.75 mi
Loading nearby amenities…
Taxation est. · year 1
- Rental income
- $19,976
- − Mortgage interest
- −$6,890
- − Property taxes
- −$1,845
- − Insurance
- −$615
- − Repairs & maintenance
- −$1,598
- − Management
- −$1,598
- − HOA
- −$900
- − Depreciation
- −$3,578
- Taxable income
- $2,952
- Est. tax owed @ 24.0%
- −$708
- After-tax cash flow
- $3,972/yr
For passive investors: Depreciation is non-cash, so a rental often shows a tax loss while cash-flowing — sheltering income. Rental losses are passive: they offset passive income freely, and up to $25,000/yr can offset ordinary (W-2) income if you actively participate and your MAGI is under $100k (phasing out to $0 by $150k); unused losses carry forward. On sale, claimed depreciation is recaptured at up to 25%, and gains may owe capital-gains tax (a 1031 exchange can defer both). Figures are a year-1 estimate at your 24.0% rate — not tax advice; consult a CPA.
Condition & rehab AI · 8 photos
This beautifully updated 3-bedroom, 2-bath home offers modern style and comfort, with a fresh, move-in-ready feel. The property is well-maintained and thoughtfully updated, making it an excellent investment opportunity.
Value-add opportunities
- Both Painting exterior and interior walls — Fresh paint enhances curb appeal and interior aesthetics.
- Both Landscaping and curb appeal improvements — Enhances curb appeal and can attract more buyers/renters.
- Both Add smart home features — Improves home's marketability and adds value to both resale and rental markets.
Renovation cost estimate screening
Value-add ROI direction
- Both Painting exterior and interior walls — Fresh paint enhances curb appeal and interior aesthetics. ↑
- Both Landscaping and curb appeal improvements — Enhances curb appeal and can attract more buyers/renters. ↑
- Both Add smart home features — Improves home's marketability and adds value to both resale and rental markets. ↑
ⓘ Cost ranges are severity-bucket heuristics (US national rule-of-thumb). Get contractor quotes + a written scope before underwriting a rehab budget.
Schools (NCES district)
- District
- Livingston Parish
- NCES district ID
- 2201020
- Math proficiency
- 40% ▼ -38.00%
- Reading proficiency
- 52% ▼ -32.00%
- Median HH income
- $56,755
- Composite
- 40.07/100
- National rank
- #3811
- State rank
- #13 of 98 in LA
Livability — Denham Springs
- Score
- 74/100
- State rank
- #29
- US rank
- #4939
Category grades
Schools grade is shown separately in the Schools card above.
Census & demographics
- County
- Livingston Parish · 87,496 people
- City population
- 63,575
- Metro
- Baton Rouge, LA
- Population (ZIP)
- 63,575
- Household income
- $78,621
- Rent vs Own
- Severe rent burden
- 1211.0
Population outlook (Livingston County) Hauer SSP2
- Today (2025)
- 158,511 people
- By 2030
- 168,241 · +6.1%
- By 2040
- 186,252 · +17.5%
- By 2050
- 201,516 · +27.1%
- By 2075
- 231,217 · +45.9%
- By 2100
- 241,697 · +52.5%
Race, ethnicity, and origin ACS 2023
- Neighborhood character
- Predominantly White (74%)
- Race & ethnicity
- White 74% Black 13% Hispanic / Latino 9% Two or more races 6%
- Hispanic origin (detail)
- Mexican 3%
- Common ancestry
- Lithuanian 9% Serbian 1% Italian 1%
- Foreign-born
- 6% · Canada
- Languages at home
- 91% English-only · Spanish 6% Other Indo-European 1%
Political lean MEDSL · Livingston
- 2024 margin
- Solid R (+68.5) · D 15.1% · R 83.6% · Other 1.3%
- 2008→2024 swing
- +3.4pp toward D · 2008: -71.9pp · 2024: -68.5pp
- All cycles
- 2024: R+68.5 2020: R+70.0 2016: R+72.5 2012: R+70.4 2008: R+71.9
Not yet ingested
- Civics
- —
Market trends
- HPI YoY
- ▼ -104.37%
- Current HPI
- 170.2207
- Rent YoY
- ▲ 3.83%
- Metro
- Baton Rouge, LA
- State GDP YoY
- ▲ 3.29%
- F500 in state
- 10
Industry mix (Fortune 500 HQ in LA)
| Industry | F500 HQs | Revenue |
|---|---|---|
| Telecommunications | 2 | $23B |
|
||
| Utilities | 1 | $12B |
|
||
| Wholesale / Distribution | 1 | $5B |
|
||
| Advertising | 1 | $2B |
|
||
Price history
+0.0% since first listed2 events — show timeline
- 2026-06-01 Listed $123,000 AcadianaMLS
- 2026-06-01 Listed $123,000 GBRMLS
Cash-flow waterfall
monthlySold comps — $/sqft
last 12 mo · ≤1 miLoading sold comps…