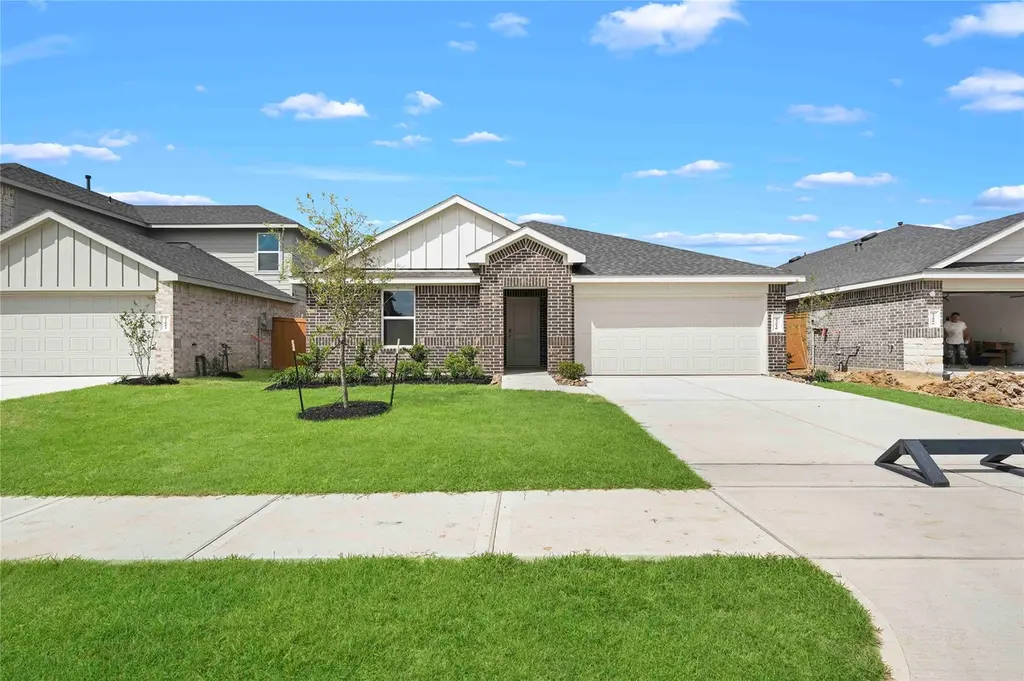
22010 Vernazza Bnd · Houston, TX
Flood risk 1/10 · Minimal
- FEMA flood zone
- X (unshaded)
- Chance of flooding over 30 yrs
- 0.0%
- Est. flood insurance / yr
- $507 – $1,088
Fire risk 5/10 · Moderate
- Est. fire insurance / yr
- $1,222 – $2,270
Heat risk 8/10 · Major
- Hot days now (above 111°F)
- 7 days/yr
- Hot days in 30 yrs
- 22 days/yr
Wind risk 9/10 · Severe
- Chance of severe wind over 30 yrs
- 99.0%
Air-quality risk 2/10 · Minimal
- Unhealthy air days now
- 1 days/yr
- Unhealthy air days in 30 yrs
- 2 days/yr
Risk factors via First Street. Map © Google.
Why this score? — see what drove the D grade
The composite is a weighted blend of 9 inputs, each scored 0–100. Each bar is that input's sub-score; the figure is the points it added to the 100-point composite (weight × sub-score).
- Cash flow +12.4/30.0
- ARV discount +7.8/15.0
- Condition / age +4.8/5.0
- 1% rule +4.1/10.0
- DSCR +3.7/10.0
- Livability +3.7/5.0
- Schools +2.9/10.0
- Rent growth +2.1/5.0
- Appreciation +0.0/10.0
$289,990
🖨 Deal sheet (PDF) 📄 Offer letter ✓ Due diligence
Listing remarks MLS
OUTSTANDING NEW D.R. HORTON BUILT 1 STORY IN CYPRESS GREEN! Popular Split Plan Layout! Impressive Foyer Leads to Gourmet Island Kitchen Privately Located Primary Suite Features Great Bath with Oversized Shower. Walk-In Closet! Generously Sized Secondary Bedrooms! Convenient Utility Room! Covered Patio & Sprinkler System Included! Awesome Community with Pool & Playground - AND Easy Access to the City of Cypress, the Grand Parkway, & 290. Estimated Completion - Spring 2026.
Key facts
- Walk-in closet
- Covered patio
- Oversized shower
Tags
Neighborhood map
What this means for you Summary
Snapshot
- This is a 5-bed/2.0-bath single-family listed at $290k. Condition is rated excellent.
Deal economics
- At list price, monthly cash flow is $-49 ($-583/yr) — negative.
- To cash-flow at today's rent, offer at most $283k (2.4% below list).
- To meet the 1% rule (rent ≥ 1% of price), the offer needs to be $265k (8.7% below list).
- Recommended offer: $255k (12.0% below list) — sets the bar for market timing.
- Cap rate 6.1% vs local median 3.2% in Houston — top-decile yield for the area; either an underpriced asset or a hidden risk that comps aren't pricing in. Stress-test before assuming the spread holds.
Location & tenants
- Location reads 74/100 on livability (#184 in TX, #4,771 nationally) — a middle-class / working-renter tenant base. Strengths: amenities A+, cost of living A+, housing A+; Watch: crime F.
- Waller ISD (rural): math 30% / reading 35% proficiency, ranked #532 of 826 in TX (top 64%) — families likely to look elsewhere, expect single-tenant / working-renter base with shorter leases.
- Zoned schools: Evelyn Turlington El (math 46% / reading 45%, grade D-, #1,112 of 4,322 statewide, top 26%, 1,084 students, 69% FRL); Schultz J H (math 31% / reading 37%, grade F, #892 of 1,662 statewide, top 55%, 1,120 students, 65% FRL); Waller H S (math 25% / reading 40%, grade F, #1,029 of 1,632 statewide, top 64%, 2,639 students, 62% FRL).
- Market conditions: Rents soft (-1.6%/yr); 1791 active listings in the ZIP; 5 comparable units currently listed for rent nearby; rentals leasing fast (median 1d on market — plan ~1-2 weeks tenant-placement turnaround); high-income renter base; 29,883 units permitted in Harris County in 2024 (8,621 in 5+ unit buildings).
Forward outlook
- Local home prices are declining (-3.0%/yr); year-one equity from $2k of loan paydown is wiped out by about $9k of value loss. Plan a longer hold.
- Harris County population projected at +47% by 2050 — long-run rental-demand tailwind backs the buy-and-hold thesis.
Negotiation context
- It's been on market 140 days — a 12% lower offer ($255k) is reasonable based on typical stale-listing flexibility.
Risks & watch-outs
- Climate carrying-cost: severe wind risk, 99% chance of damaging wind over 30y; moderate wildfire risk; extreme-heat days projected 7→22/yr by 2055 (HVAC capex compounding) — expect insurance premiums to compound above CPI over the hold.
Questions for the listing agent
- What do current leases actually rent for vs. the listed asking? Can we see a recent rent roll and the last 12 months of T-12 income?
- It's been on market 140 days. Have you received any prior offers? Is the seller open to a 12% concession, seller financing, or rate buy-down credit?
- What does the HOA fee cover, when was the last increase, and are there any pending special assessments or reserve-fund shortfalls?
- Why hasn't it sold? Are there any deal-killer items the seller is aware of (foundation, flood, title, zoning, code violations)?
- Is there a deadline driving the sale (1031 exchange, divorce, estate, relocation)? That informs how much negotiation room exists.
- Schools are D-rated, which usually means shorter tenancies and higher turnover. Who's the typical renter profile here, and what's been the actual vacancy rate?
- Crime grade is F in this area — have there been break-ins, vandalism, or insurance claims at this property in the last 3 years? What carrier currently insures it and at what premium?
- The area grade is low — what's the realistic commute time and amenity access for the typical tenant pool here? Any planned neighborhood developments (good or bad) we should know about?
- What's the average days-on-market for RENTAL listings here right now (not sales)? A rising rental-DOM trend means longer vacancies and softer asking-rent achievability than the comps imply.
- What's the recent tenant-quality profile in this submarket — average credit score on applications, eviction rate, late-payment / NSF rate, and stable-employment percentage? A property-management company in the area should have these aggregated.
- How much new for-sale + rental construction is in the pipeline within 1–3 miles? Heavy new supply typically softens prices + rents 12–24 months out; constrained supply supports both.
Investment metrics
- 1% rule
- 0.91% ✗
- Cap rate
- 6.09%
- Cash-on-cash
- -0.72%
- DSCR
- 0.97
- GRM
- 9.1
CMA / ARV
- ARV (median comp)
- $291,683
- List price
- $289,990
- Delta
- -0.58%
- Verdict
- FAIR
- Comps
- 20 within 1.0 mi
Show comp detail 12 sales within ~0.75 mi
| Address | Dist | Beds/Ba | Sqft | Sold | Price | $/sf | Match |
|---|---|---|---|---|---|---|---|
| 22214 San Lioni Dr | 0.13mi | 4/2.0 (-1) | 1,908 (+1%) | 1mo | $333,990 | $175 | 86 |
| 22002 Maddaloni View Dr | 0.13mi | 4/2.0 (-1) | 1,922 (+2%) | 1mo | $316,990 | $165 | 85 |
| 21714 Piazza Maggiore Ln | 0.00mi | 4/2.5 (-1) | 2,042 (+8%) | 1mo | $300,000 | $147 | 78 |
| 22026 Matera Vista Ln | 0.13mi | 4/2.0 (-1) | 1,759 (-6%) | 1mo | $299,990 | $171 | 77 |
| 21927 Maddaloni View Dr | 0.13mi | 4/2.0 (-1) | 2,013 (+7%) | 1mo | $352,990 | $175 | 76 |
| 19650 Costa Marra Dr | 0.13mi | 4/2.0 (-1) | 1,670 (-11%) | 1mo | $275,990 | $165 | 69 |
| 21631 Carbonari Dr | 0.13mi | 4/2.5 (-1) | 2,083 (+11%) | 1mo | $343,990 | $165 | 68 |
| 21643 Carbonari Dr | 0.13mi | 4/2.0 (-1) | 1,655 (-12%) | 1mo | $333,990 | $202 | 68 |
| 21623 Carbonari Dr | 0.13mi | 4/2.0 (-1) | 1,655 (-12%) | 1mo | $328,990 | $199 | 68 |
| 19615 Costa Marra Dr | 0.13mi | 4/2.0 (-1) | 1,644 (-13%) | 1mo | $266,990 | $162 | 67 |
| 21934 Maddaloni View Dr | 0.13mi | 4/2.0 (-1) | 2,162 (+15%) | 1mo | $362,990 | $168 | 63 |
| 21707 Piazza Maggiore Ln | 0.75mi | 4/2.5 (-1) | 2,042 (+8%) | 1mo | $300,000 | $147 | 43 |
Match score weights: distance 35% · size 25% · config 20% · recency 20%. Top-matched comps best support the ARV.
Projected returns pro-forma
-3.0% appreciation · 0.0% rent growth · sell at horizon
- IRR
- -21.1%
- Equity multiple
- 0.29×
- Total profit
- $-57,717
- Equity at exit
- $43,238
- IRR
- -24.4%
- Equity multiple
- -0.03×
- Total profit
- $-83,713
- Equity at exit
- $25,073
Cash invested: $81,197 (down + closing). Projections, not guarantees.
Landlord ↔ Tenant lean methodology
- Overall (STATE)
- 87 Strongly Landlord-Friendly
- State Texas
- 87 Strongly Landlord-Friendly · R+5
- County
- — inherits STATE
- City
- — inherits STATE
ZIP-level market 77447
- Home prices YoY
- -31.1%
- Rents YoY
- -1.6%
- Active inventory
- 1791
- Price-to-rent
- 9.1×
Monthly cashflow live
- Estimated rent
- $2,646 high interval (Pro) →
- Mortgage (P&I)
- −$1,521
- Tax est. 1.5%
- −$362 /mo · $4,350/yr
- Insurance
- −$121
- HOA
- −$135
- Vacancy / Maint / Mgmt
- −$556
- Net cashflow
- $-49
Break-even live
Sensitivity live
| Price | -10% $152 | -5% $52 | +0% $-49 | +5% $-149 | +10% $-249 |
|---|---|---|---|---|---|
| Rent | -10% $-258 | -5% $-153 | +0% $-49 | +5% $56 | +10% $160 |
| Rate | -1.0pp $97 | -0.5pp $25 | base $-49 | +0.5pp $-124 | +1.0pp $-200 |
UW: 25.0% down · 7.5% · 30yr · 1.5% tax · 5.0% vac · 8.0% maint · 8.0% mgmt
Financing live
Cash to close
- Down payment
- $72,498
- Closing costs
- $8,700
- Reserves months
- —
- Total cash needed
- —
Loan-product check · same deal, 3 products live
Conventional
25% down · 7.5% · 30yr
- Down + closing
- —
- Monthly P&I
- —
- Monthly cashflow
- —
- DSCR
- —
- Eligible?
- —
Personal DTI + credit; lowest rate.
DSCR
20% down · 8.5% · 30yr
- Down + closing
- —
- Monthly P&I
- —
- Monthly cashflow
- —
- DSCR
- —
- Eligible?
- —
No personal income docs; deal must DSCR.
Hard money
10% down · 12.0% · 12mo
- Down + closing
- —
- Monthly P&I
- —
- Monthly cashflow
- —
- DSCR
- —
- Eligible?
- —
Short-term bridge; refi at stabilization.
Rent comps 5 comps
| Address | Beds | Baths | Sqft | Rent | $/sqft | DOM | Units | Dist |
|---|---|---|---|---|---|---|---|---|
| 22222 Opa Glen Dr Hockley, TX | 4.0 | 3.0 | 2609 | $2,850 | $1.09 | 45d | 1 | 0.42mi |
| 22023 Lost Lantern Dr Hockley, TX | 3.0–4.0 | 2.0 | 1601 | $1,901 | $1.19 | 0d | 1 | 0.52mi |
| 20718 Round Key Dr Hockley, TX | 4.0 | 2.5 | 2133 | $1,806 | $0.85 | 0d | 1 | 0.59mi |
| 21210 Echo Manor Dr Hockley, TX | 4.0 | 2.5 | 2221 | $2,150 | $0.97 | 4d | 1 | 0.74mi |
| 20313 Evergreen Cypress Dr Hockley, TX | 2.0–5.0 | 2.0–3.5 | 2051 | $3,070 | $1.50 | 0d | 1 | 0.80mi |
HOA detail
- Monthly dues
- $135 · $1,620/yr
- Likely covers
- pool
Listing history 16 events
-
2026-06-17days on market $289,990 Active 140 DOM
-
2026-06-16days on market $289,990 Active 139 DOM
-
2026-06-15days on market $289,990 Active 138 DOM
-
2026-06-13days on market $289,990 Active 136 DOM
-
2026-06-09days on market $289,990 Active 132 DOM
-
2026-06-08days on market $289,990 Active 131 DOM
-
2026-06-07days on market $289,990 Active 130 DOM
-
2026-06-04days on market $289,990 Active 127 DOM
-
2026-06-03days on market $289,990 Active 126 DOM
-
2026-06-02days on market $289,990 Active 125 DOM
-
2026-06-01days on market $289,990 Active 124 DOM
-
2026-05-31days on market $289,990 Active 123 DOM
-
2026-03-31price $289,990 490-char remark
Show marketing remark (490 chars)
OUTSTANDING NEW D.R. HORTON BUILT 1 STORY IN CYPRESS GREEN! Popular Split Plan Layout! Impressive Foyer Leads to Gourmet Island Kitchen Privately Located Primary Suite Features Great Bath with Oversized Shower. Walk-In Closet! Generously Sized Secondary Bedrooms! Convenient Utility Room! Covered Patio & Sprinkler System Included! Awesome Community with Pool & Playground - AND Easy Access to the City of Cypress, the Grand Parkway, & 290. Estimated Completion - Spring 2026.
-
2026-03-03price $288,990 490-char remark
Show marketing remark (490 chars)
OUTSTANDING NEW D.R. HORTON BUILT 1 STORY IN CYPRESS GREEN! Popular Split Plan Layout! Impressive Foyer Leads to Gourmet Island Kitchen Privately Located Primary Suite Features Great Bath with Oversized Shower. Walk-In Closet! Generously Sized Secondary Bedrooms! Convenient Utility Room! Covered Patio & Sprinkler System Included! Awesome Community with Pool & Playground - AND Easy Access to the City of Cypress, the Grand Parkway, & 290. Estimated Completion - Spring 2026.
-
2026-01-28price $289,990 490-char remark
Show marketing remark (490 chars)
OUTSTANDING NEW D.R. HORTON BUILT 1 STORY IN CYPRESS GREEN! Popular Split Plan Layout! Impressive Foyer Leads to Gourmet Island Kitchen Privately Located Primary Suite Features Great Bath with Oversized Shower. Walk-In Closet! Generously Sized Secondary Bedrooms! Convenient Utility Room! Covered Patio & Sprinkler System Included! Awesome Community with Pool & Playground - AND Easy Access to the City of Cypress, the Grand Parkway, & 290. Estimated Completion - Spring 2026.
-
2026-01-28$322,990 Active 490-char remark
Show marketing remark (490 chars)
OUTSTANDING NEW D.R. HORTON BUILT 1 STORY IN CYPRESS GREEN! Popular Split Plan Layout! Impressive Foyer Leads to Gourmet Island Kitchen Privately Located Primary Suite Features Great Bath with Oversized Shower. Walk-In Closet! Generously Sized Secondary Bedrooms! Convenient Utility Room! Covered Patio & Sprinkler System Included! Awesome Community with Pool & Playground - AND Easy Access to the City of Cypress, the Grand Parkway, & 290. Estimated Completion - Spring 2026.
ⓘ Source: listings_history table (triggers on properties + properties_extension) + one-shot
backfill from property_details.listing_events for pre-trigger history.
Climate risk First Street
- Flood 1/10 Low FEMA zone X (unshaded) · 0% chance over 30 yrs
- Wildfire 5/10 Major
- Heat 8/10 Severe 7 d/yr ≥111°F today · 22 d/yr by 30 yrs out
- Wind 9/10 Extreme 99% chance of damaging wind over 30 yrs
- Air quality 2/10 Low 1 unhealthy d/yr today · 2 by 30 yrs out
Nearby sold comps map
Loading sold comps map…
Walkable amenities ~0.75 mi
Loading nearby amenities…
Taxation est. · year 1
- Rental income
- $31,754
- − Mortgage interest
- −$16,244
- − Property taxes
- −$4,350
- − Insurance
- −$1,450
- − Repairs & maintenance
- −$2,540
- − Management
- −$2,540
- − HOA
- −$1,620
- − Depreciation
- −$8,436
- Taxable loss
- −$5,426
- Est. tax savings @ 24.0%
- +$1,302
- After-tax cash flow
- $719/yr
For passive investors: Depreciation is non-cash, so a rental often shows a tax loss while cash-flowing — sheltering income. Rental losses are passive: they offset passive income freely, and up to $25,000/yr can offset ordinary (W-2) income if you actively participate and your MAGI is under $100k (phasing out to $0 by $150k); unused losses carry forward. On sale, claimed depreciation is recaptured at up to 25%, and gains may owe capital-gains tax (a 1031 exchange can defer both). Figures are a year-1 estimate at your 24.0% rate — not tax advice; consult a CPA.
Condition & rehab AI · 12 photos
This single-family home in Cypress Green is in excellent condition with a modern kitchen, good curb appeal, and a well-maintained interior. It offers a great opportunity for a buyer or renter looking for a move-in-ready property.
Value-add opportunities
- Both Landscaping and irrigation system — Enhances curb appeal and water efficiency.
- Both Painting exterior and interior walls — Fresh paint improves aesthetics and can increase property value.
- Both Upgrade to smart home features — Enhances convenience and energy efficiency, attracting more buyers and renters.
Renovation cost estimate screening
Value-add ROI direction
- Both Landscaping and irrigation system — Enhances curb appeal and water efficiency. ↑
- Both Painting exterior and interior walls — Fresh paint improves aesthetics and can increase property value. ↑
- Both Upgrade to smart home features — Enhances convenience and energy efficiency, attracting more buyers and renters. ↑
ⓘ Cost ranges are severity-bucket heuristics (US national rule-of-thumb). Get contractor quotes + a written scope before underwriting a rehab budget.
Schools (NCES district)
- District
- Waller ISD
- NCES district ID
- 4844430
- Math proficiency
- 30% ▼ -23.00%
- Reading proficiency
- 35% ▼ -11.00%
- Median HH income
- $58,911
- Composite
- 29.12/100
- National rank
- #6593
- State rank
- #532 of 826 in TX
Livability — Houston
- Score
- 74/100
- State rank
- #184
- US rank
- #4771
Category grades
Schools grade is shown separately in the Schools card above.
Census & demographics
- County
- Harris County · 4,702,590 people
- City population
- 3,226,434
- Metro
- Houston-The Woodlands-Sugar Land, TX
- Population (ZIP)
- 25,231
- Household income
- $116,925
- Rent vs Own
- Severe rent burden
- 265.0
Population outlook (Harris County) Hauer SSP2
- Today (2025)
- 5,571,493 people
- By 2030
- 6,089,821 · +9.3%
- By 2040
- 7,142,806 · +28.2%
- By 2050
- 8,185,864 · +46.9%
- By 2075
- 10,574,329 · +89.8%
- By 2100
- 12,109,958 · +117.4%
Race, ethnicity, and origin ACS 2023
- Neighborhood character
- Diverse neighborhood (Simpson 0.63)
- Race & ethnicity
- White 44% Hispanic / Latino 41% Two or more races 16% Black 9% Asian 1%
- Hispanic origin (detail)
- Mexican 27%
- Common ancestry
- Lithuanian 3% Slovak 1% Romanian 1%
- Foreign-born
- 15% · Canada, Jamaica, Dominican Republic
- Languages at home
- 69% English-only · Spanish 28% Other Indo-European 1% Vietnamese 1%
Political lean MEDSL · Harris
- 2024 margin
- Lean D (+5.5) · D 52.0% · R 46.4% · Other 1.6%
- 2008→2024 swing
- +3.9pp toward D · 2008: 1.6pp · 2024: 5.5pp
- All cycles
- 2024: D+5.5 2020: D+13.3 2016: D+12.4 2012: D+0.1 2008: D+1.6
Not yet ingested
- Civics
- —
Market trends
- HPI YoY
- ▼ -112.73%
- Current HPI
- 249.6969
- Rent YoY
- ▼ -1.58%
- Metro
- Houston-The Woodlands-Sugar Land, TX
- State GDP YoY
- ▲ 3.95%
- F500 in state
- 110
Industry mix (Fortune 500 HQ in TX)
| Industry | F500 HQs | Revenue |
|---|---|---|
| Energy | 16 | $1,198B |
|
||
| Technology | 5 | $198B |
|
||
| Engineering / Construction | 4 | $72B |
|
||
| Energy Services | 3 | $60B |
|
||
| Utilities | 3 | $41B |
|
||
| Healthcare | 2 | $330B |
|
||
Price history
-10.2% since first listed4 events — show timeline
- 2026-03-31 Price Changed $289,990 HARMLS
- 2026-03-03 Price Changed $288,990 HARMLS
- 2026-01-28 Price Changed $289,990 HARMLS
- 2026-01-28 Listed $322,990 HARMLS
Cash-flow waterfall
monthlySold comps — $/sqft
last 12 mo · ≤1 miLoading sold comps…