4357 Hunter Ln · Whidbey Island Station, WA
Flood risk 1/10 · Minimal
- FEMA flood zone
- X (unshaded)
- Chance of flooding over 30 yrs
- 0.0%
- Est. flood insurance / yr
- $507 – $1,088
Fire risk 2/10 · Minimal
- Est. fire insurance / yr
- $604 – $1,122
Heat risk 2/10 · Minimal
- Hot days now (above 76°F)
- 5 days/yr
- Hot days in 30 yrs
- 15 days/yr
Wind risk 1/10 · Minimal
- Chance of severe wind over 30 yrs
- —
Air-quality risk 5/10 · Moderate
- Unhealthy air days now
- 7 days/yr
- Unhealthy air days in 30 yrs
- 7 days/yr
Risk factors via First Street. Map © Google.
Why this score? — see what drove the C grade
The composite is a weighted blend of 9 inputs, each scored 0–100. Each bar is that input's sub-score; the figure is the points it added to the 100-point composite (weight × sub-score).
- Cash flow +16.3/30.0
- ARV discount +15.0/15.0
- DSCR +5.1/10.0
- Schools +4.9/10.0
- 1% rule +4.4/10.0
- Rent growth +3.8/5.0
- Livability +3.1/5.0
- Condition / age +2.5/5.0
- Appreciation +0.0/10.0
$216,000
🖨 Deal sheet 📄 Offer letter ✓ Due diligence
Listing remarks
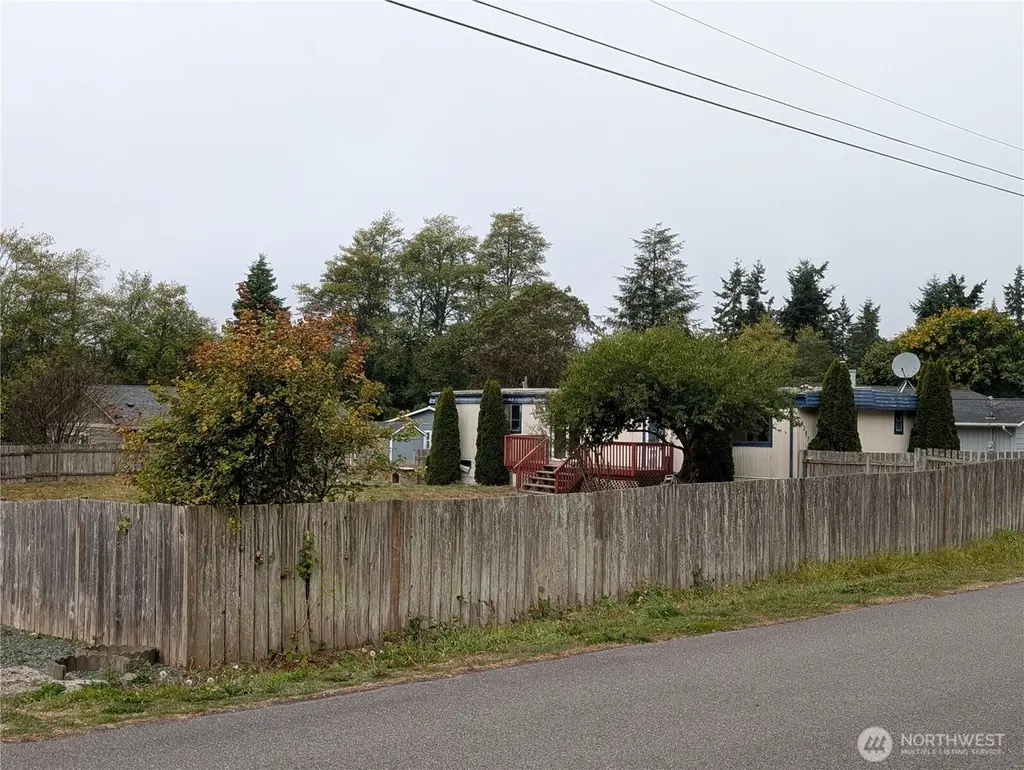
1969 Manufactured Doublewide – 1,344 sq. ft. , 2 bedrooms, 1.75 baths, situated on a spacious double lot. Features include a partially fenced yard, cozy woodstove in the living room, master suite with two closets and private bath, and a deck for outdoor enjoyment. Property is being sold as-is. Nearly new, upgraded septic system already installed. Great potential as an investment or land-value opportunity. Caution: mold present—mask recommended when entering.
Key facts
- Master suite
- Private bath
- Cozy woodstove
Tags
Neighborhood map
What this means for you Summary
Snapshot
- This is a 2-bed/2.0-bath single-family listed at $216k.
Deal economics
- At list price, monthly cash flow is $120 ($1k/yr) — positive.
- The deal already cash-flows at list — no discount required.
- To meet the 1% rule (rent ≥ 1% of price), the offer needs to be $204k (5.5% below list).
- Recommended offer: $190k (12.0% below list) — sets the bar for market timing.
- Cap rate 7.0% vs local median 2.2% in Whidbey Island Station — top-decile yield for the area; either an underpriced asset or a hidden risk that comps aren't pricing in. Stress-test before assuming the spread holds.
Location & tenants
- Location reads 62/100 on livability (#422 in WA) — a middle-class / working-renter tenant base. Strengths: crime A, housing B; Watch: health & safety C-, amenities F, commute F.
- Oak Harbor School District (town): math 49% / reading 61% proficiency, ranked #98 of 291 in WA (top 34%) — acceptable for families but not a draw, mixed tenant base, ~2y average lease.
- Market conditions: Rents rising fast (+5.4%/yr); 277 active listings in the ZIP; solid renter incomes; 402 units permitted in Island County in 2024 (54 in 5+ unit buildings).
Forward outlook
- Local home prices are declining (-3.0%/yr); year-one equity from $1k of loan paydown is wiped out by about $6k of value loss. Plan a longer hold.
- Island County population projected to shrink 6% by 2050 — rents likely to lag national; underwrite the cash flow, not the appreciation.
Negotiation context
- It's been on market 259 days — a 12% lower offer ($190k) is reasonable based on typical stale-listing flexibility.
- 6 sale attempts since 28y ago; this cycle's ask has dropped $13k (6%) from the opening price — seller is motivated, your offer sets the floor, not the list.
- Current owner paid $34k; list at $216k implies a 535% gain — meaningful room to come down on a strong offer.
Questions for the listing agent
- It's been on market 259 days. Have you received any prior offers? Is the seller open to a 12% concession, seller financing, or rate buy-down credit?
- Built in 1969 — when were the roof, HVAC, electrical panel, plumbing, and water heater last replaced?
- What does the HOA fee cover, when was the last increase, and are there any pending special assessments or reserve-fund shortfalls?
- Why hasn't it sold? Are there any deal-killer items the seller is aware of (foundation, flood, title, zoning, code violations)?
- Is there a deadline driving the sale (1031 exchange, divorce, estate, relocation)? That informs how much negotiation room exists.
- What's the average days-on-market for RENTAL listings here right now (not sales)? A rising rental-DOM trend means longer vacancies and softer asking-rent achievability than the comps imply.
- What's the recent tenant-quality profile in this submarket — average credit score on applications, eviction rate, late-payment / NSF rate, and stable-employment percentage? A property-management company in the area should have these aggregated.
- How much new for-sale + rental construction is in the pipeline within 1–3 miles? Heavy new supply typically softens prices + rents 12–24 months out; constrained supply supports both.
Investment metrics
- 1% rule
- 0.94% ✗
- Cap rate
- 6.96%
- Cash-on-cash
- 2.38%
- DSCR
- 1.11
- GRM
- 8.8
CMA / ARV
- ARV (median comp)
- $423,372
- List price
- $216,000
- Delta
- -48.98%
- Verdict
- UNDERPRICED
- Comps
- 8 within 1.0 mi
Show comp detail 7 sales within ~0.75 mi
| Address | Dist | Beds/Ba | Sqft | Sold | Price | $/sf | Match |
|---|---|---|---|---|---|---|---|
| 4397 Terrace Dr | 0.15mi | 2/2.0 | 1,216 (-10%) | 8mo | $439,900 | $362 | 71 |
| 4344 Northgate Dr | 0.33mi | 3/1.5 (+1) | 1,374 (+2%) | 5mo | $428,000 | $311 | 70 |
| 4281 Northgate Dr | 0.34mi | 3/2.0 (+1) | 1,172 (-13%) | 5mo | $405,000 | $346 | 54 |
| 4318 Rhododendron Dr | 0.26mi | 3/2.0 (+1) | 1,152 (-14%) | 7mo | $415,670 | $361 | 54 |
| 4300 Northgate Dr | 0.31mi | 3/1.0 (+1) | 1,248 (-7%) | 14mo | $429,500 | $344 | 53 |
| 4325 Northgate Dr | 0.34mi | 3/1.5 (+1) | 1,164 (-13%) | 6mo | $449,000 | $386 | 50 |
| 621 Ocean View Dr | 0.27mi | 3/2.0 (+1) | 1,152 (-14%) | 16mo | $389,000 | $338 | 46 |
Match score weights: distance 35% · size 25% · config 20% · recency 20%. Top-matched comps best support the ARV.
Projected returns pro-forma
-3.0% appreciation · 5.36% rent growth · sell at horizon
- IRR
- -9.9%
- Equity multiple
- 0.63×
- Total profit
- $-22,379
- Equity at exit
- $32,206
- IRR
- 2.5%
- Equity multiple
- 1.20×
- Total profit
- $11,826
- Equity at exit
- $18,676
Cash invested: $60,480 (down + closing). Projections, not guarantees.
Landlord ↔ Tenant lean methodology
- Overall (STATE)
- 28 Tenant-Leaning
- State Washington
- 28 Tenant-Leaning · D+8
- County
- — inherits STATE
- City
- — inherits STATE
ZIP-level market 98277
- Rents YoY
- 5.4%
- Active inventory
- 277
- Price-to-rent
- 8.8×
Monthly cashflow live
- Estimated rent
- $2,041 medium interval (Pro) →
- Mortgage (P&I)
- −$1,133
- Tax from tax record
- −$152 /mo · $1,820/yr
- Insurance
- −$90
- HOA
- −$118
- Vacancy / Maint / Mgmt
- −$429
- Net cashflow
- $120
Break-even live
UW: 25.0% down · 7.5% · 30yr · 1.5% tax · 5.0% vac · 8.0% maint · 8.0% mgmt
Financing live
Cash to close
- Down payment
- $54,000
- Closing costs
- $6,480
- Reserves months
- —
- Total cash needed
- —
Loan-product check · same deal, 3 products live
Conventional
25% down · 7.5% · 30yr
- Down + closing
- —
- Monthly P&I
- —
- Monthly cashflow
- —
- DSCR
- —
- Eligible?
- —
Personal DTI + credit; lowest rate.
DSCR
20% down · 8.5% · 30yr
- Down + closing
- —
- Monthly P&I
- —
- Monthly cashflow
- —
- DSCR
- —
- Eligible?
- —
No personal income docs; deal must DSCR.
Hard money
10% down · 12.0% · 12mo
- Down + closing
- —
- Monthly P&I
- —
- Monthly cashflow
- —
- DSCR
- —
- Eligible?
- —
Short-term bridge; refi at stabilization.
HOA detail
- Monthly dues
- $118 · $1,416/yr
Listing history 40 events
-
2026-06-19days on market $216,000 Active 259 DOM
-
2026-06-18days on market $216,000 Active 258 DOM
-
2026-06-17days on market $216,000 Active 257 DOM
-
2026-06-16days on market $216,000 Active 256 DOM
-
2026-06-15days on market $216,000 Active 255 DOM
-
2026-06-14days on market $216,000 Active 253 DOM
-
2026-06-13days on market $216,000 Active 252 DOM
-
2026-06-10days on market $216,000 Active 250 DOM
-
2026-06-09days on market $216,000 Active 249 DOM
-
2026-06-08days on market $216,000 Active 248 DOM
-
2026-06-07days on market $216,000 Active 247 DOM
-
2026-06-03days on market $216,000 Active 243 DOM
-
2026-06-02days on market $216,000 Active 242 DOM
-
2026-06-01days on market $216,000 Active 241 DOM
-
2026-05-31days on market $216,000 Active 240 DOM
-
2026-05-30days on market $216,000 Active 239 DOM
-
2026-03-31price $216,000
-
2025-10-03$229,000 Active
-
2014-02-04soldstatus $34,000 Sold
-
2014-01-10status Pending Inspection
-
2013-12-27price $32,000
-
2013-12-19price $37,000
-
2013-12-07status Active
-
2013-11-22status Pending
-
2013-11-15status Pending Inspection
-
2013-10-25price $42,000
-
2013-10-15$50,000 Active
-
2006-08-15soldstatus $155,000
-
2006-08-11soldstatus $155,000
-
2006-05-15$159,000
-
2003-10-20soldstatus $89,900
-
2003-10-10soldstatus $89,900
-
2003-06-12$89,900
-
1999-05-28soldstatus $71,000
-
1999-05-28soldstatus $18,453
-
1999-05-27soldstatus $52,547
-
1998-09-13$69,000
-
1996-07-01soldstatus $35,809
-
1993-07-01soldstatus $31,000
-
1991-11-01soldstatus $15,000
ⓘ Source: listings_history table (triggers on properties + properties_extension) + one-shot
backfill from property_details.listing_events for pre-trigger history.
Tax reassessment forecast WA · Resets to sale price
- Current annual tax
- $1,820 · $152/mo
- Projected year-2 tax
- $2,117 · $176/mo
- Expected delta
- +$297/yr (+$25/mo · 16.3%)
ⓘ Screening estimate from a state-policy table — verify with the county assessor before closing.
Climate risk First Street
- Flood 1/10 Low FEMA zone X (unshaded) · 0% chance over 30 yrs
- Wildfire 2/10 Low
- Heat 2/10 Low 5 d/yr ≥76°F today · 15 d/yr by 30 yrs out
- Wind 1/10 Low
- Air quality 5/10 Major 7 unhealthy d/yr today · 7 by 30 yrs out
Nearby sold comps map
Loading sold comps map…
Walkable amenities ~0.75 mi
Loading nearby amenities…
Taxation est. · year 1
- Rental income
- $24,489
- − Mortgage interest
- −$12,099
- − Property taxes
- −$1,820
- − Insurance
- −$1,080
- − Repairs & maintenance
- −$1,959
- − Management
- −$1,959
- − HOA
- −$1,416
- − Depreciation
- −$6,284
- Taxable loss
- −$2,128
- Est. tax savings @ 24.0%
- +$511
- After-tax cash flow
- $1,949/yr
For passive investors: Depreciation is non-cash, so a rental often shows a tax loss while cash-flowing — sheltering income. Rental losses are passive: they offset passive income freely, and up to $25,000/yr can offset ordinary (W-2) income if you actively participate and your MAGI is under $100k (phasing out to $0 by $150k); unused losses carry forward. On sale, claimed depreciation is recaptured at up to 25%, and gains may owe capital-gains tax (a 1031 exchange can defer both). Figures are a year-1 estimate at your 24.0% rate — not tax advice; consult a CPA.
Schools (NCES district)
- District
- Oak Harbor School District
- NCES district ID
- 5305940
- Math proficiency
- 49% ▲ 1.00%
- Reading proficiency
- 61% ▲ 1.00%
- Median HH income
- $53,606
- Composite
- 49.07/100
- National rank
- #4427
- State rank
- #98 of 291 in WA
Livability — Whidbey Island Station
- Score
- 62/100
- State rank
- #422
- US rank
- #16743
Category grades
Schools grade is shown separately in the Schools card above.
Census & demographics
- County
- Island County · 71,196 people
- City population
- 2,178
- Metro
- Oak Harbor, WA
- Population (ZIP)
- 40,917
- Household income
- $83,253
- Rent vs Own
- Severe rent burden
- 1359.0
Population outlook (Island County) Hauer SSP2
- Today (2025)
- 82,019 people
- By 2030
- 81,329 · -0.8%
- By 2040
- 78,552 · -4.2%
- By 2050
- 77,042 · -6.1%
- By 2075
- 80,799 · -1.5%
- By 2100
- 84,451 · +3.0%
Race, ethnicity, and origin ACS 2023
- Neighborhood character
- Predominantly White (66%)
- Race & ethnicity
- White 66% Two or more races 14% Hispanic / Latino 12% Asian 8% Black 4%
- Hispanic origin (detail)
- Mexican 9%
- Common ancestry
- Portuguese 4% Slovak 3% Iranian 3%
- Foreign-born
- 9% · Canada, Vietnam
- Languages at home
- 87% English-only · Spanish 5% Tagalog/Filipino 4% Other Asian/Pacific 1%
Political lean MEDSL · Island
- 2024 margin
- D (+16.6) · D 56.8% · R 40.3% · Other 2.9%
- 2008→2024 swing
- +10.3pp toward D · 2008: 6.2pp · 2024: 16.6pp
- All cycles
- 2024: D+16.6 2020: D+12.0 2016: D+5.9 2012: D+4.4 2008: D+6.2
Not yet ingested
- Civics
- —
Market trends
- HPI YoY
- ▼ -608.47%
- Current HPI
- 188.2874
- Rent YoY
- ▲ 5.36%
- Metro
- Oak Harbor, WA
- State GDP YoY
- ▲ 4.65%
- F500 in state
- 22
Industry mix (Fortune 500 HQ in WA)
| Industry | F500 HQs | Revenue |
|---|---|---|
| Retail | 2 | $269B |
|
||
| Technology / Retail | 1 | $638B |
|
||
| Technology | 1 | $245B |
|
||
| Telecommunications | 1 | $38B |
|
||
| Food / Beverage | 1 | $36B |
|
||
| Automotive / Trucks | 1 | $34B |
|
||
Price history
+1340.0% since first listed24 events — show timeline
- 2026-03-31 Price Changed $216,000 NWMLS as Distributed by MLS Grid
- 2025-10-03 Listed $229,000 NWMLS as Distributed by MLS Grid
- 2014-02-04 Sold (MLS) $34,000 NWMLS as Distributed by MLS Grid
- 2014-01-10 Pending — NWMLS as Distributed by MLS Grid
- 2013-12-27 Price Changed $32,000 NWMLS as Distributed by MLS Grid
- 2013-12-19 Price Changed $37,000 NWMLS as Distributed by MLS Grid
- 2013-12-07 Relisted — NWMLS as Distributed by MLS Grid
- 2013-11-22 Pending — NWMLS as Distributed by MLS Grid
- 2013-11-15 Pending — NWMLS as Distributed by MLS Grid
- 2013-10-25 Price Changed $42,000 NWMLS as Distributed by MLS Grid
- 2013-10-15 Listed $50,000 NWMLS as Distributed by MLS Grid
- 2006-08-15 Sold (MLS) $155,000 NWMLS as Distributed by MLS Grid
- 2006-08-11 Sold (Public Records) $155,000 Public Records
- 2006-05-15 Listed $159,000 NWMLS as Distributed by MLS Grid
- 2003-10-20 Sold (MLS) $89,900 NWMLS as Distributed by MLS Grid
- 2003-10-10 Sold (Public Records) $89,900 Public Records
- 2003-06-12 Listed $89,900 NWMLS as Distributed by MLS Grid
- 1999-05-28 Sold (Public Records) $18,453 Public Records
- 1999-05-28 Sold (MLS) $71,000 NWMLS as Distributed by MLS Grid
- 1999-05-27 Sold (Public Records) $52,547 Public Records
- 1998-09-13 Listed $69,000 NWMLS as Distributed by MLS Grid
- 1996-07-01 Sold (Public Records) $35,809 Public Records
- 1993-07-01 Sold (Public Records) $31,000 Public Records
- 1991-11-01 Sold (Public Records) $15,000 Public Records
Property tax history
+4.1%/yrLatest (2026): $1,820 · +18.9% YoY. Source: county tax records.
Cash-flow waterfall
monthlySold comps — $/sqft
last 12 mo · ≤1 miLoading sold comps…