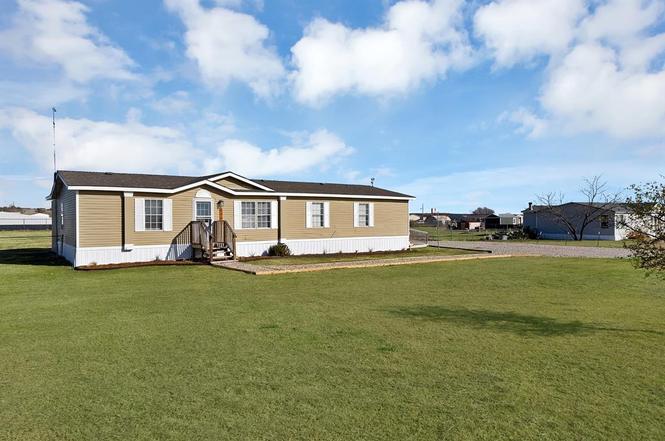
5900 Wild Berry Trl · Burleson, TX
Flood risk 1/10 · Minimal
- FEMA flood zone
- X (unshaded)
- Chance of flooding over 30 yrs
- 0.0%
- Est. flood insurance / yr
- $507 – $1,088
Fire risk 6/10 · Moderate
- Est. fire insurance / yr
- $1,222 – $2,270
Heat risk 7/10 · Major
- Hot days now (above 109°F)
- 7 days/yr
- Hot days in 30 yrs
- 23 days/yr
Wind risk 6/10 · Moderate
- Chance of severe wind over 30 yrs
- 27.0%
Air-quality risk 2/10 · Minimal
- Unhealthy air days now
- 1 days/yr
- Unhealthy air days in 30 yrs
- 2 days/yr
Risk factors via First Street. Map © Google.
Why this score? — see what drove the D grade
The composite is a weighted blend of 9 inputs, each scored 0–100. Each bar is that input's sub-score; the figure is the points it added to the 100-point composite (weight × sub-score).
- ARV discount +11.8/15.0
- Cash flow +11.5/30.0
- Livability +4.0/5.0
- 1% rule +3.8/10.0
- DSCR +3.4/10.0
- Schools +3.2/10.0
- Rent growth +2.5/5.0
- Condition / age +2.5/5.0
- Appreciation +0.0/10.0
$255,000
🖨 Deal sheet (PDF) 📄 Offer letter ✓ Due diligence
Listing remarks
VA LOAN, SELLER FINANCE AVAILABLE! Stunning updated home on a full 1 acre with the perfect mix of modern finishes and country living! This 4-bedroom, 2-bath home features a bright open-concept layout, granite countertops, large island, white cabinetry, stainless steel appliances, and beautiful wood-look flooring throughout the main areas. The spacious primary suite offers dual vanities, a soaking tub, and a tiled walk-in shower. Three additional bedrooms provide flexibility for family, guests, or a home office. Outside, enjoy wide-open space with two storage sheds, fenced areas, and plenty of room for animals, gardening, or future projects. Peaceful living with space to grow, schedule your
Key facts
- Large island
- Updated home
- Full acre
Tags
Property features AI
Finance
- Financial info: Listing offers include Cash, Owner will carry, and VA loan options
- HOA & community: No HOA / Association
Exterior
- Parking: Driveway; Additional parking available
- Security: Smoke detector(s)
- Utilities: City water; Aerobic septic; Electricity connected; No municipal utility district
- Home design: Single family residence (residential); One story
- Construction: Shingle roof; Pillar/Post/Pier foundation; Built in 2001
- Exterior features: Deck; Chain link fencing; Shed(s), storage, and a workshop with electricity on the property; Acreage lot (about 1.03 acres)
Interior
- Kitchen: Granite countertops; Kitchen island; Electric oven; Electric range
- Bedrooms: Primary bedroom on level 1 with dual sinks, garden tub, and separate shower; Three additional bedrooms on level 1, each with walk-in closet(s)
- Flooring: Vinyl flooring
- Bathrooms: Two full bathrooms; Primary bathroom features dual sinks, garden tub, and separate shower
- Heating & cooling: Central heating (electric); Central air; Ceiling fan(s)
- Interior features: Open floorplan; Kitchen island; Pantry; Granite counters; Decorative lighting; High speed internet available; 11 total rooms; One-level layout; No fireplaces
- Laundry & utility: Full-size washer/dryer area; Washer hookup; Electric dryer hookup; Utility room; Mud room
Neighborhood map
What this means for you Summary
Snapshot
- This is a 4-bed/2.0-bath manufactured listed at $255k.
Deal economics
- At list price, monthly cash flow is $-84 ($-1k/yr) — negative.
- To cash-flow at today's rent, offer at most $240k (5.8% below list).
- To meet the 1% rule (rent ≥ 1% of price), the offer needs to be $225k (11.7% below list).
- Recommended offer: $225k (11.7% below list) — sets the bar for 1% rule.
- Cap rate 5.9% vs local median 3.5% in Burleson — top-decile yield for the area; either an underpriced asset or a hidden risk that comps aren't pricing in. Stress-test before assuming the spread holds.
Location & tenants
- Location reads 79/100 on livability (#53 in TX, #2,133 nationally) — a middle-class / working-renter tenant base. Strengths: employment A+, cost of living A+, housing A+; Watch: amenities F, commute F.
- Godley ISD (rural): math 34% / reading 38% proficiency, ranked #466 of 826 in TX (top 56%) — families likely to look elsewhere, expect single-tenant / working-renter base with shorter leases.
- Zoned schools: Rb Godley El (511 students, 46% FRL); Legacy El (math 39% / reading 37%, grade F, #1,709 of 4,322 statewide, top 40%, 408 students, 32% FRL); Godley H S (math 27% / reading 51%, grade F, #859 of 1,632 statewide, top 53%, 777 students, 42% FRL).
- Market conditions: 421 active listings in the ZIP; 2,152 units permitted in Johnson County in 2024 (76 in 5+ unit buildings).
Forward outlook
- Local home prices are declining (-3.0%/yr); year-one equity from $2k of loan paydown is wiped out by about $8k of value loss. Plan a longer hold.
- Johnson County population projected at +24% by 2050 — long-run rental-demand tailwind backs the buy-and-hold thesis.
Negotiation context
- It's been on market 62 days — a 6% lower offer ($240k) is reasonable based on typical stale-listing flexibility.
- 3 sale attempts with the ask held roughly flat each time — persistent listings suggest the price (not the market) is what's stuck; bring a comps-based counter.
Risks & watch-outs
- Climate carrying-cost: major wind risk, 27% chance of damaging wind over 30y; major wildfire risk; extreme-heat days projected 7→23/yr by 2055 (HVAC capex compounding) — expect insurance premiums to compound above CPI over the hold.
Questions for the listing agent
- What do current leases actually rent for vs. the listed asking? Can we see a recent rent roll and the last 12 months of T-12 income?
- It's been on market 62 days. Have you received any prior offers? Is the seller open to a 12% concession, seller financing, or rate buy-down credit?
- Why hasn't it sold? Are there any deal-killer items the seller is aware of (foundation, flood, title, zoning, code violations)?
- Is there a deadline driving the sale (1031 exchange, divorce, estate, relocation)? That informs how much negotiation room exists.
- The area grade is low — what's the realistic commute time and amenity access for the typical tenant pool here? Any planned neighborhood developments (good or bad) we should know about?
- What's the average days-on-market for RENTAL listings here right now (not sales)? A rising rental-DOM trend means longer vacancies and softer asking-rent achievability than the comps imply.
- What's the recent tenant-quality profile in this submarket — average credit score on applications, eviction rate, late-payment / NSF rate, and stable-employment percentage? A property-management company in the area should have these aggregated.
- How much new for-sale + rental construction is in the pipeline within 1–3 miles? Heavy new supply typically softens prices + rents 12–24 months out; constrained supply supports both.
Investment metrics
- 1% rule
- 0.88% ✗
- Cap rate
- 5.90%
- Cash-on-cash
- -1.41%
- DSCR
- 0.94
- GRM
- 9.4
CMA / ARV
- ARV (on-the-fly)
- $282,240
- Comps found
- 4
Show comp detail 4 sales within ~0.75 mi
| Address | Dist | Beds/Ba | Sqft | Sold | Price | $/sf | Match |
|---|---|---|---|---|---|---|---|
| 6017 Black Springs Ln | 0.41mi | 3/2.0 (-1) | 1,680 (0%) | 1mo | $235,000 | $140 | 75 |
| 6112 Wild Berry Trl | 0.39mi | 4/2.0 | 1,756 (+4%) | 6mo | $315,000 | $179 | 69 |
| 2908 Berry Patch Ln | 0.19mi | 4/2.0 | 1,456 (-13%) | 15mo | $245,000 | $168 | 56 |
| 5921 Black Springs Ln | 0.37mi | 4/2.0 | 1,904 (+13%) | 7mo | $260,000 | $137 | 55 |
Match score weights: distance 35% · size 25% · config 20% · recency 20%. Top-matched comps best support the ARV.
Projected returns pro-forma
-3.0% appreciation · 3.0% rent growth · sell at horizon
- IRR
- -18.6%
- Equity multiple
- 0.35×
- Total profit
- $-46,568
- Equity at exit
- $38,021
- IRR
- -10.9%
- Equity multiple
- 0.34×
- Total profit
- $-47,043
- Equity at exit
- $22,048
Cash invested: $71,400 (down + closing). Projections, not guarantees.
Landlord ↔ Tenant lean methodology
- Overall (STATE)
- 87 Strongly Landlord-Friendly
- State Texas
- 87 Strongly Landlord-Friendly · R+5
- County
- — inherits STATE
- City
- — inherits STATE
ZIP-level market 76058
- Home prices YoY
- -24.5%
- Active inventory
- 421
- Price-to-rent
- 9.4×
Monthly cashflow live
- Estimated rent
- $2,251 medium interval (Pro) →
- Mortgage (P&I)
- −$1,337
- Tax from tax record
- −$419 /mo · $5,026/yr
- Insurance
- −$106
- HOA
- −$0
- Vacancy / Maint / Mgmt
- −$473
- Net cashflow
- $-84
Break-even live
Sensitivity live
| Price | -10% $60 | -5% $-12 | +0% $-84 | +5% $-156 | +10% $-228 |
|---|---|---|---|---|---|
| Rent | -10% $-262 | -5% $-173 | +0% $-84 | +5% $5 | +10% $94 |
| Rate | -1.0pp $45 | -0.5pp $-19 | base $-84 | +0.5pp $-150 | +1.0pp $-217 |
UW: 25.0% down · 7.5% · 30yr · 1.5% tax · 5.0% vac · 8.0% maint · 8.0% mgmt
Financing live
Cash to close
- Down payment
- $63,750
- Closing costs
- $7,650
- Reserves months
- —
- Total cash needed
- —
Loan-product check · same deal, 3 products live
Conventional
25% down · 7.5% · 30yr
- Down + closing
- —
- Monthly P&I
- —
- Monthly cashflow
- —
- DSCR
- —
- Eligible?
- —
Personal DTI + credit; lowest rate.
DSCR
20% down · 8.5% · 30yr
- Down + closing
- —
- Monthly P&I
- —
- Monthly cashflow
- —
- DSCR
- —
- Eligible?
- —
No personal income docs; deal must DSCR.
Hard money
10% down · 12.0% · 12mo
- Down + closing
- —
- Monthly P&I
- —
- Monthly cashflow
- —
- DSCR
- —
- Eligible?
- —
Short-term bridge; refi at stabilization.
Listing history 21 events
-
2026-04-29status Pending
-
2026-04-21historical Active Option Contract
-
2026-02-26$255,000 Active
-
2025-12-31soldstatus
-
2025-12-18historical
-
2025-12-13historical Active Option Contract
-
2025-11-16price $224,000
-
2025-11-16status Active
-
2025-11-09historical Active Option Contract
-
2025-11-07price $234,500
-
2025-10-24price $237,000
-
2025-10-14price $239,000
-
2025-09-10price $249,000
-
2025-09-05price $267,000
-
2025-08-27price $269,000
-
2025-08-24price $272,000
-
2025-08-08$275,000 Active
-
2023-02-28soldstatus
-
2022-08-22soldstatus
-
2005-05-02soldstatus
-
2004-09-20soldstatus
ⓘ Source: listings_history table (triggers on properties + properties_extension) + one-shot
backfill from property_details.listing_events for pre-trigger history.
Tax reassessment forecast TX · Resets to sale price
- Current annual tax
- $5,026 · $419/mo
- Projected year-2 tax
- $5,026 · $419/mo
- Expected delta
- $0/yr ($0/mo · 0.0%)
ⓘ Screening estimate from a state-policy table — verify with the county assessor before closing.
Climate risk First Street
- Flood 1/10 Low FEMA zone X (unshaded) · 0% chance over 30 yrs
- Wildfire 6/10 Major
- Heat 7/10 Severe 7 d/yr ≥109°F today · 23 d/yr by 30 yrs out
- Wind 6/10 Major 27% chance of damaging wind over 30 yrs
- Air quality 2/10 Low 1 unhealthy d/yr today · 2 by 30 yrs out
Nearby sold comps map
Loading sold comps map…
Walkable amenities ~0.75 mi
Loading nearby amenities…
Taxation est. · year 1
- Rental income
- $27,014
- − Mortgage interest
- −$14,284
- − Property taxes
- −$5,026
- − Insurance
- −$1,275
- − Repairs & maintenance
- −$2,161
- − Management
- −$2,161
- − Depreciation
- −$7,418
- Taxable loss
- −$5,311
- Est. tax savings @ 24.0%
- +$1,275
- After-tax cash flow
- $268/yr
For passive investors: Depreciation is non-cash, so a rental often shows a tax loss while cash-flowing — sheltering income. Rental losses are passive: they offset passive income freely, and up to $25,000/yr can offset ordinary (W-2) income if you actively participate and your MAGI is under $100k (phasing out to $0 by $150k); unused losses carry forward. On sale, claimed depreciation is recaptured at up to 25%, and gains may owe capital-gains tax (a 1031 exchange can defer both). Figures are a year-1 estimate at your 24.0% rate — not tax advice; consult a CPA.
Schools (NCES district)
- District
- Godley ISD
- NCES district ID
- 4820960
- Math proficiency
- 34% ▼ -4.00%
- Reading proficiency
- 38% ▲ 2.00%
- Median HH income
- $59,332
- Composite
- 32.06/100
- National rank
- #5820
- State rank
- #466 of 826 in TX
Livability — Burleson
- Score
- 79/100
- State rank
- #53
- US rank
- #2133
Category grades
Schools grade is shown separately in the Schools card above.
Census & demographics
- City population
- 81,549
- Population (ZIP)
- 21,531
Population outlook (Johnson County) Hauer SSP2
- Today (2025)
- 179,678 people
- By 2030
- 189,208 · +5.3%
- By 2040
- 207,261 · +15.4%
- By 2050
- 223,064 · +24.1%
- By 2075
- 259,979 · +44.7%
- By 2100
- 275,395 · +53.3%
Race, ethnicity, and origin ACS 2023
- Neighborhood character
- Predominantly White (67%)
- Race & ethnicity
- White 67% Hispanic / Latino 28% Two or more races 11% Black 2%
- Hispanic origin (detail)
- Mexican 26%
- Common ancestry
- Italian 2% Slovak 2% Portuguese 1%
- Foreign-born
- 7% · Canada
- Languages at home
- 80% English-only · Spanish 18% German/W. Germanic 1%
Political lean MEDSL · Johnson
- 2024 margin
- Solid R (+51.4) · D 23.9% · R 75.3%
- 2008→2024 swing
- -3.9pp toward R · 2008: -47.5pp · 2024: -51.4pp
- All cycles
- 2024: R+51.4 2020: R+53.0 2016: R+58.3 2012: R+55.6 2008: R+47.5
Not yet ingested
- Civics
- —
Market trends
- HPI YoY
- ▼ -86.22%
- Current HPI
- 265.6513
- Rent YoY
- —
- Metro
- —
- State GDP YoY
- ▲ 3.95%
- F500 in state
- 110
Industry mix (Fortune 500 HQ in TX)
| Industry | F500 HQs | Revenue |
|---|---|---|
| Energy | 16 | $1,198B |
|
||
| Technology | 5 | $198B |
|
||
| Engineering / Construction | 4 | $72B |
|
||
| Energy Services | 3 | $60B |
|
||
| Utilities | 3 | $41B |
|
||
| Healthcare | 2 | $330B |
|
||
Price history
-7.3% since first listed21 events — show timeline
- 2026-04-29 Pending — NTREIS
- 2026-04-21 Contingent — NTREIS
- 2026-02-26 Listed $255,000 NTREIS
- 2025-12-31 Sold (Public Records) — Public Records
- 2025-12-18 Listing Removed — NTREIS
- 2025-12-13 Contingent — NTREIS
- 2025-11-16 Price Changed $224,000 NTREIS
- 2025-11-16 Relisted — NTREIS
- 2025-11-09 Contingent — NTREIS
- 2025-11-07 Price Changed $234,500 NTREIS
- 2025-10-24 Price Changed $237,000 NTREIS
- 2025-10-14 Price Changed $239,000 NTREIS
- 2025-09-10 Price Changed $249,000 NTREIS
- 2025-09-05 Price Changed $267,000 NTREIS
- 2025-08-27 Price Changed $269,000 NTREIS
- 2025-08-24 Price Changed $272,000 NTREIS
- 2025-08-08 Listed $275,000 NTREIS
- 2023-02-28 Sold (Public Records) — Public Records
- 2022-08-22 Sold (Public Records) — Public Records
- 2005-05-02 Sold (Public Records) — Public Records
- 2004-09-20 Sold (Public Records) — Public Records
Property tax history
+10.7%/yrLatest (2025): $5,026 · +0.4% YoY. Source: county tax records.
Cash-flow waterfall
monthlySold comps — $/sqft
last 12 mo · ≤1 miLoading sold comps…