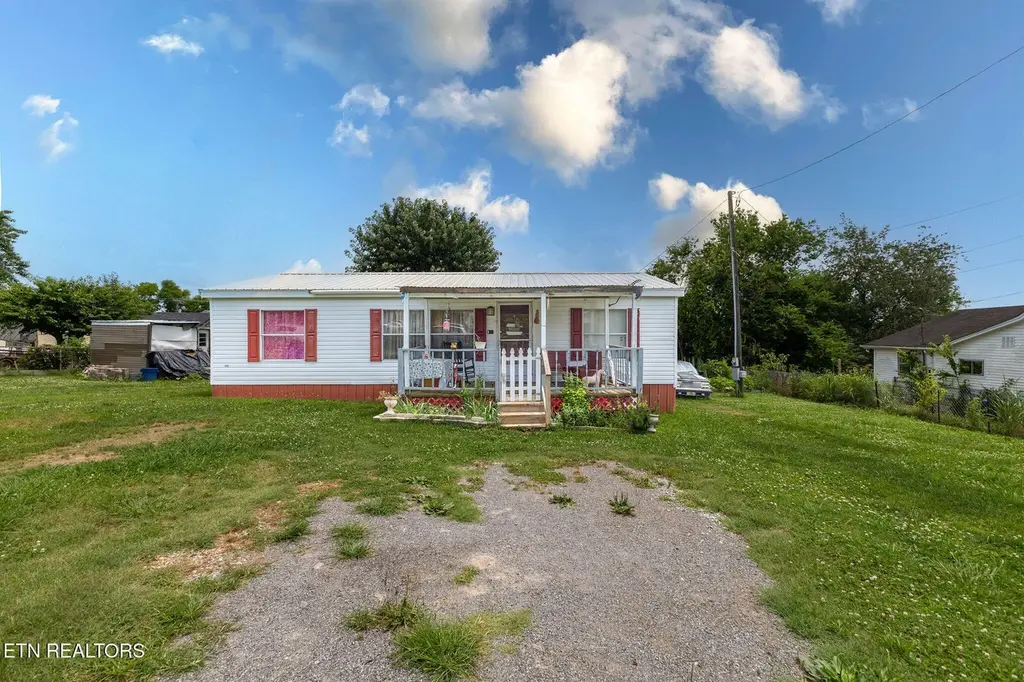
935 Summer St · Loudon, TN
Flood risk 1/10 · Minimal
- FEMA flood zone
- X (unshaded)
- Chance of flooding over 30 yrs
- 0.0%
- Est. flood insurance / yr
- $507 – $1,088
Fire risk 4/10 · Minor
- Est. fire insurance / yr
- $949 – $1,763
Heat risk 6/10 · Moderate
- Hot days now (above 103°F)
- 7 days/yr
- Hot days in 30 yrs
- 22 days/yr
Wind risk 2/10 · Minimal
- Chance of severe wind over 30 yrs
- 1.0%
Air-quality risk 3/10 · Minor
- Unhealthy air days now
- 2 days/yr
- Unhealthy air days in 30 yrs
- 2 days/yr
Risk factors via First Street. Map © Google.
Why this score? — see what drove the C grade
The composite is a weighted blend of 9 inputs, each scored 0–100. Each bar is that input's sub-score; the figure is the points it added to the 100-point composite (weight × sub-score).
- Cash flow +24.4/30.0
- DSCR +7.9/10.0
- ARV discount +7.5/15.0
- 1% rule +6.3/10.0
- Schools +3.2/10.0
- Livability +3.2/5.0
- Rent growth +2.5/5.0
- Condition / age +2.5/5.0
- Appreciation +0.0/10.0
$199,000
🖨 Deal sheet (PDF) 📄 Offer letter ✓ Due diligence
Listing remarks
Located right in downtown Loudon, this 3-bedroom, 2-bath home offers convenience and plenty of potential. With a functional layout and a fully fenced in yard, there's plenty of space to enjoy both inside and out. Just minutes from local restaurants, shops, schools, and everything downtown has to offer, this property is in a great location for homeowners and renters alike. Whether you're looking for a place to call home or a great addition to your investment portfolio, this property is full of opportunity. Don't miss your chance to own a home in the heart of Loudon! Home is being sold as is.
Key facts
- Great location
- Fully fenced yard
- 7,841 sq ft lot
Tags
Property features AI
Finance
- Other: Lot size approximately 0.18 acres (about 7,841 sq ft), dimensions 100x80
- Financial info: Not specified
- HOA & community: Not specified
Exterior
- Parking: On-street parking; Off-street parking
- Security: Not specified
- Utilities: Public sewer
- Home design: Detached property; 900 building area (reported by owner)
- Construction: Vinyl siding; Other construction materials
- Exterior features: Level lot; City view
Interior
- Kitchen: Microwave; Refrigerator
- Bedrooms: Not specified
- Flooring: Laminate flooring
- Bathrooms: 2 full bathrooms
- Heating & cooling: Central heating (electric); Central cooling
- Interior features: Eat-in kitchen; 4 total rooms
- Laundry & utility: Not specified
Neighborhood map
What this means for you Summary
Snapshot
- This is a 3-bed/2.0-bath manufactured listed at $199k.
Deal economics
- At list price, monthly cash flow is $406 ($5k/yr) — positive.
- The deal already cash-flows at list — no discount required.
- Meets the 1% rule at list price ($2k rent vs $199k).
- Cap rate 8.7% vs local median 3.2% in Loudon — top-decile yield for the area; either an underpriced asset or a hidden risk that comps aren't pricing in. Stress-test before assuming the spread holds.
Location & tenants
- Location reads 63/100 on livability (#190 in TN) — a middle-class / working-renter tenant base. Strengths: crime A+, cost of living A+, housing A+; Watch: employment D+, schools F, amenities F.
- Loudon County (rural): math 39% / reading 35% proficiency, ranked #18 of 139 in TN (top 13%) — families likely to look elsewhere, expect single-tenant / working-renter base with shorter leases.
- Market conditions: 436 active listings in the ZIP; 2 comparable units currently listed for rent nearby; solid renter incomes; 608 units permitted in Loudon County in 2024 (0 in 5+ unit buildings).
- This rent runs 31% of the median local income ($88k/yr) — at the standard rent-burdened threshold; future hikes will face affordability resistance.
Forward outlook
- Local home prices are declining (-3.0%/yr); year-one equity from $1k of loan paydown is wiped out by about $6k of value loss. Plan a longer hold.
- Loudon County population projected at +17% by 2050 — long-run rental-demand tailwind backs the buy-and-hold thesis.
Negotiation context
- Only 6 days on market — expect competitive offers; lowballing is unlikely to land.
Risks & watch-outs
- Climate carrying-cost: extreme-heat days projected 7→22/yr by 2055 (HVAC capex compounding) — expect insurance premiums to compound above CPI over the hold.
Questions for the listing agent
- Is there a deadline driving the sale (1031 exchange, divorce, estate, relocation)? That informs how much negotiation room exists.
- Schools are F-rated, which usually means shorter tenancies and higher turnover. Who's the typical renter profile here, and what's been the actual vacancy rate?
- What's the average days-on-market for RENTAL listings here right now (not sales)? A rising rental-DOM trend means longer vacancies and softer asking-rent achievability than the comps imply.
- What's the recent tenant-quality profile in this submarket — average credit score on applications, eviction rate, late-payment / NSF rate, and stable-employment percentage? A property-management company in the area should have these aggregated.
- How much new for-sale + rental construction is in the pipeline within 1–3 miles? Heavy new supply typically softens prices + rents 12–24 months out; constrained supply supports both.
Investment metrics
- 1% rule
- 1.13% ✓
- Cap rate
- 8.74%
- Cash-on-cash
- 8.74%
- DSCR
- 1.39
- GRM
- 7.4
CMA / ARV
No comps found within radius.
Projected returns pro-forma
-3.0% appreciation · 3.0% rent growth · sell at horizon
- IRR
- -3.0%
- Equity multiple
- 0.89×
- Total profit
- $-6,354
- Equity at exit
- $29,672
- IRR
- 6.7%
- Equity multiple
- 1.50×
- Total profit
- $27,903
- Equity at exit
- $17,206
Cash invested: $55,720 (down + closing). Projections, not guarantees.
Landlord ↔ Tenant lean methodology
- Overall (STATE)
- 87 Strongly Landlord-Friendly
- State Tennessee
- 87 Strongly Landlord-Friendly · R+13
- County
- — inherits STATE
- City
- — inherits STATE
ZIP-level market 37774
- Home prices YoY
- -12.8%
- Active inventory
- 436
- Price-to-rent
- 7.4×
Monthly cashflow live
- Estimated rent
- $2,255 medium interval (Pro) →
- Mortgage (P&I)
- −$1,044
- Tax est. 1.5%
- −$249 /mo · $2,985/yr
- Insurance
- −$83
- HOA
- −$0
- Vacancy / Maint / Mgmt
- −$473
- Net cashflow
- $406
Break-even live
Sensitivity live
| Price | -10% $544 | -5% $475 | +0% $406 | +5% $337 | +10% $268 |
|---|---|---|---|---|---|
| Rent | -10% $228 | -5% $317 | +0% $406 | +5% $495 | +10% $584 |
| Rate | -1.0pp $506 | -0.5pp $457 | base $406 | +0.5pp $354 | +1.0pp $302 |
UW: 25.0% down · 7.5% · 30yr · 1.5% tax · 5.0% vac · 8.0% maint · 8.0% mgmt
Financing live
Cash to close
- Down payment
- $49,750
- Closing costs
- $5,970
- Reserves months
- —
- Total cash needed
- —
Loan-product check · same deal, 3 products live
Conventional
25% down · 7.5% · 30yr
- Down + closing
- —
- Monthly P&I
- —
- Monthly cashflow
- —
- DSCR
- —
- Eligible?
- —
Personal DTI + credit; lowest rate.
DSCR
20% down · 8.5% · 30yr
- Down + closing
- —
- Monthly P&I
- —
- Monthly cashflow
- —
- DSCR
- —
- Eligible?
- —
No personal income docs; deal must DSCR.
Hard money
10% down · 12.0% · 12mo
- Down + closing
- —
- Monthly P&I
- —
- Monthly cashflow
- —
- DSCR
- —
- Eligible?
- —
Short-term bridge; refi at stabilization.
Rent comps 2 comps
| Address | Beds | Baths | Sqft | Rent | $/sqft | DOM | Units | Dist |
|---|---|---|---|---|---|---|---|---|
| 934 Carding Machine Rd Unit A2 Loudon, TN | 2.0 | 1.0 | 940 | $975 | $1.04 | 45d | 1 | 0.35mi |
| 934 Carding Machine Rd Unit B4 Loudon, TN | 2.0 | 1.0 | 940 | $1,100 | $1.17 | 11d | 1 | 0.35mi |
Listing history 6 events
-
2026-06-18days on market $199,000 Active 6 DOM
-
2026-06-17days on market $199,000 Active 5 DOM
-
2026-06-16days on market $199,000 Active 4 DOM
-
2026-06-15days on market $199,000 Active 3 DOM
-
2026-06-14remarks 600-char remark
-
2026-06-14$199,000 Active 1 DOM
ⓘ Source: listings_history table (triggers on properties + properties_extension) + one-shot
backfill from property_details.listing_events for pre-trigger history.
Climate risk First Street
- Flood 1/10 Low FEMA zone X (unshaded) · 0% chance over 30 yrs
- Wildfire 4/10 Moderate
- Heat 6/10 Major 7 d/yr ≥103°F today · 22 d/yr by 30 yrs out
- Wind 2/10 Low 100% chance of damaging wind over 30 yrs
- Air quality 3/10 Moderate 2 unhealthy d/yr today · 2 by 30 yrs out
Nearby sold comps map
Loading sold comps map…
Walkable amenities ~0.75 mi
Loading nearby amenities…
Taxation est. · year 1
- Rental income
- $27,057
- − Mortgage interest
- −$11,147
- − Property taxes
- −$2,985
- − Insurance
- −$995
- − Repairs & maintenance
- −$2,165
- − Management
- −$2,165
- − Depreciation
- −$5,789
- Taxable income
- $1,812
- Est. tax owed @ 24.0%
- −$435
- After-tax cash flow
- $4,437/yr
For passive investors: Depreciation is non-cash, so a rental often shows a tax loss while cash-flowing — sheltering income. Rental losses are passive: they offset passive income freely, and up to $25,000/yr can offset ordinary (W-2) income if you actively participate and your MAGI is under $100k (phasing out to $0 by $150k); unused losses carry forward. On sale, claimed depreciation is recaptured at up to 25%, and gains may owe capital-gains tax (a 1031 exchange can defer both). Figures are a year-1 estimate at your 24.0% rate — not tax advice; consult a CPA.
Schools (NCES district)
- District
- Loudon County
- NCES district ID
- 4702520
- Math proficiency
- 39% ▼ -13.00%
- Reading proficiency
- 35% ▼ -4.00%
- Median HH income
- $54,201
- Composite
- 32.43/100
- National rank
- #5724
- State rank
- #18 of 139 in TN
Livability — Loudon
- Score
- 63/100
- State rank
- #190
- US rank
- #15214
Category grades
Schools grade is shown separately in the Schools card above.
Census & demographics
- Census place
- Loudon, TN
- County
- Loudon County · 54,472 people
- City population
- 21,784
- Metro
- Knoxville, TN
- Population (ZIP)
- 21,784
- Household income
- $87,718
- Rent vs Own
- Severe rent burden
- 200.0
Population outlook (Loudon County) Hauer SSP2
- Today (2025)
- 55,364 people
- By 2030
- 57,414 · +3.7%
- By 2040
- 61,216 · +10.6%
- By 2050
- 64,846 · +17.1%
- By 2075
- 75,829 · +37.0%
- By 2100
- 85,693 · +54.8%
Race, ethnicity, and origin ACS 2023
- Neighborhood character
- Predominantly White (87%)
- Race & ethnicity
- White 87% Hispanic / Latino 9% Two or more races 6% Asian 2% Black 1%
- Hispanic origin (detail)
- Mexican 6%
- Common ancestry
- Serbian 3% Romanian 2% Slovak 2%
- Foreign-born
- 7% · Canada
- Languages at home
- 93% English-only · Spanish 6%
Political lean MEDSL · Loudon
- 2024 margin
- Solid R (+53.0) · D 23.0% · R 76.0% · Other 1.1%
- 2008→2024 swing
- -9.0pp toward R · 2008: -44.0pp · 2024: -53.0pp
- All cycles
- 2024: R+53.0 2020: R+50.3 2016: R+54.4 2012: R+52.8 2008: R+44.0
Not yet ingested
- Civics
- —
Market trends
- HPI YoY
- ▼ -47.04%
- Current HPI
- 320.0874
- Rent YoY
- —
- Metro
- Knoxville, TN
- State GDP YoY
- ▲ 2.78%
- F500 in state
- 22
Industry mix (Fortune 500 HQ in TN)
| Industry | F500 HQs | Revenue |
|---|---|---|
| Healthcare | 3 | $91B |
|
||
| Retail | 3 | $72B |
|
||
| Transportation / Logistics | 1 | $88B |
|
||
| Paper / Packaging | 1 | $19B |
|
||
| Insurance | 1 | $13B |
|
||
| Energy | 1 | $12B |
|
||
Price history
1 event — show timeline
- 2026-06-12 Listed $199,000 Knoxville MLS
Property tax history
-3.2%/yrLatest (2025): $256 · +0.0% YoY. Source: county tax records.
Cash-flow waterfall
monthlySold comps — $/sqft
last 12 mo · ≤1 miLoading sold comps…