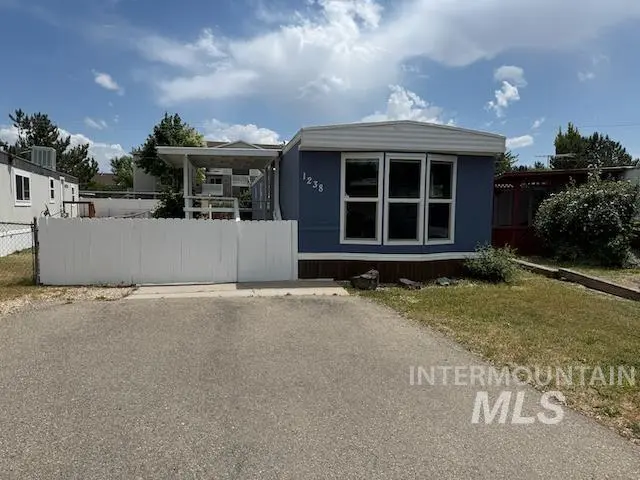
1238 N Sable Ln · Boise City, ID
Flood risk No data
- FEMA flood zone
- —
- Chance of flooding over 30 yrs
- —
- Est. flood insurance / yr
- —
Fire risk No data
- Est. fire insurance / yr
- —
Heat risk No data
- Hot days now (above threshold)
- —
- Hot days in 30 yrs
- —
Wind risk No data
- Chance of severe wind over 30 yrs
- —
Air-quality risk No data
- Unhealthy air days now
- —
- Unhealthy air days in 30 yrs
- —
Risk factors via First Street. Map © Google.
Why this score? — see what drove the A- grade
The composite is a weighted blend of 9 inputs, each scored 0–100. Each bar is that input's sub-score; the figure is the points it added to the 100-point composite (weight × sub-score).
- Cash flow +30.0/30.0
- ARV discount +12.5/15.0
- 1% rule +10.0/10.0
- DSCR +10.0/10.0
- Appreciation +5.0/10.0
- Schools +4.2/10.0
- Condition / age +3.8/5.0
- Rent growth +2.5/5.0
- Livability +2.5/5.0
$69,900
🖨 Deal sheet 📄 Offer letter ✓ Due diligence
Listing remarks
Affordable, low-maintenance living in Maple Grove Estates! This 2 bedroom, 1 bath home offers 924 square feet with a functional layout that feels open and inviting. The spacious kitchen and living room provide plenty of room to relax or entertain, with brand new carpet throughout, new light fixtures, and fresh paint adds a new updated touch. With manageable lot rent of $844.71/month and that includes sewer and trash, this is a great opportunity for comfortable living at an approachable price point.
Key facts
- Community pool
- Built 1984
- Listed 9 days
Property features AI
Finance
- Other: Small lot (approximately 5,999 sq ft) with manual sprinkler system; Homeowner tax exemption
- HOA & community: Located in Maple Grove Estates mobile home park
Exterior
- Utilities: City water service; Sewer connected; Cable connected
- Home design: Mobile/manufactured home on rented lot
- Construction: Built in 1984; Metal roof
- Exterior features: Metal fencing; Covered patio/deck; Storage shed; Community pool
Interior
- Bedrooms: 2 bedrooms (both on the main level)
- Bathrooms: 1 bathroom
- Heating & cooling: Electric heating; Central air conditioning
- Interior features: Laminate counters
- Laundry & utility: Electric water heater
Neighborhood map
What this means for you Summary
Snapshot
- This is a 2-bed/1.0-bath manufactured listed at $70k. Condition is rated good.
Deal economics
- At list price, monthly cash flow is $748 ($9k/yr) — positive.
- The deal already cash-flows at list — no discount required.
- Meets the 1% rule at list price ($2k rent vs $70k).
- Cap rate 19.1% vs local median 2.6% in Boise City — top-decile yield for the area; either an underpriced asset or a hidden risk that comps aren't pricing in. Stress-test before assuming the spread holds.
Location & tenants
- Location reads: area grade A — affects rentability + tenant quality, not the cash-flow math above.
- Boise Independent District (urban): math 42% / reading 56% proficiency, ranked #36 of 92 in ID (top 39%) — families likely to look elsewhere, expect single-tenant / working-renter base with shorter leases.
- Zoned schools: Capital Senior High School (math 34% / reading 57%, grade D-, #59 of 169 statewide, top 35%, 1,220 students, 28% FRL).
- Market conditions: 1 active listings in the ZIP; 37 comparable units currently listed for rent nearby; rentals at typical pace (median 22d on market — plan ~3-4 weeks tenant-placement turnaround); 5,129 units permitted in Ada County in 2024 (414 in 5+ unit buildings).
Forward outlook
- In year one you build about $3k of equity ($483 loan paydown + $2k appreciation (3.0% local appreciation)).
- Ada County population projected at +45% by 2050 — long-run rental-demand tailwind backs the buy-and-hold thesis.
- At projected returns (3.0% appreciation + 3.0% rent growth), your $20k cash investment doubles in ~2 years — after that, you're playing with house money.
Negotiation context
- Only 9 days on market — expect competitive offers; lowballing is unlikely to land.
- 3 sale attempts with the ask held roughly flat each time — persistent listings suggest the price (not the market) is what's stuck; bring a comps-based counter.
Questions for the listing agent
- Is there a deadline driving the sale (1031 exchange, divorce, estate, relocation)? That informs how much negotiation room exists.
- What's the average days-on-market for RENTAL listings here right now (not sales)? A rising rental-DOM trend means longer vacancies and softer asking-rent achievability than the comps imply.
- What's the recent tenant-quality profile in this submarket — average credit score on applications, eviction rate, late-payment / NSF rate, and stable-employment percentage? A property-management company in the area should have these aggregated.
- How much new for-sale + rental construction is in the pipeline within 1–3 miles? Heavy new supply typically softens prices + rents 12–24 months out; constrained supply supports both.
Investment metrics
- 1% rule
- 2.23% ✓
- Cap rate
- 19.14%
- Cash-on-cash
- 45.88%
- DSCR
- 3.04
- GRM
- 3.7
CMA / ARV
- ARV (on-the-fly)
- $78,540
- Comps found
- 7
Show comp detail 7 sales within ~0.75 mi
| Address | Dist | Beds/Ba | Sqft | Sold | Price | $/sf | Match |
|---|---|---|---|---|---|---|---|
| 8429 W Irving Ln | 0.18mi | 2/1.0 | 938 (+2%) | 0mo | $55,000 | $59 | 89 |
| 1250 N Sable | 0.01mi | 2/2.0 | 924 (0%) | 10mo | $90,000 | $97 | 88 |
| 8417 W Fairview Ave #4 | 0.16mi | 3/1.0 (+1) | 924 (0%) | 1mo | $75,000 | $81 | 87 |
| 1083 N Fox Ln | 0.11mi | 2/1.0 | 882 (-4%) | 24mo | $55,000 | $62 | 68 |
| 1328 N Arrow Ln | 0.11mi | 3/2.0 (+1) | 1,001 (+8%) | 8mo | $85,000 | $85 | 66 |
| 1011 N Fawn Ln | 0.18mi | 3/2.0 (+1) | 990 (+7%) | 8mo | $99,500 | $101 | 64 |
| 1221 N Arrow Ln #106 | 0.11mi | 2/2.0 | 980 (+6%) | 22mo | $88,500 | $90 | 63 |
Match score weights: distance 35% · size 25% · config 20% · recency 20%. Top-matched comps best support the ARV.
Projected returns pro-forma
3.0% appreciation · 3.0% rent growth · sell at horizon
- IRR
- 51.2%
- Equity multiple
- 3.87×
- Total profit
- $56,106
- Equity at exit
- $31,430
- IRR
- 50.8%
- Equity multiple
- 7.79×
- Total profit
- $132,979
- Equity at exit
- $48,437
Cash invested: $19,572 (down + closing). Projections, not guarantees.
Landlord ↔ Tenant lean methodology
- Overall (STATE)
- 91 Strongly Landlord-Friendly
- State Idaho
- 91 Strongly Landlord-Friendly · R+18
- County
- — inherits STATE
- City
- — inherits STATE
ZIP-level market 83704-9685
- Active inventory
- 1
- Price-to-rent
- 3.7×
Monthly cashflow live
- Estimated rent
- $1,559 high interval (Pro) →
- Mortgage (P&I)
- −$367
- Tax est. 1.5%
- −$87 /mo · $1,048/yr
- Insurance
- −$29
- HOA
- −$0
- Vacancy / Maint / Mgmt
- −$327
- Net cashflow
- $748
Break-even live
UW: 25.0% down · 7.5% · 30yr · 1.5% tax · 5.0% vac · 8.0% maint · 8.0% mgmt
Financing live
Cash to close
- Down payment
- $17,475
- Closing costs
- $2,097
- Reserves months
- —
- Total cash needed
- —
Loan-product check · same deal, 3 products live
Conventional
25% down · 7.5% · 30yr
- Down + closing
- —
- Monthly P&I
- —
- Monthly cashflow
- —
- DSCR
- —
- Eligible?
- —
Personal DTI + credit; lowest rate.
DSCR
20% down · 8.5% · 30yr
- Down + closing
- —
- Monthly P&I
- —
- Monthly cashflow
- —
- DSCR
- —
- Eligible?
- —
No personal income docs; deal must DSCR.
Hard money
10% down · 12.0% · 12mo
- Down + closing
- —
- Monthly P&I
- —
- Monthly cashflow
- —
- DSCR
- —
- Eligible?
- —
Short-term bridge; refi at stabilization.
Rent comps 37 comps
| Address | Beds | Baths | Sqft | Rent | $/sqft | DOM | Units | Dist |
|---|---|---|---|---|---|---|---|---|
| 930 N Maple Grove Rd Boise, ID | 1.0–3.0 | 1.0–2.0 | 950 | $1,920 | $2.02 | 3d | 14 | 0.21mi |
| 8443 W Rifleman St Unit 8443 Boise, ID | 2.0 | 1.0 | 846 | $1,900 | $2.25 | 3d | 1 | 0.26mi |
| 9130 W Irving St Boise, ID | 2.0 | 1.5 | 952 | $1,575 | $1.65 | 3d | 5 | 0.35mi |
| 9169 W Cory Ln #202 Boise, ID | 2.0 | 1.5 | 968 | $1,395 | $1.44 | 21d | 1 | 0.83mi |
| 2555 N Workland Ln Unit 202 Boise, ID | 2.0 | 1.0 | 800 | $1,325 | $1.66 | 14d | 1 | 0.88mi |
| 10077 W Rifleman Ln Unit 103 Boise, ID | 2.0 | 2.0 | 860 | $1,395 | $1.62 | 11d | 1 | 0.96mi |
| 10105 W Garverdale Ln Ste 201 Boise, ID | 2.0 | 2.0 | 915 | $1,350 | $1.48 | 14d | 1 | 1.00mi |
| 10096 W Garverdale Ln Boise, ID | 3.0 | 2.0 | 1113 | $1,600 | $1.44 | 23d | 1 | 1.00mi |
| 7479 W Holbrook Ln Boise, ID | 1.0 | 1.0 | 650 | $1,095 | $1.68 | 23d | 1 | 1.12mi |
| 9056 W Sigmont Ln Unit 201 Boise, ID | 2.0 | 2.0 | 900 | $1,300 | $1.44 | 14d | 1 | 1.13mi |
| 2722 N Retirement Ln Boise, ID | 1.0 | 1.0 | 590 | $1,095 | $1.86 | 23d | 1 | 1.13mi |
| 7460 W Holbrook Ln Boise, ID | 1.0 | 1.0 | 674 | $1,095 | $1.62 | 23d | 1 | 1.15mi |
| 1452 N Allumbaugh St Boise, ID | 2.0 | 2.5 | 1100 | $1,525 | $1.39 | 11d | 1 | 1.16mi |
| 950 N Allumbaugh St Boise, ID | 2.0 | 1.0 | 902 | $1,505 | $1.67 | 2d | 2 | 1.18mi |
| 6739 W Colehaven Dr Boise, ID | 2.0 | 2.0 | 1000 | $1,450 | $1.45 | 23d | 1 | 1.18mi |
| 6724 W Irving St Boise, ID | 2.0 | 2.0 | 1000 | $1,450 | $1.45 | 11d | 1 | 1.19mi |
| 6677 W Colehaven Dr Boise, ID | 2.0 | 2.0 | 1000 | $1,450 | $1.45 | 23d | 1 | 1.21mi |
| 657 White Cloud Dr Boise, ID | 2.0 | 1.0 | 950 | $1,345 | $1.42 | 3d | 1 | 1.21mi |
| 697 White Cloud Dr Boise, ID | 2.0 | 1.0 | 921 | $1,450 | $1.57 | 23d | 1 | 1.23mi |
| 7521 W Tottenham Ln Apt 202 Boise, ID | 3.0 | 2.0 | 1113 | $1,595 | $1.43 | 23d | 1 | 1.23mi |
| 6660 W Colehaven Dr Boise, ID | 2.0 | 2.0 | 1000 | $1,450 | $1.45 | 23d | 1 | 1.23mi |
| 9113 W Ustick Rd Unit 102 Boise, ID | 2.0 | 2.0 | 1000 | $1,525 | $1.52 | 23d | 1 | 1.23mi |
| 1407 N Fry Ln Boise, ID | 2.0 | 2.0 | 1000 | $1,450 | $1.45 | 3d | 1 | 1.24mi |
| 6641 W Colehaven Dr Boise, ID | 2.0 | 2.0 | 1000 | $1,450 | $1.45 | 23d | 1 | 1.24mi |
| 6758 W Clinton Ln Boise, ID | 2.0 | 1.0 | 900 | $1,345 | $1.49 | 23d | 1 | 1.25mi |
| 6652 W Irving St Boise, ID | 2.0 | 2.0 | 1000 | $1,450 | $1.45 | 23d | 1 | 1.26mi |
| 1406 N Fry Ln Boise, ID | 2.0 | 2.0 | 1000 | $1,450 | $1.45 | 3d | 1 | 1.26mi |
| 9131 W Ustick Rd Unit 104 Boise, ID | 2.0 | 2.0 | 1000 | $1,595 | $1.59 | 11d | 1 | 1.27mi |
| 1677 N Raymond St Boise, ID | 1.0 | 1.0 | 685 | $1,395 | $2.04 | 23d | 1 | 1.28mi |
| 1428 N Raymond St Unit 1408 104 Boise, ID | 1.0 | 1.0 | 740 | $1,195 | $1.61 | 23d | 1 | 1.29mi |
| 1408 N Raymond St Boise, ID | 1.0 | 1.0 | 740 | $1,195 | $1.61 | 23d | 1 | 1.30mi |
| 1411 N Liberty St Boise, ID | 2.0–4.0 | 1.5–2.0 | 1630 | $1,620 | $0.99 | 23d | 1 | 1.35mi |
| 1105 N Liberty St Boise, ID | 1.0–2.0 | 1.0 | 727 | $1,949 | $2.68 | 14d | 4 | 1.37mi |
| 6315 W Chet Ln Boise, ID | 2.0 | 2.5 | 1050 | $1,750 | $1.67 | 14d | 1 | 1.44mi |
| 6315 W Chet Ln Unit 6315 102 Boise, ID | 2.0 | 2.5 | 1050 | $1,750 | $1.67 | 3d | 1 | 1.45mi |
| 6315 W Chet Ln Unit 6307 102 Boise, ID | 2.0 | 2.5 | 1050 | $1,750 | $1.67 | 23d | 1 | 1.45mi |
| 8077 S Cummins Ave Boise, ID | 2.0 | 1.0 | 900 | $1,495 | $1.66 | 3d | 1 | 1.45mi |
Listing history 12 events
-
2026-06-07statusdays on market $69,900 Pending 9 DOM
-
2026-06-05days on market $69,900 Active 7 DOM
-
2026-06-03days on market $69,900 Active 6 DOM
-
2026-06-03days on market $69,900 Active 5 DOM
-
2026-06-01days on market $69,900 Active 4 DOM
-
2026-05-31days on market $69,900 Active 3 DOM
-
2026-05-28$69,900 Active
-
2026-04-17historical
-
2026-02-07$68,900 Active
-
2025-12-29historical
-
2025-10-22price $75,000
-
2025-08-28$80,000 Active
ⓘ Source: listings_history table (triggers on properties + properties_extension) + one-shot
backfill from property_details.listing_events for pre-trigger history.
Nearby sold comps map
Loading sold comps map…
Walkable amenities ~0.75 mi
Loading nearby amenities…
Taxation est. · year 1
- Rental income
- $18,705
- − Mortgage interest
- −$3,915
- − Property taxes
- −$1,048
- − Insurance
- −$350
- − Repairs & maintenance
- −$1,496
- − Management
- −$1,496
- − Depreciation
- −$2,033
- Taxable income
- $8,365
- Est. tax owed @ 24.0%
- −$2,008
- After-tax cash flow
- $6,972/yr
For passive investors: Depreciation is non-cash, so a rental often shows a tax loss while cash-flowing — sheltering income. Rental losses are passive: they offset passive income freely, and up to $25,000/yr can offset ordinary (W-2) income if you actively participate and your MAGI is under $100k (phasing out to $0 by $150k); unused losses carry forward. On sale, claimed depreciation is recaptured at up to 25%, and gains may owe capital-gains tax (a 1031 exchange can defer both). Figures are a year-1 estimate at your 24.0% rate — not tax advice; consult a CPA.
Condition & rehab AI · 13 photos
This 2-bedroom, 1-bath home in Maple Grove Estates is in good condition with recent updates, making it a great opportunity for comfortable living at an approachable price point.
Value-add opportunities
- Both new flooring — improves both resale and rental value
- Both new paint — enhances curb appeal and interior aesthetics
- Both landscaping — enhances curb appeal and adds value
Renovation cost estimate screening
Value-add ROI direction
- Both new flooring — improves both resale and rental value ↑
- Both new paint — enhances curb appeal and interior aesthetics ↑
- Both landscaping — enhances curb appeal and adds value ↑
ⓘ Cost ranges are severity-bucket heuristics (US national rule-of-thumb). Get contractor quotes + a written scope before underwriting a rehab budget.
Schools (NCES district)
- District
- Boise Independent District
- NCES district ID
- 1600360
- Math proficiency
- 42% ▼ -5.00%
- Reading proficiency
- 56% ▼ -1.00%
- Median HH income
- $49,135
- Composite
- 41.82/100
- National rank
- #3388
- State rank
- #36 of 92 in ID
Livability — Boise City
No livability data for this city. (Only ~50 U.S. cities are tracked.)
Census & demographics
- Census place
- Boise City, ID
Population outlook (Ada County) Hauer SSP2
- Today (2025)
- 535,818 people
- By 2030
- 585,751 · +9.3%
- By 2040
- 682,435 · +27.4%
- By 2050
- 775,818 · +44.8%
- By 2075
- 994,458 · +85.6%
- By 2100
- 1,148,884 · +114.4%
Not yet ingested
- Political lean
- —
- Race & ethnicity
- —
- Common origin
- —
- Civics
- —
Market trends
- HPI YoY
- —
- Current HPI
- —
- Rent YoY
- —
- Metro
- —
- State GDP YoY
- ▲ 4.51%
- F500 in state
- 6
Industry mix (Fortune 500 HQ in ID)
| Industry | F500 HQs | Revenue |
|---|---|---|
| Retail | 1 | $79B |
|
||
| Technology | 1 | $25B |
|
||
| Food / Agriculture | 1 | $6B |
|
||
Price history
-12.6% since first listed6 events — show timeline
- 2026-05-28 Listed $69,900 IMLS
- 2026-04-17 Listing Removed — IMLS
- 2026-02-07 Listed $68,900 IMLS
- 2025-12-29 Listing Removed — IMLS
- 2025-10-22 Price Changed $75,000 IMLS
- 2025-08-28 Listed $80,000 IMLS
Cash-flow waterfall
monthlySold comps — $/sqft
last 12 mo · ≤1 miLoading sold comps…