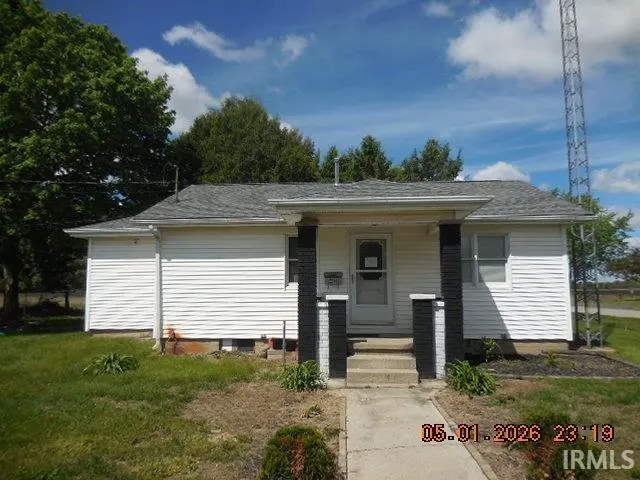
406 W Church St · Burnettsville, IN
Flood risk 1/10 · Minimal
- FEMA flood zone
- X (unshaded)
- Chance of flooding over 30 yrs
- 0.0%
- Est. flood insurance / yr
- $473 – $860
Fire risk 1/10 · Minimal
- Est. fire insurance / yr
- $717 – $1,331
Heat risk 3/10 · Minor
- Hot days now (above 101°F)
- 7 days/yr
- Hot days in 30 yrs
- 17 days/yr
Wind risk 2/10 · Minimal
- Chance of severe wind over 30 yrs
- 0.0%
Air-quality risk 2/10 · Minimal
- Unhealthy air days now
- 1 days/yr
- Unhealthy air days in 30 yrs
- 2 days/yr
Risk factors via First Street. Map © Google.
Why this score? — see what drove the C- grade
The composite is a weighted blend of 9 inputs, each scored 0–100. Each bar is that input's sub-score; the figure is the points it added to the 100-point composite (weight × sub-score).
- Cash flow +15.0/30.0
- ARV discount +7.5/15.0
- Appreciation +7.5/10.0
- 1% rule +5.0/10.0
- DSCR +5.0/10.0
- Schools +3.6/10.0
- Livability +3.1/5.0
- Rent growth +2.5/5.0
- Condition / age +2.5/5.0
$1
🖨 Deal sheet 📄 Offer letter ✓ Due diligence
Listing remarks MLS
Adorable 2 bed, 2 bath home with oversized detached garage. So many opportunities to make this home a country-living dream. Owner’s suite, large kitchen, and beautiful country views. Roof is 5 years old.
Key facts
- 0.4 acre lot
- 2 garage spots
- Built 1950
Property features AI
Finance
- HOA & community: No association amenities
Exterior
- Parking: Detached garage with garage door opener; Gravel and off-street parking; 2 garage spaces
- Utilities: Private well water; Septic tank sewer
- Home design: Single-family site-built home; One story; Above-grade finished living area reported
- Construction: Vinyl siding; Shingle roof; Block foundation; Built as site-built construction
- Exterior features: Level, wooded lot; No fencing; Lot dimensions approximately 132 x 132; Approximately 0.4 acre lot
Interior
- Bedrooms: Total of 5 rooms (bedroom count not specified)
- Flooring: Carpet; Vinyl
- Bathrooms: 2 full bathrooms, both on the main level
- Heating & cooling: Natural gas forced air heating; Central air conditioning
- Interior features: One fireplace; Full, unfinished basement
- Laundry & utility: Washer hookup located on the lower level
Neighborhood map
What this means for you Summary
Snapshot
- This is a 2-bed/1.0-bath single-family listed at $1.
Deal economics
- At list price, monthly cash flow is $774 ($9k/yr) — positive.
- The deal already cash-flows at list — no discount required.
- Meets the 1% rule at list price ($980 rent vs $1).
Location & tenants
- Location reads 61/100 on livability (#498 in IN) — a middle-class / working-renter tenant base. Strengths: cost of living A+, housing A+; Watch: crime D+, employment D, amenities F.
- Twin Lakes School Corporation (town): math 39% / reading 46% proficiency, ranked #116 of 301 in IN (top 38%) — families likely to look elsewhere, expect single-tenant / working-renter base with shorter leases.
- Zoned schools: Meadowlawn Elementary School (math 36% / reading 37%, grade F, #571 of 994 statewide, top 58%, 567 students, 56% FRL); Roosevelt Middle School (math 38% / reading 47%, grade D-, #98 of 330 statewide, top 30%, 523 students, 67% FRL); Twin Lakes Senior High School (math 37% / reading 62%, grade D, #123 of 369 statewide, top 36%, 674 students, 59% FRL) — zoned schools average 60% FRL vs 41% district-wide (20 pts higher); higher-poverty schools than district average — tighter screening recommended.
- Market conditions: 6 active listings in the ZIP; 47 units permitted in White County in 2024 (0 in 5+ unit buildings).
Forward outlook
- White County population projected at -19% by 2050 — secular population decline; favor cash flow + early exit over multi-decade hold.
- At projected returns (5.1% appreciation + 3.0% rent growth), your $0 cash investment doubles in ~1 year — after that, you're playing with house money.
Negotiation context
- It's been on market 45 days — a 3% lower offer ($0) is reasonable based on typical stale-listing flexibility.
- 2 sale attempts since 3y ago with the ask held roughly flat each time — persistent listings suggest the price (not the market) is what's stuck; bring a comps-based counter.
Risks & watch-outs
- Watch-outs: built in 1950 — expect roof / HVAC / electrical / plumbing capex.
Questions for the listing agent
- It's been on market 45 days. Have you received any prior offers? Is the seller open to a 5% concession, seller financing, or rate buy-down credit?
- Built in 1950 — when were the roof, HVAC, electrical panel, plumbing, and water heater last replaced?
- Is there a deadline driving the sale (1031 exchange, divorce, estate, relocation)? That informs how much negotiation room exists.
- Crime grade is D in this area — have there been break-ins, vandalism, or insurance claims at this property in the last 3 years? What carrier currently insures it and at what premium?
- What's the average days-on-market for RENTAL listings here right now (not sales)? A rising rental-DOM trend means longer vacancies and softer asking-rent achievability than the comps imply.
- What's the recent tenant-quality profile in this submarket — average credit score on applications, eviction rate, late-payment / NSF rate, and stable-employment percentage? A property-management company in the area should have these aggregated.
- How much new for-sale + rental construction is in the pipeline within 1–3 miles? Heavy new supply typically softens prices + rents 12–24 months out; constrained supply supports both.
Investment metrics
- 1% rule
- 97998.00% ✓
- Cap rate
- 929019.04%
- Cash-on-cash
- 3317902.67%
- DSCR
- 147629.00
- GRM
- 0.0
CMA / ARV
- ARV (median comp)
- $141,549
- List price
- $1
- Delta
- -100.00%
- Verdict
- UNDERPRICED
- Comps
- 9 within 1.0 mi
Show comp detail 2 sales within ~0.75 mi
| Address | Dist | Beds/Ba | Sqft | Sold | Price | $/sf | Match |
|---|---|---|---|---|---|---|---|
| 110 W 2nd St | 0.64mi | 2/1.0 | 986 (-9%) | 7mo | $99,500 | $101 | 50 |
| 108 S Logan St | 0.72mi | 2/1.0 | 970 (-10%) | 19mo | $94,500 | $97 | 33 |
Match score weights: distance 35% · size 25% · config 20% · recency 20%. Top-matched comps best support the ARV.
Projected returns pro-forma
5.08% appreciation · 3.0% rent growth · sell at horizon
- IRR
- —
- Equity multiple
- 176153.80×
- Total profit
- $49,323
- Equity at exit
- $1
- IRR
- —
- Equity multiple
- 380363.89×
- Total profit
- $106,502
- Equity at exit
- $1
Cash invested: $0 (down + closing). Projections, not guarantees.
Landlord ↔ Tenant lean methodology
- Overall (STATE)
- 90 Strongly Landlord-Friendly
- State Indiana
- 90 Strongly Landlord-Friendly · R+11
- County
- — inherits STATE
- City
- — inherits STATE
ZIP-level market 47926
- Home prices YoY
- 2.4%
- Active inventory
- 6
Monthly cashflow live
- Estimated rent
- $980 medium interval (Pro) →
- Mortgage (P&I)
- −$0
- Tax est. 1.5%
- −$0 /mo · $0/yr
- Insurance
- −$0
- HOA
- −$0
- Vacancy / Maint / Mgmt
- −$206
- Net cashflow
- $774
Break-even live
UW: 25.0% down · 7.5% · 30yr · 1.5% tax · 5.0% vac · 8.0% maint · 8.0% mgmt
Financing live
Cash to close
- Down payment
- $0
- Closing costs
- $0
- Reserves months
- —
- Total cash needed
- —
Loan-product check · same deal, 3 products live
Conventional
25% down · 7.5% · 30yr
- Down + closing
- —
- Monthly P&I
- —
- Monthly cashflow
- —
- DSCR
- —
- Eligible?
- —
Personal DTI + credit; lowest rate.
DSCR
20% down · 8.5% · 30yr
- Down + closing
- —
- Monthly P&I
- —
- Monthly cashflow
- —
- DSCR
- —
- Eligible?
- —
No personal income docs; deal must DSCR.
Hard money
10% down · 12.0% · 12mo
- Down + closing
- —
- Monthly P&I
- —
- Monthly cashflow
- —
- DSCR
- —
- Eligible?
- —
Short-term bridge; refi at stabilization.
Listing history 19 events
-
2026-06-18days on market $1 Active 45 DOM
-
2026-06-17days on market $1 Active 44 DOM
-
2026-06-16days on market $1 Active 43 DOM
-
2026-06-15days on market $1 Active 42 DOM
-
2026-06-13days on market $1 Active 40 DOM
-
2026-06-12days on market $1 Active 39 DOM
-
2026-06-09days on market $1 Active 36 DOM
-
2026-06-08days on market $1 Active 35 DOM
-
2026-06-07days on market $1 Active 34 DOM
-
2026-06-07days on market $1 Active 33 DOM
-
2026-06-04days on market $1 Active 30 DOM
-
2026-06-02days on market $1 Active 29 DOM
-
2026-06-01days on market $1 Active 28 DOM
-
2026-05-31days on market $1 Active 27 DOM
-
2026-05-31days on market $1 Active 26 DOM
-
2026-04-17$1 Active 310-char remark
-
2023-09-13soldstatus $138,000 Closed 209-char remark
Show marketing remark (209 chars)
Adorable 2 bed, 2 bath home with oversized detached garage. So many opportunities to make this home a country-living dream. Owner’s suite, large kitchen, and beautiful country views. Roof is 5 years old.
-
2023-08-24status Pending 209-char remark
Show marketing remark (209 chars)
Adorable 2 bed, 2 bath home with oversized detached garage. So many opportunities to make this home a country-living dream. Owner’s suite, large kitchen, and beautiful country views. Roof is 5 years old.
-
2023-07-19$149,900 Active 209-char remark
Show marketing remark (209 chars)
Adorable 2 bed, 2 bath home with oversized detached garage. So many opportunities to make this home a country-living dream. Owner’s suite, large kitchen, and beautiful country views. Roof is 5 years old.
ⓘ Source: listings_history table (triggers on properties + properties_extension) + one-shot
backfill from property_details.listing_events for pre-trigger history.
Climate risk First Street
- Flood 1/10 Low FEMA zone X (unshaded) · 0% chance over 30 yrs
- Wildfire 1/10 Low
- Heat 3/10 Moderate 7 d/yr ≥101°F today · 17 d/yr by 30 yrs out
- Wind 2/10 Low 0% chance of damaging wind over 30 yrs
- Air quality 2/10 Low 1 unhealthy d/yr today · 2 by 30 yrs out
Nearby sold comps map
Loading sold comps map…
Walkable amenities ~0.75 mi
Loading nearby amenities…
Taxation est. · year 1
- Rental income
- $11,760
- − Mortgage interest
- −$0
- − Property taxes
- −$0
- − Insurance
- −$0
- − Repairs & maintenance
- −$941
- − Management
- −$941
- − Depreciation
- −$0
- Taxable income
- $9,878
- Est. tax owed @ 24.0%
- −$2,371
- After-tax cash flow
- $6,919/yr
For passive investors: Depreciation is non-cash, so a rental often shows a tax loss while cash-flowing — sheltering income. Rental losses are passive: they offset passive income freely, and up to $25,000/yr can offset ordinary (W-2) income if you actively participate and your MAGI is under $100k (phasing out to $0 by $150k); unused losses carry forward. On sale, claimed depreciation is recaptured at up to 25%, and gains may owe capital-gains tax (a 1031 exchange can defer both). Figures are a year-1 estimate at your 24.0% rate — not tax advice; consult a CPA.
Schools (NCES district)
- District
- Twin Lakes School Corporation
- NCES district ID
- 1811580
- Math proficiency
- 39% ▼ -10.00%
- Reading proficiency
- 46% ▼ -5.00%
- Median HH income
- $48,963
- Composite
- 36.44/100
- National rank
- #4666
- State rank
- #116 of 301 in IN
Livability — Burnettsville
- Score
- 61/100
- State rank
- #498
- US rank
- #17722
Category grades
Schools grade is shown separately in the Schools card above.
Census & demographics
- Census place
- Burnettsville, IN
- Population (ZIP)
- 916
Population outlook (White County) Hauer SSP2
- Today (2025)
- 23,006 people
- By 2030
- 22,204 · -3.5%
- By 2040
- 20,441 · -11.1%
- By 2050
- 18,711 · -18.7%
- By 2075
- 14,989 · -34.8%
- By 2100
- 10,896 · -52.6%
Race, ethnicity, and origin ACS 2023
- Neighborhood character
- Predominantly White (96%)
- Race & ethnicity
- White 96% Hispanic / Latino 3% Two or more races 2%
- Common ancestry
- Italian 3% Romanian 2% Slovak 2%
Political lean MEDSL · White
- 2024 margin
- Solid R (+45.0) · D 26.4% · R 71.4% · Other 2.2%
- 2008→2024 swing
- -36.7pp toward R · 2008: -8.3pp · 2024: -45.0pp
- All cycles
- 2024: R+45.0 2020: R+44.1 2016: R+42.9 2012: R+23.6 2008: R+8.3
Not yet ingested
- Civics
- —
Market trends
- HPI YoY
- ▲ 5.08%
- Current HPI
- 219.708
- Rent YoY
- —
- Metro
- —
- State GDP YoY
- ▲ 2.90%
- F500 in state
- 18
Industry mix (Fortune 500 HQ in IN)
| Industry | F500 HQs | Revenue |
|---|---|---|
| Industrial Machinery | 2 | $37B |
|
||
| Healthcare | 1 | $177B |
|
||
| Pharmaceuticals | 1 | $45B |
|
||
| Metals / Steel | 1 | $18B |
|
||
| Agriculture | 1 | $17B |
|
||
| Packaging | 1 | $12B |
|
||
Price history
-7.9% since first listed4 events — show timeline
- 2026-04-17 Listed $1 IRMLS
- 2023-09-13 Sold (MLS) $138,000 IRMLS
- 2023-08-24 Pending — IRMLS
- 2023-07-19 Listed $149,900 IRMLS
Property tax history
+7.1%/yrLatest (2024): $531 · +21.8% YoY. Source: county tax records.
Cash-flow waterfall
monthlySold comps — $/sqft
last 12 mo · ≤1 miLoading sold comps…