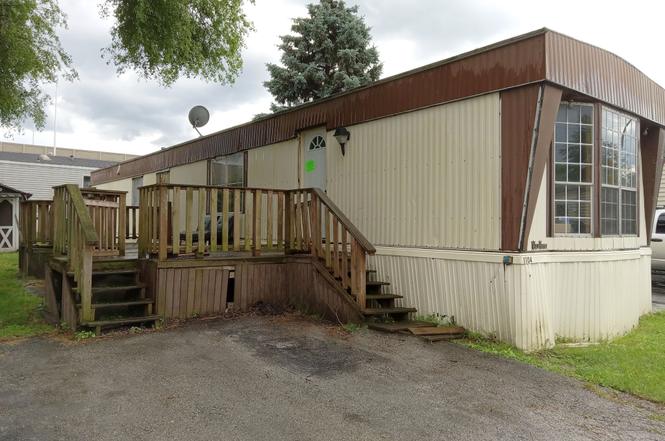
1104 Testa 1104t Not Applicable · Willow Springs, IL
Flood risk 6/10 · Moderate
- FEMA flood zone
- X (unshaded)
- Chance of flooding over 30 yrs
- 0.67%
- Est. flood insurance / yr
- $507 – $1,088
Fire risk 1/10 · Minimal
- Est. fire insurance / yr
- $804 – $1,492
Heat risk 3/10 · Minor
- Hot days now (above 101°F)
- 7 days/yr
- Hot days in 30 yrs
- 15 days/yr
Wind risk 2/10 · Minimal
- Chance of severe wind over 30 yrs
- 1.0%
Air-quality risk 3/10 · Minor
- Unhealthy air days now
- 3 days/yr
- Unhealthy air days in 30 yrs
- 3 days/yr
Risk factors via First Street. Map © Google.
Why this score? — see what drove the D grade
The composite is a weighted blend of 9 inputs, each scored 0–100. Each bar is that input's sub-score; the figure is the points it added to the 100-point composite (weight × sub-score).
- Cash flow +15.0/30.0
- ARV discount +7.5/15.0
- 1% rule +5.0/10.0
- DSCR +5.0/10.0
- Livability +3.5/5.0
- Rent growth +2.5/5.0
- Condition / age +2.5/5.0
- Schools +1.8/10.0
- Appreciation +0.0/10.0
$23,700
🖨 Deal sheet 📄 Offer letter ✓ Due diligence
Key facts
- Fitness center
- Card room
- Playground
Tags
Property features AI
Finance
- Financial info: List price $23,700
Exterior
- Home design: Spec new construction, plan 75435; Active listing
Interior
- Bedrooms: 2 bedrooms
- Bathrooms: 1 full bathroom
- Interior features: Living area of 952
Neighborhood map
What this means for you Summary
Snapshot
- This is a 2-bed/1.0-bath manufactured listed at $24k.
Deal economics
- At list price, monthly cash flow is $934 ($11k/yr) — positive.
- The deal already cash-flows at list — no discount required.
- Meets the 1% rule at list price ($1k rent vs $24k).
- Recommended offer: $21k (12.0% below list) — sets the bar for market timing.
- Cap rate 53.6% vs local median 5.5% in Willow Springs — top-decile yield for the area; either an underpriced asset or a hidden risk that comps aren't pricing in. Stress-test before assuming the spread holds.
Location & tenants
- Location reads 70/100 on livability (#371 in IL) — a middle-class / working-renter tenant base. Strengths: crime A+, employment A+, housing A+; Watch: schools D+, cost of living D+, amenities F.
- Argo Chsd 217 (suburban): math 20% / reading 20% proficiency, ranked #423 of 620 in IL (top 68%) — low school quality limits family demand, transient renter base, plan for 1-2y turnover.
- Market conditions: 43 active listings in the ZIP; 5 comparable units currently listed for rent nearby; rentals at typical pace (median 25d on market — plan ~3-4 weeks tenant-placement turnaround); 6,272 units permitted in Cook County in 2024 (4,658 in 5+ unit buildings).
Forward outlook
- Local home prices are declining (-3.0%/yr); year-one equity from $164 of loan paydown is wiped out by about $711 of value loss. Plan a longer hold.
- At projected returns (-3.0% appreciation + 3.0% rent growth), your $7k cash investment doubles in ~1 year — after that, you're playing with house money.
Negotiation context
- It's been on market 741 days — a 12% lower offer ($21k) is reasonable based on typical stale-listing flexibility.
Risks & watch-outs
- Climate carrying-cost: major flood risk — expect insurance premiums to compound above CPI over the hold.
Questions for the listing agent
- It's been on market 741 days. Have you received any prior offers? Is the seller open to a 12% concession, seller financing, or rate buy-down credit?
- Why hasn't it sold? Are there any deal-killer items the seller is aware of (foundation, flood, title, zoning, code violations)?
- Is there a deadline driving the sale (1031 exchange, divorce, estate, relocation)? That informs how much negotiation room exists.
- Schools are D-rated, which usually means shorter tenancies and higher turnover. Who's the typical renter profile here, and what's been the actual vacancy rate?
- The area grade is low — what's the realistic commute time and amenity access for the typical tenant pool here? Any planned neighborhood developments (good or bad) we should know about?
- What's the average days-on-market for RENTAL listings here right now (not sales)? A rising rental-DOM trend means longer vacancies and softer asking-rent achievability than the comps imply.
- What's the recent tenant-quality profile in this submarket — average credit score on applications, eviction rate, late-payment / NSF rate, and stable-employment percentage? A property-management company in the area should have these aggregated.
- How much new for-sale + rental construction is in the pipeline within 1–3 miles? Heavy new supply typically softens prices + rents 12–24 months out; constrained supply supports both.
Investment metrics
- 1% rule
- 5.86% ✓
- Cap rate
- 53.57%
- Cash-on-cash
- 168.85%
- DSCR
- 8.51
- GRM
- 1.4
CMA / ARV
No comps found within radius.
Projected returns pro-forma
-3.0% appreciation · 3.0% rent growth · sell at horizon
- IRR
- —
- Equity multiple
- 9.39×
- Total profit
- $55,650
- Equity at exit
- $3,534
- IRR
- —
- Equity multiple
- 19.85×
- Total profit
- $125,120
- Equity at exit
- $2,049
Cash invested: $6,636 (down + closing). Projections, not guarantees.
Landlord ↔ Tenant lean methodology
- Overall (STATE)
- 43 Moderately Tenant-Leaning
- State Illinois
- 43 Moderately Tenant-Leaning · D+7
- County
- — inherits STATE
- City
- — inherits STATE
ZIP-level market 60458
- Home prices YoY
- -32.8%
- Active inventory
- 43
- Price-to-rent
- 1.4×
Monthly cashflow live
- Estimated rent
- $1,389 high interval (Pro) →
- Mortgage (P&I)
- −$124
- Tax est. 1.5%
- −$30 /mo · $356/yr
- Insurance
- −$10
- HOA
- −$0
- Vacancy / Maint / Mgmt
- −$292
- Net cashflow
- $934
Break-even live
UW: 25.0% down · 7.5% · 30yr · 1.5% tax · 5.0% vac · 8.0% maint · 8.0% mgmt
Financing live
Cash to close
- Down payment
- $5,925
- Closing costs
- $711
- Reserves months
- —
- Total cash needed
- —
Loan-product check · same deal, 3 products live
Conventional
25% down · 7.5% · 30yr
- Down + closing
- —
- Monthly P&I
- —
- Monthly cashflow
- —
- DSCR
- —
- Eligible?
- —
Personal DTI + credit; lowest rate.
DSCR
20% down · 8.5% · 30yr
- Down + closing
- —
- Monthly P&I
- —
- Monthly cashflow
- —
- DSCR
- —
- Eligible?
- —
No personal income docs; deal must DSCR.
Hard money
10% down · 12.0% · 12mo
- Down + closing
- —
- Monthly P&I
- —
- Monthly cashflow
- —
- DSCR
- —
- Eligible?
- —
Short-term bridge; refi at stabilization.
Rent comps 5 comps
| Address | Beds | Baths | Sqft | Rent | $/sqft | DOM | Units | Dist |
|---|---|---|---|---|---|---|---|---|
| 100 Vana Dr Unit 1BED Willow Springs, IL | 1.0 | 1.0 | 700 | $1,275 | $1.82 | 17d | 1 | 0.37mi |
| 7601 Banks St Unit 2E Justice, IL | 2.0 | 1.0 | 1000 | $1,600 | $1.60 | 13d | 1 | 0.63mi |
| 8451 82nd St Unit 1N Justice, IL | 2.0 | 1.0 | 820 | $1,450 | $1.77 | 24d | 1 | 1.24mi |
| 7914 S 83rd Ct Unit 1S Justice, IL | 1.0 | 1.0 | 850 | $1,300 | $1.53 | 24d | 1 | 1.30mi |
| 8500 W 87th St Unit 11 Hickory Hills, IL | 1.0 | 1.0 | 750 | $1,250 | $1.67 | 24d | 1 | 1.48mi |
Listing history 13 events
-
2026-06-18days on market $23,700 Active 741 DOM
-
2026-06-17days on market $23,700 Active 740 DOM
-
2026-06-16days on market $23,700 Active 739 DOM
-
2026-06-15days on market $23,700 Active 738 DOM
-
2026-06-13days on market $23,700 Active 736 DOM
-
2026-06-09days on market $23,700 Active 732 DOM
-
2026-06-08days on market $23,700 Active 731 DOM
-
2026-06-07days on market $23,700 Active 730 DOM
-
2026-06-04days on market $23,700 Active 727 DOM
-
2026-06-03days on market $23,700 Active 726 DOM
-
2026-06-02days on market $23,700 Active 725 DOM
-
2026-06-01days on market $23,700 Active 724 DOM
-
2026-05-31days on market $23,700 Active 723 DOM
ⓘ Source: listings_history table (triggers on properties + properties_extension) + one-shot
backfill from property_details.listing_events for pre-trigger history.
Climate risk First Street
- Flood 6/10 Major FEMA zone X (unshaded) · 67% chance over 30 yrs
- Wildfire 1/10 Low
- Heat 3/10 Moderate 7 d/yr ≥101°F today · 15 d/yr by 30 yrs out
- Wind 2/10 Low 100% chance of damaging wind over 30 yrs
- Air quality 3/10 Moderate 3 unhealthy d/yr today · 3 by 30 yrs out
Nearby sold comps map
Loading sold comps map…
Walkable amenities ~0.75 mi
Loading nearby amenities…
Taxation est. · year 1
- Rental income
- $16,671
- − Mortgage interest
- −$1,328
- − Property taxes
- −$356
- − Insurance
- −$118
- − Repairs & maintenance
- −$1,334
- − Management
- −$1,334
- − Depreciation
- −$689
- Taxable income
- $11,513
- Est. tax owed @ 24.0%
- −$2,763
- After-tax cash flow
- $8,442/yr
For passive investors: Depreciation is non-cash, so a rental often shows a tax loss while cash-flowing — sheltering income. Rental losses are passive: they offset passive income freely, and up to $25,000/yr can offset ordinary (W-2) income if you actively participate and your MAGI is under $100k (phasing out to $0 by $150k); unused losses carry forward. On sale, claimed depreciation is recaptured at up to 25%, and gains may owe capital-gains tax (a 1031 exchange can defer both). Figures are a year-1 estimate at your 24.0% rate — not tax advice; consult a CPA.
Schools (NCES district)
- District
- Argo Chsd 217
- NCES district ID
- 1704020
- Math proficiency
- 20% ▼ -7.00%
- Reading proficiency
- 20% ▼ -6.00%
- Median HH income
- $47,451
- Composite
- 17.68/100
- National rank
- #9026
- State rank
- #423 of 620 in IL
Livability — Willow Springs
- Score
- 70/100
- State rank
- #371
- US rank
- #7733
Category grades
Schools grade is shown separately in the Schools card above.
Census & demographics
- Population (ZIP)
- 14,153
Population outlook (Cook County) Hauer SSP2
- Today (2025)
- 5,347,519 people
- By 2030
- 5,357,703 · +0.2%
- By 2040
- 5,324,924 · -0.4%
- By 2050
- 5,230,762 · -2.2%
- By 2075
- 4,785,735 · -10.5%
- By 2100
- 4,188,836 · -21.7%
Race, ethnicity, and origin ACS 2023
- Neighborhood character
- Diverse neighborhood (Simpson 0.64)
- Race & ethnicity
- White 52% Hispanic / Latino 21% Black 20% Two or more races 10% Asian 4%
- Hispanic origin (detail)
- Mexican 15% Puerto Rican 3%
- Common ancestry
- Romanian 21%
- Foreign-born
- 25% · Canada, China
- Languages at home
- 57% English-only · Russian/Polish/Slavic 18% Spanish 14% Arabic 7%
Political lean MEDSL · Cook
- 2024 margin
- Solid D (+42.0) · D 70.4% · R 28.4% · Other 1.2%
- 2008→2024 swing
- -11.4pp toward R · 2008: 53.4pp · 2024: 42.0pp
- All cycles
- 2024: D+42.0 2020: D+50.3 2016: D+53.0 2012: D+49.4 2008: D+53.4
Not yet ingested
- Civics
- —
Market trends
- HPI YoY
- ▼ -107.45%
- Current HPI
- 220.3837
- Rent YoY
- —
- Metro
- —
- State GDP YoY
- ▲ 1.59%
- F500 in state
- 60
Industry mix (Fortune 500 HQ in IL)
| Industry | F500 HQs | Revenue |
|---|---|---|
| Insurance | 4 | $201B |
|
||
| Consumer Goods | 4 | $87B |
|
||
| Industrial Machinery | 3 | $64B |
|
||
| Healthcare | 2 | $55B |
|
||
| Retail / Pharmacy | 1 | $148B |
|
||
| Agriculture / Food | 1 | $86B |
|
||
Cash-flow waterfall
monthlySold comps — $/sqft
last 12 mo · ≤1 miLoading sold comps…