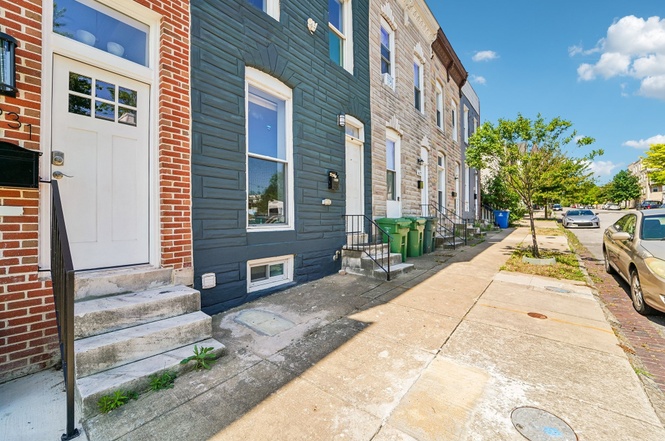
1629 E Oliver St · Baltimore, MD
Flood risk 1/10 · Minimal
- FEMA flood zone
- X (unshaded)
- Chance of flooding over 30 yrs
- 0.0%
- Est. flood insurance / yr
- $473 – $860
Fire risk 1/10 · Minimal
- Est. fire insurance / yr
- $755 – $1,403
Heat risk 7/10 · Major
- Hot days now (above 103°F)
- 7 days/yr
- Hot days in 30 yrs
- 15 days/yr
Wind risk 6/10 · Moderate
- Chance of severe wind over 30 yrs
- 27.0%
Air-quality risk 4/10 · Minor
- Unhealthy air days now
- 6 days/yr
- Unhealthy air days in 30 yrs
- 7 days/yr
Risk factors via First Street. Map © Google.
Why this score? — see what drove the C+ grade
The composite is a weighted blend of 9 inputs, each scored 0–100. Each bar is that input's sub-score; the figure is the points it added to the 100-point composite (weight × sub-score).
- Cash flow +24.8/30.0
- DSCR +8.0/10.0
- ARV discount +7.5/15.0
- 1% rule +7.2/10.0
- Appreciation +4.7/10.0
- Rent growth +3.8/5.0
- Livability +3.8/5.0
- Condition / age +2.5/5.0
- Schools +1.0/10.0
$210,000
🖨 Deal sheet 📄 Offer letter ✓ Due diligence
Listing remarks MLS
Delightfully renovated brick rowhome located in the heart of east Baltimore featuring an open floor plan, contemporary luxury vinyl plank flooring, freshly painted walls, tray ceilings, and an exposed brick fireplace mantle. Rejuvenated kitchen contains granite countertop, stainless steel appliances and shining wood cabinets. Upper level boasts a large owner’s suite with sky-high ceilings and a beautifully tiled full bathroom containing new vanity, bright lighting, and shower. A long hallway accentuated by an exposed brick wall leads to two more generously sized bedrooms and a second revitalized bathroom. This home is a steal for 1st-time homebuyers and savvy investors who can apply drywall to this meticulously framed open basement to immediately increase home equity and/or maximize rental rates. Enjoy peace of mind, with one-year home warranty for purchases at or above list price. Proximity to Johns Hopkins, Northeast Market, Fells Point, Canton, Harbor East, Federal Hill, CFG Bank Arena, the Inner Harbor, Power Plant, I-95, 83 and so much more! This is the ONE! Schedule a showing today!
Key facts
- Built 1914
- Listed 3 days
Property features AI
Finance
- Other: Improvement and land assessed values on record
- Financial info: Ownership is ground rent (semi-annual ground rent payment); Ground rent amount applies
Exterior
- Parking: On-street parking; Parking lot
- Utilities: Public water; Public sewer; Electric service
- Home design: Interior townhouse/rowhouse; Brick construction
- Construction: Brick exterior; Block and brick/mortar foundation; Year built per assessor
- Exterior features: Unfinished heated basement with interior access; Above-grade and below-grade structures; Located in city limits
Interior
- Kitchen: Built-in microwave; Stove; Refrigerator; Dishwasher
- Bedrooms: Three bedrooms on the first upper level; Entry-level bedroom
- Flooring: Luxury vinyl tile; Carpet
- Bathrooms: Two full bathrooms (all upper levels)
- Heating & cooling: Forced air heating; Natural gas heating and hot water; Central air conditioning (electric)
- Interior features: Dining area; Combination kitchen and dining; Carpeted areas; Bathroom with walk-in shower; Elevator access; Traditional floor plan; Recessed lighting; Drywall walls; Vaulted ceilings
- Laundry & utility: Washer; Dryer
Neighborhood map
What this means for you Summary
Snapshot
- This is a 3-bed/1.0-bath townhouse listed at $210k.
Deal economics
- At list price, monthly cash flow is $443 ($5k/yr) — positive.
- The deal already cash-flows at list — no discount required.
- Meets the 1% rule at list price ($3k rent vs $210k).
- Cap rate 8.8% vs local median 6.0% in Baltimore — top-decile yield for the area; either an underpriced asset or a hidden risk that comps aren't pricing in. Stress-test before assuming the spread holds.
Location & tenants
- Location reads 76/100 on livability (#90 in MD, #3,396 nationally) — a middle-class / working-renter tenant base. Strengths: amenities A+, commute A+, housing A+; Watch: schools D, crime F.
- Baltimore City Public Schools (urban): math 7% / reading 16% proficiency, ranked #24 of 24 in MD (top 100%) — low school quality limits family demand, transient renter base, plan for 1-2y turnover; 79% free/reduced lunch — lower-income household profile, screen leases tightly.
- Market conditions: Rents rising fast (+5.2%/yr); 319 active listings in the ZIP; 3 comparable units currently listed for rent nearby; rentals leasing fast (median 3d on market — plan ~1-2 weeks tenant-placement turnaround); 1,273 units permitted in Baltimore city in 2024 (1,104 in 5+ unit buildings).
- At $2,561/mo this rent would consume 60% of the median local household income ($51k/yr) (locally 1868% of renters already pay >50% of income on rent) — very limited rent-growth headroom before tenants either downsize or default.
Forward outlook
- In year one you build about $259 of equity ($1k loan paydown + $-1k appreciation (-0.6% local appreciation)).
- Baltimore County population projected to shrink 4% by 2050 — rents likely to lag national; underwrite the cash flow, not the appreciation.
- At projected returns (-0.6% appreciation + 5.2% rent growth), your $59k cash investment doubles in ~7 years — after that, you're playing with house money.
Negotiation context
- Only 3 days on market — expect competitive offers; lowballing is unlikely to land.
- 11 sale attempts since 12y ago with the ask held roughly flat each time — persistent listings suggest the price (not the market) is what's stuck; bring a comps-based counter.
- Current owner paid $142k; 48% above their basis — modest negotiation headroom, anchor on the comps not their cost.
Risks & watch-outs
- Watch-outs: built in 1914 — expect roof / HVAC / electrical / plumbing capex.
- Climate carrying-cost: major wind risk, 27% chance of damaging wind over 30y; extreme-heat days projected 7→15/yr by 2055 (HVAC capex compounding) — expect insurance premiums to compound above CPI over the hold.
Questions for the listing agent
- Built in 1914 — when were the roof, HVAC, electrical panel, plumbing, and water heater last replaced?
- Is there a deadline driving the sale (1031 exchange, divorce, estate, relocation)? That informs how much negotiation room exists.
- Schools are D-rated, which usually means shorter tenancies and higher turnover. Who's the typical renter profile here, and what's been the actual vacancy rate?
- Crime grade is F in this area — have there been break-ins, vandalism, or insurance claims at this property in the last 3 years? What carrier currently insures it and at what premium?
- What's the average days-on-market for RENTAL listings here right now (not sales)? A rising rental-DOM trend means longer vacancies and softer asking-rent achievability than the comps imply.
- What's the recent tenant-quality profile in this submarket — average credit score on applications, eviction rate, late-payment / NSF rate, and stable-employment percentage? A property-management company in the area should have these aggregated.
- How much new for-sale + rental construction is in the pipeline within 1–3 miles? Heavy new supply typically softens prices + rents 12–24 months out; constrained supply supports both.
Investment metrics
- 1% rule
- 1.22% ✓
- Cap rate
- 8.83%
- Cash-on-cash
- 9.05%
- DSCR
- 1.40
- GRM
- 6.8
CMA / ARV
No comps found within radius.
Projected returns pro-forma
-0.57% appreciation · 5.25% rent growth · sell at horizon
- IRR
- 8.2%
- Equity multiple
- 1.38×
- Total profit
- $22,596
- Equity at exit
- $55,081
- IRR
- 15.6%
- Equity multiple
- 2.76×
- Total profit
- $103,436
- Equity at exit
- $61,670
Cash invested: $58,800 (down + closing). Projections, not guarantees.
Landlord ↔ Tenant lean methodology
- Overall (CITY)
- 12 Strongly Tenant-Friendly
- State Maryland
- 27 Tenant-Leaning · D+14
- County
- — inherits STATE
- City Baltimore
- 12 Strongly Tenant-Friendly · D+58
ZIP-level market 21213
- Home prices YoY
- -0.1%
- Rents YoY
- 5.2%
- Active inventory
- 319
- Price-to-rent
- 6.8×
Monthly cashflow live
- Estimated rent
- $2,561 medium interval (Pro) →
- Mortgage (P&I)
- −$1,101
- Tax from tax record
- −$391 /mo · $4,698/yr
- Insurance
- −$88
- HOA
- −$0
- Vacancy / Maint / Mgmt
- −$538
- Net cashflow
- $443
Break-even live
UW: 25.0% down · 7.5% · 30yr · 1.5% tax · 5.0% vac · 8.0% maint · 8.0% mgmt
Financing live
Cash to close
- Down payment
- $52,500
- Closing costs
- $6,300
- Reserves months
- —
- Total cash needed
- —
Loan-product check · same deal, 3 products live
Conventional
25% down · 7.5% · 30yr
- Down + closing
- —
- Monthly P&I
- —
- Monthly cashflow
- —
- DSCR
- —
- Eligible?
- —
Personal DTI + credit; lowest rate.
DSCR
20% down · 8.5% · 30yr
- Down + closing
- —
- Monthly P&I
- —
- Monthly cashflow
- —
- DSCR
- —
- Eligible?
- —
No personal income docs; deal must DSCR.
Hard money
10% down · 12.0% · 12mo
- Down + closing
- —
- Monthly P&I
- —
- Monthly cashflow
- —
- DSCR
- —
- Eligible?
- —
Short-term bridge; refi at stabilization.
Rent comps 3 comps
| Address | Beds | Baths | Sqft | Rent | $/sqft | DOM | Units | Dist |
|---|---|---|---|---|---|---|---|---|
| 2315 St Paul St Baltimore, MD | 1.0–2.0 | 1.0 | 579 | $1,595 | $2.75 | 1d | 5 | 1.20mi |
| 414 Water St Baltimore, MD | 1.0–3.0 | 1.0–2.5 | 751 | $3,600 | $4.79 | 2d | 6 | 1.44mi |
| 414 Water St Baltimore, MD | 1.0–3.0 | 1.0–2.5 | 751 | $3,600 | $4.79 | 2d | 7 | 1.44mi |
Listing history 3 events
-
2026-06-18days on market $210,000 Active 3 DOM
-
2026-06-17days on market $210,000 Active 2 DOM
-
2026-06-15$210,000 Active 1 DOM
ⓘ Source: listings_history table (triggers on properties + properties_extension) + one-shot
backfill from property_details.listing_events for pre-trigger history.
Tax reassessment forecast MD · Partial reset (capped growth)
- Current annual tax
- $4,698 · $391/mo
- Projected year-2 tax
- $4,698 · $391/mo
- Expected delta
- $0/yr ($0/mo · 0.0%)
ⓘ Screening estimate from a state-policy table — verify with the county assessor before closing.
Climate risk First Street
- Flood 1/10 Low FEMA zone X (unshaded) · 0% chance over 30 yrs
- Wildfire 1/10 Low
- Heat 7/10 Severe 7 d/yr ≥103°F today · 15 d/yr by 30 yrs out
- Wind 6/10 Major 27% chance of damaging wind over 30 yrs
- Air quality 4/10 Moderate 6 unhealthy d/yr today · 7 by 30 yrs out
Nearby sold comps map
Loading sold comps map…
Walkable amenities ~0.75 mi
Loading nearby amenities…
Taxation est. · year 1
- Rental income
- $30,737
- − Mortgage interest
- −$11,763
- − Property taxes
- −$4,698
- − Insurance
- −$1,050
- − Repairs & maintenance
- −$2,459
- − Management
- −$2,459
- − Depreciation
- −$6,109
- Taxable income
- $2,200
- Est. tax owed @ 24.0%
- −$528
- After-tax cash flow
- $4,792/yr
For passive investors: Depreciation is non-cash, so a rental often shows a tax loss while cash-flowing — sheltering income. Rental losses are passive: they offset passive income freely, and up to $25,000/yr can offset ordinary (W-2) income if you actively participate and your MAGI is under $100k (phasing out to $0 by $150k); unused losses carry forward. On sale, claimed depreciation is recaptured at up to 25%, and gains may owe capital-gains tax (a 1031 exchange can defer both). Figures are a year-1 estimate at your 24.0% rate — not tax advice; consult a CPA.
Schools (NCES district)
- District
- Baltimore City Public Schools
- NCES district ID
- 2400090
- Math proficiency
- 7% ▼ -9.00%
- Reading proficiency
- 16% ▼ -5.00%
- Median HH income
- $42,108
- Composite
- 10.08/100
- National rank
- #9805
- State rank
- #24 of 24 in MD
Livability — Baltimore
- Score
- 76/100
- State rank
- #90
- US rank
- #3396
Category grades
Schools grade is shown separately in the Schools card above.
Census & demographics
- Census place
- Baltimore, MD
- County
- Baltimore City · 558,601 people
- City population
- 588,727
- Metro
- Baltimore-Columbia-Towson, MD
- Population (ZIP)
- 28,058
- Household income
- $51,344
- Rent vs Own
- Severe rent burden
- 1868.0
Population outlook (Baltimore County) Hauer SSP2
- Today (2025)
- 624,249 people
- By 2030
- 621,541 · -0.4%
- By 2040
- 609,756 · -2.3%
- By 2050
- 597,249 · -4.3%
- By 2075
- 552,236 · -11.5%
- By 2100
- 513,934 · -17.7%
Race, ethnicity, and origin ACS 2023
- Neighborhood character
- Predominantly Black (86%)
- Race & ethnicity
- Black 86% White 6% Hispanic / Latino 4% Two or more races 3%
- Foreign-born
- 3% · Canada
- Languages at home
- 96% English-only · Spanish 3%
Political lean MEDSL · Baltimore
- 2024 margin
- Solid D (+73.0) · D 85.2% · R 12.2% · Other 2.6%
- 2008→2024 swing
- -2.5pp toward R · 2008: 75.5pp · 2024: 73.0pp
- All cycles
- 2024: D+73.0 2020: D+76.6 2016: D+74.6 2012: D+76.4 2008: D+75.5
Not yet ingested
- Civics
- —
Market trends
- HPI YoY
- ▼ -0.57%
- Current HPI
- 427.4453
- Rent YoY
- ▲ 5.25%
- Metro
- Baltimore-Columbia-Towson, MD
- State GDP YoY
- ▲ 2.97%
- F500 in state
- 12
Industry mix (Fortune 500 HQ in MD)
| Industry | F500 HQs | Revenue |
|---|---|---|
| Aerospace / Defense | 1 | $71B |
|
||
| Utilities | 1 | $25B |
|
||
| Hotels | 1 | $24B |
|
||
| Consumer Goods | 1 | $7B |
|
||
| Real Estate | 1 | $6B |
|
||
| Chemicals | 1 | $2B |
|
||
Price history
+4100.0% since first listed29 events — show timeline
- 2026-06-15 Listed $210,000 BRIGHT MLS
- 2025-01-03 Rental Removed $1,700 BRIGHTMLS
- 2024-12-19 Sold (Public Records) $142,000 Public Records
- 2024-10-09 Listed for Rent $1,700 BRIGHTMLS
- 2024-09-19 Sold (MLS) $142,000 BRIGHT MLS
- 2024-08-22 Pending — BRIGHT MLS
- 2024-07-12 Price Changed $144,999 BRIGHT MLS
- 2024-05-23 Price Changed $154,999 BRIGHT MLS
- 2024-04-16 Listed $159,999 BRIGHT MLS
- 2024-03-14 Listing Removed — BRIGHT MLS
- 2024-02-10 Price Changed $169,900 BRIGHT MLS
- 2024-01-02 Relisted — BRIGHT MLS
- 2023-12-31 Listing Removed — BRIGHT MLS
- 2023-08-03 Relisted — BRIGHT MLS
- 2023-08-01 Listing Removed — BRIGHT MLS
- 2023-06-27 Price Changed $199,900 BRIGHT MLS
- 2023-06-03 Relisted — BRIGHT MLS
- 2023-05-27 Contingent — BRIGHT MLS
- 2023-02-02 Listed $220,000 BRIGHT MLS
- 2020-10-27 Listing Removed — BRIGHT MLS
- 2020-09-24 Price Changed $150,000 BRIGHT MLS
- 2020-08-07 Relisted — BRIGHT MLS
- 2020-07-28 Listing Removed — BRIGHT MLS
- 2020-07-28 Listed $165,000 BRIGHT MLS
- 2020-01-23 Listing Removed — BRIGHT MLS
- 2019-10-29 Listed $149,900 BRIGHT MLS
- 2014-11-21 Delisted — MRIS
- 2014-11-21 Sold (MLS) $6,000 MRIS
- 2014-08-14 Listed $5,000 MRIS
Property tax history
+18.1%/yrLatest (2025): $4,698 · +1.4% YoY. Source: county tax records.
Cash-flow waterfall
monthlySold comps — $/sqft
last 12 mo · ≤1 miLoading sold comps…