555 NW 4th Ave #4190 · Boca Raton, FL
Flood risk 1/10 · Minimal
- FEMA flood zone
- X (unshaded)
- Chance of flooding over 30 yrs
- 0.0%
- Est. flood insurance / yr
- $507 – $1,088
Fire risk 1/10 · Minimal
- Est. fire insurance / yr
- $947 – $1,759
Heat risk 9/10 · Severe
- Hot days now (above 106°F)
- 7 days/yr
- Hot days in 30 yrs
- 26 days/yr
Wind risk 10/10 · Severe
- Chance of severe wind over 30 yrs
- 99.0%
Air-quality risk 3/10 · Minor
- Unhealthy air days now
- 2 days/yr
- Unhealthy air days in 30 yrs
- 3 days/yr
Risk factors via First Street. Map © Google.
Why this score? — see what drove the B- grade
The composite is a weighted blend of 9 inputs, each scored 0–100. Each bar is that input's sub-score; the figure is the points it added to the 100-point composite (weight × sub-score).
- Cash flow +25.1/30.0
- 1% rule +10.0/10.0
- DSCR +8.2/10.0
- ARV discount +7.5/15.0
- Schools +4.3/10.0
- Livability +3.9/5.0
- Rent growth +3.6/5.0
- Condition / age +2.5/5.0
- Appreciation +0.0/10.0
$169,000
🖨 Deal sheet 📄 Offer letter ✓ Due diligence
Listing remarks
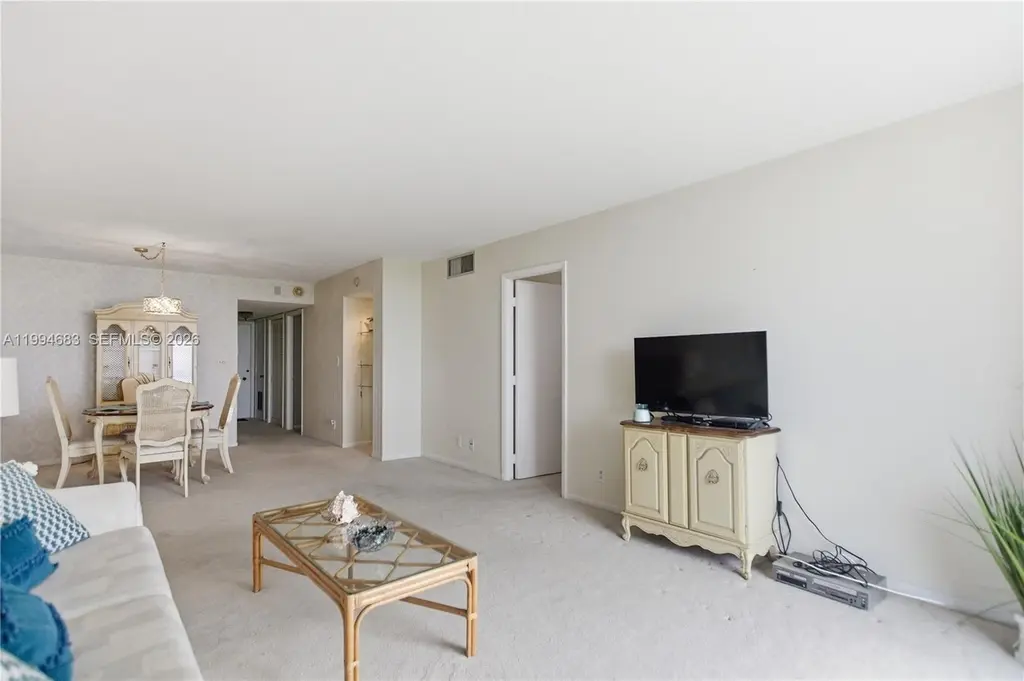
PRICED FOR A QUICK SALE !!! This 2BR/2BA condo features a split floor plan for optimal privacy and a private covered carport. Situated on over 5 acres of breathtaking gardens, this quiet community offers a resort-style feel just steps from the Boca Tennis Center. Unbeatable location: walk to Downtown Boca and Mizner Park’s elite shopping and dining, or head to the beach for a day in the sun. Truly the best of East Boca living! Priced at assesed Value for a quick sale, Great Floor Plan . .. needs some TLC, 55 plus commmunity, emotional support pet ok , no required credit score . Great Investment !!!
Key facts
- $780 HOA
- Garage
- Community pool
Property features AI
Finance
- Financial info: Pets not allowed
- HOA & community: Monthly association fee; Association fee includes management, cable TV, internet, laundry, legal/accounting, grounds maintenance, pool(s), reserve fund, roof, sewer, trash, water; Association amenities include bike storage, clubhouse, community kitchen, elevators, laundry, barbecue, picnic area, pool, trash service, vehicle wash area; 125 units in community; Senior community
Exterior
- Parking: Covered parking; Detached carport; 1-car garage; 1-car carport; One parking space
- Security: Closed-circuit cameras
- Utilities: Cable available
- Home design: Attached property; 5-story building; Entry on level 4
- Construction: Block construction
- Exterior features: Balcony; Open balcony/patio; Storm/security shutters; Heated pool
Interior
- Kitchen: Dishwasher; Electric range; Garbage disposal; Microwave; Refrigerator
- Bedrooms: Bedroom on main level
- Flooring: Carpet; Ceramic tile
- Bathrooms: 2 full bathrooms
- Heating & cooling: Central heating (electric); Central air conditioning; Ceiling fan(s)
- Interior features: Furnished; Elevator; Bedroom on main level
- Laundry & utility: Common area laundry
Neighborhood map
What this means for you Summary
Snapshot
- This is a 2-bed/2.0-bath condo listed at $169k.
Deal economics
- At list price, monthly cash flow is $376 ($5k/yr) — positive.
- The deal already cash-flows at list — no discount required.
- Meets the 1% rule at list price ($3k rent vs $169k).
- Recommended offer: $159k (6.0% below list) — sets the bar for market timing.
- Cap rate 9.0% vs local median 2.8% in Boca Raton — top-decile yield for the area; either an underpriced asset or a hidden risk that comps aren't pricing in. Stress-test before assuming the spread holds.
Location & tenants
- Location reads 77/100 on livability (#192 in FL, #3,070 nationally) — a middle-class / working-renter tenant base. Strengths: schools A+, employment A+, health & safety A+; Watch: amenities D, cost of living F.
- Palm Beach (suburban): math 46% / reading 53% proficiency, ranked #34 of 73 in FL (top 47%) — families likely to look elsewhere, expect single-tenant / working-renter base with shorter leases.
- Market conditions: Rents rising fast (+4.6%/yr); 472 active listings in the ZIP; 40 comparable units currently listed for rent nearby; rentals at typical pace (median 19d on market — plan ~3-4 weeks tenant-placement turnaround); solid renter incomes; 3,974 units permitted in Palm Beach County in 2024 (1,012 in 5+ unit buildings).
- This rent runs 34% of the median local income ($107k/yr) — at the standard rent-burdened threshold; future hikes will face affordability resistance.
Forward outlook
- Local home prices are declining (-3.0%/yr); year-one equity from $1k of loan paydown is wiped out by about $5k of value loss. Plan a longer hold.
- Palm Beach County population projected at +30% by 2050 — long-run rental-demand tailwind backs the buy-and-hold thesis.
- At projected returns (-3.0% appreciation + 4.6% rent growth), your $47k cash investment doubles in ~9 years — after that, you're playing with house money.
Negotiation context
- It's been on market 76 days — a 6% lower offer ($159k) is reasonable based on typical stale-listing flexibility.
- 2 sale attempts with the ask held roughly flat each time — persistent listings suggest the price (not the market) is what's stuck; bring a comps-based counter.
Risks & watch-outs
- Watch-outs: HOA is 26% of rent.
- Climate carrying-cost: severe wind risk, 99% chance of damaging wind over 30y; extreme-heat days projected 7→26/yr by 2055 (HVAC capex compounding) — expect insurance premiums to compound above CPI over the hold.
Questions for the listing agent
- It's been on market 76 days. Have you received any prior offers? Is the seller open to a 6% concession, seller financing, or rate buy-down credit?
- Built in 1969 — when were the roof, HVAC, electrical panel, plumbing, and water heater last replaced?
- What does the HOA fee cover, when was the last increase, and are there any pending special assessments or reserve-fund shortfalls?
- Any open or pending special assessments — roof, HVAC, plumbing, elevator, façade? What's the per-unit balance and payoff schedule, and is the seller paying it off at close or rolling it to the buyer?
- Why hasn't it sold? Are there any deal-killer items the seller is aware of (foundation, flood, title, zoning, code violations)?
- Is there a deadline driving the sale (1031 exchange, divorce, estate, relocation)? That informs how much negotiation room exists.
- Schools are A-rated — typically a magnet for longer-tenancy family renters. What's the average tenant stay here, and is there a school-zone premium baked into asking?
- What's the average days-on-market for RENTAL listings here right now (not sales)? A rising rental-DOM trend means longer vacancies and softer asking-rent achievability than the comps imply.
- What's the recent tenant-quality profile in this submarket — average credit score on applications, eviction rate, late-payment / NSF rate, and stable-employment percentage? A property-management company in the area should have these aggregated.
- How much new apartment / multifamily construction is in the pipeline within 1–3 miles? Heavy new supply (>2% of stock underway) typically softens rents 12–24 months out; light construction supports rent growth.
Investment metrics
- 1% rule
- 1.78% ✓
- Cap rate
- 8.96%
- Cash-on-cash
- 9.53%
- DSCR
- 1.42
- GRM
- 4.7
CMA / ARV
No comps found within radius.
Projected returns pro-forma
-3.0% appreciation · 4.56% rent growth · sell at horizon
- IRR
- 1.0%
- Equity multiple
- 1.04×
- Total profit
- $1,885
- Equity at exit
- $25,198
- IRR
- 13.1%
- Equity multiple
- 2.16×
- Total profit
- $54,967
- Equity at exit
- $14,612
Cash invested: $47,320 (down + closing). Projections, not guarantees.
Landlord ↔ Tenant lean methodology
- Overall (STATE)
- 87 Strongly Landlord-Friendly
- State Florida
- 87 Strongly Landlord-Friendly · R+3
- County
- — inherits STATE
- City
- — inherits STATE
ZIP-level market 33432
- Rents YoY
- 4.6%
- Active inventory
- 472
- Price-to-rent
- 4.7×
Monthly cashflow live
- Estimated rent
- $3,000 high interval (Pro) →
- Mortgage (P&I)
- −$886
- Tax from tax record
- −$258 /mo · $3,091/yr
- Insurance
- −$70
- HOA
- −$780
- Vacancy / Maint / Mgmt
- −$630
- Net cashflow
- $376
Break-even live
UW: 25.0% down · 7.5% · 30yr · 1.5% tax · 5.0% vac · 8.0% maint · 8.0% mgmt
Financing live
Cash to close
- Down payment
- $42,250
- Closing costs
- $5,070
- Reserves months
- —
- Total cash needed
- —
Loan-product check · same deal, 3 products live
Conventional
25% down · 7.5% · 30yr
- Down + closing
- —
- Monthly P&I
- —
- Monthly cashflow
- —
- DSCR
- —
- Eligible?
- —
Personal DTI + credit; lowest rate.
DSCR
20% down · 8.5% · 30yr
- Down + closing
- —
- Monthly P&I
- —
- Monthly cashflow
- —
- DSCR
- —
- Eligible?
- —
No personal income docs; deal must DSCR.
Hard money
10% down · 12.0% · 12mo
- Down + closing
- —
- Monthly P&I
- —
- Monthly cashflow
- —
- DSCR
- —
- Eligible?
- —
Short-term bridge; refi at stabilization.
Rent comps 40 comps
| Address | Beds | Baths | Sqft | Rent | $/sqft | DOM | Units | Dist |
|---|---|---|---|---|---|---|---|---|
| 249 NW 4th Diagonal Boca Raton, FL | 3.0 | 2.0 | 1490 | $3,500 | $2.35 | 24d | 1 | 0.25mi |
| 373 NW 4th Diagonal Boca Raton, FL | 2.0 | 2.0 | 1000 | $2,220 | $2.22 | 24d | 1 | 0.25mi |
| 491 NW 2nd Ave Boca Raton, FL | 2.0 | 1.0 | 1182 | $3,200 | $2.71 | 24d | 1 | 0.31mi |
| 491 NW 2nd Ave Boca Raton, FL | 2.0 | 1.0 | 1182 | $3,200 | $2.71 | 19d | 1 | 0.31mi |
| 320 W Palmetto Park Rd Boca Raton, FL | 3.0 | 1.0–3.0 | 1213 | $3,372 | $2.78 | 2d | 27 | 0.34mi |
| 461 SW 1st St Boca Raton, FL | 3.0 | 2.0 | 1410 | $4,600 | $3.26 | 16d | 1 | 0.36mi |
| 461 SW 1st St Boca Raton, FL | 3.0 | 2.0 | 1489 | $4,600 | $3.09 | 24d | 1 | 0.36mi |
| 50 SW 3rd Ave #2010 Boca Raton, FL | 2.0 | 2.0 | 918 | $1,950 | $2.12 | 22d | 1 | 0.40mi |
| 50 SW 3rd Ave #311 Boca Raton, FL | 2.0 | 2.0 | 918 | $2,500 | $2.72 | 11d | 1 | 0.40mi |
| 50 SW 3rd Ave #1060 Boca Raton, FL | 2.0 | 2.0 | 918 | $2,250 | $2.45 | 24d | 1 | 0.40mi |
| 50 SW 3rd Ave #1060 Boca Raton, FL | 2.0 | 2.0 | 918 | $2,250 | $2.45 | 22d | 1 | 0.40mi |
| 50 SW 3rd Ave #311 Boca Raton, FL | 2.0 | 2.0 | 918 | $2,500 | $2.72 | 24d | 1 | 0.40mi |
| 642 NW 13th St #310 Boca Raton, FL | 3.0 | 2.0 | 1286 | $2,575 | $2.00 | 24d | 1 | 0.43mi |
| 464 NW 11th St Boca Raton, FL | 3.0 | 2.0 | 1205 | $5,500 | $4.56 | 5d | 1 | 0.44mi |
| 464 NW 11th St Boca Raton, FL | 3.0 | 2.0 | 1205 | $5,250 | $4.36 | 22d | 1 | 0.44mi |
| 464 NW 11th St Boca Raton, FL | 3.0 | 2.0 | 1205 | $5,500 | $4.56 | 15d | 1 | 0.44mi |
| 644 NW 13th St #35 Boca Raton, FL | 1.0 | 1.0 | 700 | $1,650 | $2.36 | 10d | 1 | 0.44mi |
| 644 NW 13th St #160 Boca Raton, FL | 2.0 | 2.0 | 847 | $2,300 | $2.72 | 22d | 1 | 0.44mi |
| 644 NW 13th St Unit 28 Boca Raton, FL | 2.0 | 2.0 | 850 | $2,000 | $2.35 | 5d | 1 | 0.44mi |
| 644 NW 13th St #160 Boca Raton, FL | 2.0 | 2.0 | 847 | $2,300 | $2.72 | 14d | 1 | 0.44mi |
| 272 SW 1st St Unit B Boca Raton, FL | 2.0 | 1.0 | 900 | $2,300 | $2.56 | 24d | 1 | 0.45mi |
| 115 NW 7th St Boca Raton, FL | 3.0 | 2.0 | 1008 | $4,250 | $4.22 | 4d | 1 | 0.46mi |
| 626 NW 13th St #310 Boca Raton, FL | 3.0 | 2.0 | 1301 | $2,895 | $2.23 | 24d | 1 | 0.47mi |
| 626 NW 13th St #280 Boca Raton, FL | 2.0 | 2.0 | 847 | $2,200 | $2.60 | 4d | 1 | 0.47mi |
| 230 SW 1st St Boca Raton, FL | 2.0 | 2.0 | 1000 | $2,850 | $2.85 | 15d | 1 | 0.48mi |
| 626 NW 13th St #16 Boca Raton, FL | 2.0 | 2.0 | 847 | $1,950 | $2.30 | 5d | 1 | 0.49mi |
| 602 NW 13th St Unit Oaks 626-31 Boca Raton, FL | 3.0 | 2.0 | 1286 | $2,895 | $2.25 | 5d | 1 | 0.49mi |
| 606 NW 13th St #23 Boca Raton, FL | 3.0 | 2.0 | 1286 | $2,500 | $1.94 | 24d | 1 | 0.52mi |
| 620 NW 13th St #15 Boca Raton, FL | 1.0 | 1.0 | 700 | $1,850 | $2.64 | 8d | 1 | 0.53mi |
| 614 NW 13th St #280 Boca Raton, FL | 2.0 | 2.0 | 847 | $1,900 | $2.24 | 24d | 1 | 0.54mi |
| 610 NW 13th St #0023 Boca Raton, FL | 3.0 | 2.0 | 1286 | $2,750 | $2.14 | 24d | 1 | 0.56mi |
| 610 NW 13th St #210 Boca Raton, FL | 2.0 | 2.0 | 847 | $2,350 | $2.77 | 8d | 1 | 0.56mi |
| 616 NW 13th St #250 Boca Raton, FL | 1.0 | 1.0 | 700 | $1,700 | $2.43 | 24d | 1 | 0.57mi |
| 616 NW 13th St #24 Boca Raton, FL | 1.0 | 1.0 | 700 | $1,750 | $2.50 | 24d | 1 | 0.57mi |
| 131 S Federal Hwy Boca Raton, FL | 1.0–2.0 | 1.0–2.0 | 778 | $3,149 | $4.05 | 2d | 12 | 0.62mi |
| 683 NW 13th St Apt 27 Boca Raton, FL | 2.0 | 2.0 | 995 | $2,140 | $2.15 | 24d | 1 | 0.63mi |
| 1314 NW 2nd Cir Boca Raton, FL | 3.0 | 2.0 | 1382 | $3,500 | $2.53 | 17d | 1 | 0.66mi |
| 401 NE Mizner Blvd Boca Raton, FL | 1.0–3.0 | 1.0–2.5 | 1109 | $3,414 | $3.08 | 2d | 25 | 0.67mi |
| 155 E Boca Raton Rd Boca Raton, FL | 1.0–3.0 | 1.0–2.5 | 1411 | $10,250 | $7.26 | 14d | 9 | 0.67mi |
| 155 E Boca Raton Rd Boca Raton, FL | 1.0–3.0 | 1.0–2.5 | 1411 | $9,745 | $6.90 | 2d | 8 | 0.67mi |
HOA detail condo
- Monthly dues
- $780 · $9,360/yr
- Assessments
- None detected in remarks — confirm with the listing agent.
Listing history 16 events
-
2026-06-18days on market $169,000 Active 76 DOM
-
2026-06-17days on market $169,000 Active 75 DOM
-
2026-06-16days on market $169,000 Active 74 DOM
-
2026-06-15days on market $169,000 Active 73 DOM
-
2026-06-13days on market $169,000 Active 71 DOM
-
2026-06-09days on market $169,000 Active 67 DOM
-
2026-06-08days on market $169,000 Active 66 DOM
-
2026-06-07days on market $169,000 Active 65 DOM
-
2026-06-04days on market $169,000 Active 62 DOM
-
2026-06-03days on market $169,000 Active 61 DOM
-
2026-06-02days on market $169,000 Active 60 DOM
-
2026-06-01days on market $169,000 Active 59 DOM
-
2026-05-31days on market $169,000 Active 58 DOM
-
2026-04-02$169,000 Active
-
2026-03-25historical
-
2025-04-07$175,000 Active
ⓘ Source: listings_history table (triggers on properties + properties_extension) + one-shot
backfill from property_details.listing_events for pre-trigger history.
Tax reassessment forecast FL · Resets to sale price
- Current annual tax
- $3,091 · $258/mo
- Projected year-2 tax
- $3,091 · $258/mo
- Expected delta
- $0/yr ($0/mo · 0.0%)
ⓘ Screening estimate from a state-policy table — verify with the county assessor before closing.
Climate risk First Street
- Flood 1/10 Low FEMA zone X (unshaded) · 0% chance over 30 yrs
- Wildfire 1/10 Low
- Heat 9/10 Extreme 7 d/yr ≥106°F today · 26 d/yr by 30 yrs out
- Wind 10/10 Extreme 99% chance of damaging wind over 30 yrs
- Air quality 3/10 Moderate 2 unhealthy d/yr today · 3 by 30 yrs out
Nearby sold comps map
Loading sold comps map…
Walkable amenities ~0.75 mi
Loading nearby amenities…
Taxation est. · year 1
- Rental income
- $36,002
- − Mortgage interest
- −$9,467
- − Property taxes
- −$3,091
- − Insurance
- −$845
- − Repairs & maintenance
- −$2,880
- − Management
- −$2,880
- − HOA
- −$9,360
- − Depreciation
- −$4,916
- Taxable income
- $2,562
- Est. tax owed @ 24.0%
- −$615
- After-tax cash flow
- $3,895/yr
For passive investors: Depreciation is non-cash, so a rental often shows a tax loss while cash-flowing — sheltering income. Rental losses are passive: they offset passive income freely, and up to $25,000/yr can offset ordinary (W-2) income if you actively participate and your MAGI is under $100k (phasing out to $0 by $150k); unused losses carry forward. On sale, claimed depreciation is recaptured at up to 25%, and gains may owe capital-gains tax (a 1031 exchange can defer both). Figures are a year-1 estimate at your 24.0% rate — not tax advice; consult a CPA.
Schools (NCES district)
- District
- Palm Beach
- NCES district ID
- 1201500
- Math proficiency
- 46% ▼ -16.00%
- Reading proficiency
- 53% ▼ -4.00%
- Median HH income
- $53,943
- Composite
- 42.72/100
- National rank
- #3160
- State rank
- #34 of 73 in FL
Livability — Boca Raton
- Score
- 77/100
- State rank
- #192
- US rank
- #3070
Category grades
Schools grade is shown separately in the Schools card above.
Census & demographics
- Census place
- Boca Raton, FL
- County
- Palm Beach County · 1,438,312 people
- City population
- 250,102
- Metro
- Miami-Fort Lauderdale-Pompano Beach, FL
- Population (ZIP)
- 21,834
- Household income
- $107,045
- Rent vs Own
- Severe rent burden
- 1461.0
Population outlook (Palm Beach County) Hauer SSP2
- Today (2025)
- 1,637,487 people
- By 2030
- 1,743,255 · +6.5%
- By 2040
- 1,948,712 · +19.0%
- By 2050
- 2,132,979 · +30.3%
- By 2075
- 2,530,027 · +54.5%
- By 2100
- 2,706,979 · +65.3%
Race, ethnicity, and origin ACS 2023
- Neighborhood character
- Predominantly White (72%)
- Race & ethnicity
- White 72% Hispanic / Latino 18% Two or more races 13% Black 4% Asian 2%
- Hispanic origin (detail)
- Mexican 3% Puerto Rican 5% Cuban 3%
- Common ancestry
- Scotch-Irish 4% Subsaharan African 4% Romanian 4%
- Foreign-born
- 20% · Canada, Jamaica, China
- Languages at home
- 77% English-only · Spanish 13% Other Indo-European 3% French/Haitian/Cajun 2%
Political lean MEDSL · Palm Beach
- 2024 margin
- Toss-up / Even · D 50.0% · R 49.2%
- 2008→2024 swing
- -22.1pp toward R · 2008: 22.9pp · 2024: 0.8pp
- All cycles
- 2024: D+0.8 2020: D+12.8 2016: D+15.3 2012: D+17.0 2008: D+22.9
Not yet ingested
- Civics
- —
Market trends
- HPI YoY
- ▼ -565.03%
- Current HPI
- 391.7799
- Rent YoY
- ▲ 4.56%
- Metro
- Miami-Fort Lauderdale-Pompano Beach, FL
- State GDP YoY
- ▲ 3.28%
- F500 in state
- 36
Industry mix (Fortune 500 HQ in FL)
| Industry | F500 HQs | Revenue |
|---|---|---|
| Industrial Technology | 2 | $29B |
|
||
| Insurance | 2 | $17B |
|
||
| Retail | 1 | $60B |
|
||
| Technology Distribution | 1 | $58B |
|
||
| Homebuilding | 1 | $35B |
|
||
| Technology Manufacturing | 1 | $35B |
|
||
Price history
-3.4% since first listed3 events — show timeline
- 2026-04-02 Listed $169,000 MARMLS
- 2026-03-25 Listing Removed — Beaches MLS
- 2025-04-07 Listed $175,000 Beaches MLS
Property tax history
+2.9%/yrLatest (2025): $3,091 · +2.9% YoY. Source: county tax records.
Cash-flow waterfall
monthlySold comps — $/sqft
last 12 mo · ≤1 miLoading sold comps…