20460 Pacific Coast · Malibu, CA
Flood risk 1/10 · Minimal
- FEMA flood zone
- X (unshaded)
- Chance of flooding over 30 yrs
- 0.0%
- Est. flood insurance / yr
- $507 – $1,088
Fire risk 4/10 · Minor
- Est. fire insurance / yr
- $659 – $1,223
Heat risk 6/10 · Moderate
- Hot days now (above 82°F)
- 7 days/yr
- Hot days in 30 yrs
- 20 days/yr
Wind risk 1/10 · Minimal
- Chance of severe wind over 30 yrs
- —
Air-quality risk 4/10 · Minor
- Unhealthy air days now
- 6 days/yr
- Unhealthy air days in 30 yrs
- 6 days/yr
Risk factors via First Street. Map © Google.
Why this score? — see what drove the B+ grade
The composite is a weighted blend of 9 inputs, each scored 0–100. Each bar is that input's sub-score; the figure is the points it added to the 100-point composite (weight × sub-score).
- Cash flow +30.0/30.0
- 1% rule +10.0/10.0
- DSCR +10.0/10.0
- ARV discount +7.5/15.0
- Schools +6.2/10.0
- Appreciation +5.3/10.0
- Livability +2.7/5.0
- Condition / age +2.5/5.0
- Rent growth +1.7/5.0
$674,000
🖨 Deal sheet (PDF) 📄 Offer letter ✓ Due diligence
Listing remarks MLS
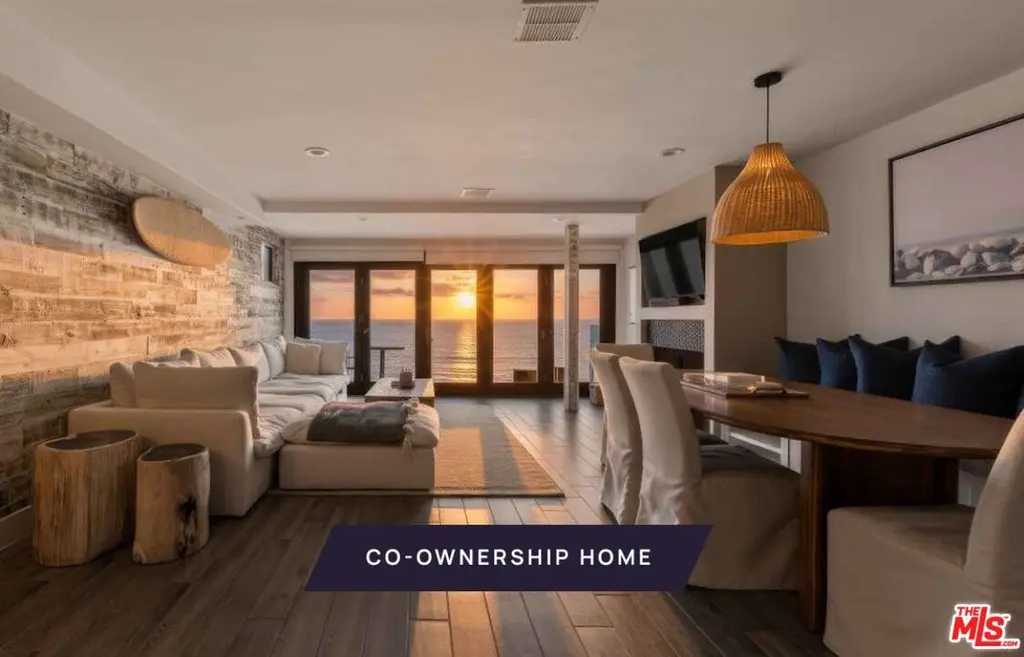
New Co-Ownership Opportunity: Own one-eighth of this turnkey home, professionally managed by Pacaso. The Pacific is front and center in this contemporary oceanfront home that maximizes the views and beach lifestyle. The living space features a dining area with banquette seating, a brick fireplace and bi-fold French doors that open to a cozy covered deck. The kitchen has stainless steel appliances, a double-drawer dishwasher and access to the 2-car garage. Skylights bring warm shafts of light throughout the second floor. The zen-like primary bedroom features bi-fold doors to a private balcony overlooking the ocean, a modern fireplace and an en suite bathroom with soaking tub, dual-sink vanity and a marble tiled shower. Another bedroom and a bunk room ensure there's plenty of room for guests. Below the main floor, the nearly 1,000-square-foot foot deck has been transformed into an entertainment haven, featuring a tiki bar, dining table, chair swings and a motorized, waterproof door. The home comes fully furnished and professionally decorated.
Key facts
- Private balcony
- Entertainment haven
- Oceanfront home
Tags
Neighborhood map
What this means for you Summary
Snapshot
- This is a 3-bed/3.0-bath condo listed at $674k.
Deal economics
- At list price, monthly cash flow is $4k ($54k/yr) — positive.
- The deal already cash-flows at list — no discount required.
- Meets the 1% rule at list price ($12k rent vs $674k).
- Recommended offer: $593k (12.0% below list) — sets the bar for market timing.
- Cap rate 14.3% vs local median 0.7% in Malibu — top-decile yield for the area; either an underpriced asset or a hidden risk that comps aren't pricing in. Stress-test before assuming the spread holds.
Location & tenants
- Location reads 53/100 on livability (#979 in CA) — a working-class tenant base; expect higher turnover. Strengths: employment A+; Watch: housing C-, crime F, amenities F.
- Santa Monica-Malibu Unified (urban): math 61% / reading 74% proficiency, ranked #123 of 1,400 in CA (top 9%) — acceptable for families but not a draw, mixed tenant base, ~2y average lease.
- Zoned schools: Webster Elementary (214 students, 10% FRL).
- Market conditions: Rents falling (-3.4%/yr); 636 active listings in the ZIP; 6 comparable units currently listed for rent nearby; rentals lingering (median 46d on market — plan ~5-8 weeks vacancy on turnover, expect pricing pressure); 67% of comp listings sitting > 30 days — soft ceiling on asking rent; high-income renter base; 19,697 units permitted in Los Angeles County in 2024 (9,426 in 5+ unit buildings).
- At $11,580/mo this rent would consume 71% of the median local household income ($197k/yr) (locally 420% of renters already pay >50% of income on rent) — very limited rent-growth headroom before tenants either downsize or default.
Forward outlook
- In year one you build about $9k of equity ($5k loan paydown + $4k appreciation (0.6% local appreciation)).
- Los Angeles County population projected at +9% by 2050 — modest demand growth; plan on rents tracking national, not racing it.
- At projected returns (0.6% appreciation + 0.0% rent growth), your $189k cash investment doubles in ~4 years — after that, you're playing with house money.
- By year 5, paydown + projected appreciation supports a ~$43k cash-out refi (75% LTV) — recoverable capital for the next deal without selling this one.
Negotiation context
- It's been on market 240 days — a 12% lower offer ($593k) is reasonable based on typical stale-listing flexibility.
- 25 sale attempts since 27y ago with the ask held roughly flat each time — persistent listings suggest the price (not the market) is what's stuck; bring a comps-based counter.
Risks & watch-outs
- Climate carrying-cost: extreme-heat days projected 7→20/yr by 2055 (HVAC capex compounding) — expect insurance premiums to compound above CPI over the hold.
Questions for the listing agent
- It's been on market 240 days. Have you received any prior offers? Is the seller open to a 12% concession, seller financing, or rate buy-down credit?
- Built in 1963 — when were the roof, HVAC, electrical panel, plumbing, and water heater last replaced?
- Any open or pending special assessments — roof, HVAC, plumbing, elevator, façade? What's the per-unit balance and payoff schedule, and is the seller paying it off at close or rolling it to the buyer?
- Why hasn't it sold? Are there any deal-killer items the seller is aware of (foundation, flood, title, zoning, code violations)?
- Is there a deadline driving the sale (1031 exchange, divorce, estate, relocation)? That informs how much negotiation room exists.
- Schools are B-rated — typically a magnet for longer-tenancy family renters. What's the average tenant stay here, and is there a school-zone premium baked into asking?
- Crime grade is F in this area — have there been break-ins, vandalism, or insurance claims at this property in the last 3 years? What carrier currently insures it and at what premium?
- What's the average days-on-market for RENTAL listings here right now (not sales)? A rising rental-DOM trend means longer vacancies and softer asking-rent achievability than the comps imply.
- What's the recent tenant-quality profile in this submarket — average credit score on applications, eviction rate, late-payment / NSF rate, and stable-employment percentage? A property-management company in the area should have these aggregated.
- How much new apartment / multifamily construction is in the pipeline within 1–3 miles? Heavy new supply (>2% of stock underway) typically softens rents 12–24 months out; light construction supports rent growth.
Investment metrics
- 1% rule
- 1.72% ✓
- Cap rate
- 14.29%
- Cash-on-cash
- 28.55%
- DSCR
- 2.27
- GRM
- 4.9
CMA / ARV
- ARV (median comp)
- $4,140,427
- List price
- $674,000
- Delta
- -83.72%
- Verdict
- UNDERPRICED
- Comps
- 20 within 1.0 mi
Projected returns pro-forma
0.62% appreciation · 0.0% rent growth · sell at horizon
- IRR
- 27.4%
- Equity multiple
- 2.34×
- Total profit
- $252,349
- Equity at exit
- $216,791
- IRR
- 28.7%
- Equity multiple
- 4.02×
- Total profit
- $569,001
- Equity at exit
- $278,075
Cash invested: $188,720 (down + closing). Projections, not guarantees.
Landlord ↔ Tenant lean methodology
- Overall (STATE)
- 18 Strongly Tenant-Friendly
- State California
- 18 Strongly Tenant-Friendly · D+13
- County
- — inherits STATE
- City
- — inherits STATE
ZIP-level market 90265
- Home prices YoY
- 0.1%
- Rents YoY
- -3.4%
- Active inventory
- 636
- Price-to-rent
- 4.9×
Monthly cashflow live
- Estimated rent
- $11,580 medium interval (Pro) →
- Mortgage (P&I)
- −$3,535
- Tax est. 1.5%
- −$842 /mo · $10,110/yr
- Insurance
- −$281
- HOA
- −$0
- Vacancy / Maint / Mgmt
- −$2,432
- Net cashflow
- $4,491
Break-even live
Sensitivity live
| Price | -10% $4,956 | -5% $4,724 | +0% $4,491 | +5% $4,258 | +10% $4,025 |
|---|---|---|---|---|---|
| Rent | -10% $3,576 | -5% $4,033 | +0% $4,491 | +5% $4,948 | +10% $5,405 |
| Rate | -1.0pp $4,830 | -0.5pp $4,662 | base $4,491 | +0.5pp $4,316 | +1.0pp $4,138 |
UW: 25.0% down · 7.5% · 30yr · 1.5% tax · 5.0% vac · 8.0% maint · 8.0% mgmt
Financing live
Cash to close
- Down payment
- $168,500
- Closing costs
- $20,220
- Reserves months
- —
- Total cash needed
- —
Loan-product check · same deal, 3 products live
Conventional
25% down · 7.5% · 30yr
- Down + closing
- —
- Monthly P&I
- —
- Monthly cashflow
- —
- DSCR
- —
- Eligible?
- —
Personal DTI + credit; lowest rate.
DSCR
20% down · 8.5% · 30yr
- Down + closing
- —
- Monthly P&I
- —
- Monthly cashflow
- —
- DSCR
- —
- Eligible?
- —
No personal income docs; deal must DSCR.
Hard money
10% down · 12.0% · 12mo
- Down + closing
- —
- Monthly P&I
- —
- Monthly cashflow
- —
- DSCR
- —
- Eligible?
- —
Short-term bridge; refi at stabilization.
Rent comps 6 comps
| Address | Beds | Baths | Sqft | Rent | $/sqft | DOM | Units | Dist |
|---|---|---|---|---|---|---|---|---|
| 20448 Pacific Coast Hwy Malibu, CA | 3.0 | 3.0 | 1647 | $22,500 | $13.66 | 5d | 1 | 0.04mi |
| 20647 Seaboard Rd Malibu, CA | 3.0 | 2.0 | 2092 | $27,000 | $12.91 | 45d | 1 | 0.21mi |
| 20645 Seaboard Rd Malibu, CA | 3.0 | 2.0 | 1564 | $12,500 | $7.99 | 6d | 1 | 0.25mi |
| 20537 Little Rock Way Unit A Malibu, CA | 4.0 | 2.0 | 1892 | $11,000 | $5.81 | 45d | 1 | 0.30mi |
| 3966 Las Flores Canyon Rd Malibu, CA | 3.0 | 2.0 | 1450 | $10,995 | $7.58 | 45d | 1 | 0.86mi |
| 3908 Las Flores Canyon Rd Malibu, CA | 3.0 | 2.0 | 1250 | $9,995 | $8.00 | 45d | 1 | 0.92mi |
HOA detail condo
- Monthly dues
- $0 · $0/yr
- Likely covers
- water
- Assessments
- None detected in remarks — confirm with the listing agent.
Listing history 50 events
-
2026-06-21days on market $674,000 Active 240 DOM
-
2026-06-18days on market $674,000 Active 237 DOM
-
2026-06-17days on market $674,000 Active 236 DOM
-
2026-06-16days on market $674,000 Active 235 DOM
-
2026-06-15days on market $674,000 Active 234 DOM
-
2026-06-13days on market $674,000 Active 232 DOM
-
2026-06-13days on market $674,000 Active 231 DOM
-
2026-06-09days on market $674,000 Active 228 DOM
-
2026-06-08days on market $674,000 Active 227 DOM
-
2026-06-07days on market $674,000 Active 226 DOM
-
2026-06-04days on market $674,000 Active 223 DOM
-
2026-06-03days on market $674,000 Active 222 DOM
-
2026-06-02days on market $674,000 Active 221 DOM
-
2026-06-01days on market $674,000 Active 220 DOM
-
2026-05-31days on market $674,000 Active 219 DOM
-
2025-10-24$674,000 Active 1056-char remark
Show marketing remark (1056 chars)
New Co-Ownership Opportunity: Own one-eighth of this turnkey home, professionally managed by Pacaso. The Pacific is front and center in this contemporary oceanfront home that maximizes the views and beach lifestyle. The living space features a dining area with banquette seating, a brick fireplace and bi-fold French doors that open to a cozy covered deck. The kitchen has stainless steel appliances, a double-drawer dishwasher and access to the 2-car garage. Skylights bring warm shafts of light throughout the second floor. The zen-like primary bedroom features bi-fold doors to a private balcony overlooking the ocean, a modern fireplace and an en suite bathroom with soaking tub, dual-sink vanity and a marble tiled shower. Another bedroom and a bunk room ensure there's plenty of room for guests. Below the main floor, the nearly 1,000-square-foot foot deck has been transformed into an entertainment haven, featuring a tiki bar, dining table, chair swings and a motorized, waterproof door. The home comes fully furnished and professionally decorated.
-
2025-07-07Active
-
2024-05-06price
-
2024-04-05Active
-
2024-03-14status Pending
-
2024-03-08price
-
2023-08-17status Active
-
2023-05-16Active
-
2023-03-30price
-
2023-03-27price
-
2023-02-15Active
-
2022-03-23soldstatus $4,350,000 Closed Sale
-
2022-03-23soldstatus $4,350,000
-
2022-03-09status Pending Sale
-
2022-03-03historical $4,500,000
-
2021-04-19historical
-
2018-08-09historical Cancelled
-
2018-05-26status Active
-
2018-04-30status Backup Offers Accepted
-
2018-02-07price
-
2018-01-24Active
-
2017-12-14historical Cancelled
-
2017-09-26price
-
2017-09-02price
-
2017-08-07Active
-
2015-09-30soldstatus $2,305,000 Closed
-
2015-09-30soldstatus $2,285,500
-
2015-09-14status Pending
-
2015-07-24status Backup Offers Accepted
-
2015-07-17historical Hold
-
2015-06-26$2,289,500 Active
-
2009-03-16historical
-
2009-03-12soldstatus $1,600,000 Closed
-
2009-03-11soldstatus $1,600,000
-
2009-02-10status
ⓘ Source: listings_history table (triggers on properties + properties_extension) + one-shot
backfill from property_details.listing_events for pre-trigger history.
Climate risk First Street
- Flood 1/10 Low FEMA zone X (unshaded) · 0% chance over 30 yrs
- Wildfire 4/10 Moderate
- Heat 6/10 Major 7 d/yr ≥82°F today · 20 d/yr by 30 yrs out
- Wind 1/10 Low
- Air quality 4/10 Moderate 6 unhealthy d/yr today · 6 by 30 yrs out
Nearby sold comps map
Loading sold comps map…
Walkable amenities ~0.75 mi
Loading nearby amenities…
Taxation est. · year 1
- Rental income
- $138,965
- − Mortgage interest
- −$37,754
- − Property taxes
- −$10,110
- − Insurance
- −$3,370
- − Repairs & maintenance
- −$11,117
- − Management
- −$11,117
- − Depreciation
- −$19,607
- Taxable income
- $45,888
- Est. tax owed @ 24.0%
- −$11,013
- After-tax cash flow
- $42,874/yr
For passive investors: Depreciation is non-cash, so a rental often shows a tax loss while cash-flowing — sheltering income. Rental losses are passive: they offset passive income freely, and up to $25,000/yr can offset ordinary (W-2) income if you actively participate and your MAGI is under $100k (phasing out to $0 by $150k); unused losses carry forward. On sale, claimed depreciation is recaptured at up to 25%, and gains may owe capital-gains tax (a 1031 exchange can defer both). Figures are a year-1 estimate at your 24.0% rate — not tax advice; consult a CPA.
Schools (NCES district)
- District
- Santa Monica-Malibu Unified
- NCES district ID
- 0635700
- Math proficiency
- 61% ▬ 0.00%
- Reading proficiency
- 74% ▬ 0.00%
- Median HH income
- $81,489
- Composite
- 61.58/100
- National rank
- #1535
- State rank
- #123 of 1400 in CA
Livability — Malibu
- Score
- 53/100
- State rank
- #979
- US rank
- #24630
Category grades
Schools grade is shown separately in the Schools card above.
Census & demographics
- Census place
- Malibu, CA
- County
- Los Angeles County · 9,444,647 people
- City population
- 15,918
- Metro
- Los Angeles-Long Beach-Anaheim, CA
- Population (ZIP)
- 15,918
- Household income
- $196,742
- Rent vs Own
- Severe rent burden
- 420.0
Population outlook (Los Angeles County) Hauer SSP2
- Today (2025)
- 10,940,515 people
- By 2030
- 11,256,481 · +2.9%
- By 2040
- 11,729,929 · +7.2%
- By 2050
- 11,948,407 · +9.2%
- By 2075
- 11,818,114 · +8.0%
- By 2100
- 10,842,928 · -0.9%
Race, ethnicity, and origin ACS 2023
- Neighborhood character
- Predominantly White (77%)
- Race & ethnicity
- White 77% Two or more races 10% Hispanic / Latino 9% Asian 5% Black 1%
- Hispanic origin (detail)
- Mexican 6%
- Common ancestry
- Italian 8% Scotch-Irish 3% Romanian 3%
- Foreign-born
- 16% · Canada, South Korea, China
- Languages at home
- 82% English-only · Spanish 6% Other Indo-European 6% French/Haitian/Cajun 2%
Political lean MEDSL · Los Angeles
- 2024 margin
- Solid D (+32.9) · D 64.8% · R 31.9% · Other 3.3%
- 2008→2024 swing
- -7.4pp toward R · 2008: 40.4pp · 2024: 32.9pp
- All cycles
- 2024: D+32.9 2020: D+44.2 2016: D+48.0 2012: D+40.0 2008: D+40.4
Not yet ingested
- Civics
- —
Market trends
- HPI YoY
- ▲ 0.62%
- Current HPI
- 498.5117
- Rent YoY
- ▼ -3.39%
- Metro
- Los Angeles-Long Beach-Anaheim, CA
- State GDP YoY
- ▲ 3.21%
- F500 in state
- 116
Industry mix (Fortune 500 HQ in CA)
| Industry | F500 HQs | Revenue |
|---|---|---|
| Technology | 27 | $1,492B |
|
||
| Financial Services | 3 | $174B |
|
||
| Retail | 3 | $44B |
|
||
| Insurance | 3 | $26B |
|
||
| Media / Entertainment | 2 | $115B |
|
||
| Pharmaceuticals / Biotech | 2 | $62B |
|
||
Price history
+399.3% since first listed80 events — show timeline
- 2025-10-24 Listed $674,000 TheMLS
- 2025-07-07 Listed — TheMLS
- 2024-05-06 Price Changed — TheMLS
- 2024-04-05 Listed — TheMLS
- 2024-03-14 Pending — TheMLS
- 2024-03-08 Price Changed — TheMLS
- 2023-08-17 Relisted — TheMLS
- 2023-05-16 Listed — TheMLS
- 2023-03-30 Price Changed — TheMLS
- 2023-03-27 Price Changed — TheMLS
- 2023-02-15 Listed — TheMLS
- 2022-03-23 Sold (Public Records) $4,350,000 Public Records
- 2022-03-23 Sold (MLS) $4,350,000 CRMLS
- 2022-03-09 Pending — CRMLS
- 2022-03-03 Coming Soon $4,500,000 CRMLS
- 2021-04-19 Listing Removed — CSMAR
- 2018-08-09 Delisted — TheMLS
- 2018-05-26 Relisted — TheMLS
- 2018-04-30 Pending — TheMLS
- 2018-02-07 Price Changed — TheMLS
- 2018-01-24 Listed — TheMLS
- 2017-12-14 Delisted — TheMLS
- 2017-09-26 Price Changed — TheMLS
- 2017-09-02 Price Changed — TheMLS
- 2017-08-07 Listed — TheMLS
- 2015-09-30 Sold (Public Records) $2,285,500 Public Records
- 2015-09-30 Sold (MLS) $2,305,000 TheMLS
- 2015-09-14 Pending — TheMLS
- 2015-07-24 Pending — TheMLS
- 2015-07-17 Delisted — TheMLS
- 2015-06-26 Listed $2,289,500 TheMLS
- 2009-03-16 Delisted — TheMLS
- 2009-03-12 Sold (MLS) $1,600,000 TheMLS
- 2009-03-11 Sold (Public Records) $1,600,000 Public Records
- 2009-02-10 Relisted — TheMLS
- 2009-02-09 Delisted — TheMLS
- 2008-11-14 Price Changed $1,950,000 TheMLS
- 2008-10-24 Relisted — TheMLS
- 2008-10-22 Delisted — TheMLS
- 2008-10-16 Relisted — TheMLS
- 2008-10-15 Delisted — TheMLS
- 2008-10-10 Relisted — TheMLS
- 2008-10-09 Delisted — TheMLS
- 2008-10-06 Relisted — TheMLS
- 2008-10-05 Delisted — TheMLS
- 2008-10-03 Relisted — TheMLS
- 2008-10-02 Delisted — TheMLS
- 2008-09-23 Price Changed $2,050,000 TheMLS
- 2008-06-22 Price Changed $2,100,000 TheMLS
- 2008-06-03 Relisted — TheMLS
- 2008-06-02 Delisted — TheMLS
- 2008-03-22 Price Changed $2,250,000 TheMLS
- 2008-02-08 Listed $2,350,000 TheMLS
- 2007-12-01 Delisted — TheMLS
- 2007-10-29 Price Changed — TheMLS
- 2007-10-05 Price Changed — TheMLS
- 2007-09-17 Price Changed — TheMLS
- 2007-07-31 Price Changed — TheMLS
- 2007-06-03 Listed — TheMLS
- 2006-08-31 Delisted — CRMLS
- 2006-06-28 Sold (Public Records) $2,470,000 Public Records
- 2006-06-27 Sold (Public Records) $2,470,000 Public Records
- 2006-06-27 Sold (MLS) $2,470,000 TheMLS
- 2006-05-24 Delisted — TheMLS
- 2006-04-03 Listed $2,495,000 TheMLS
- 2006-03-06 Listed — CRMLS
- 2006-03-06 Listed $2,495,000 CSMAR
- 2005-10-21 Delisted — TheMLS
- 2005-10-20 Listed — TheMLS
- 2003-09-15 Sold (Public Records) $1,150,000 Public Records
- 2003-09-15 Sold (MLS) $1,150,000 TheMLS
- 2003-07-11 Delisted — TheMLS
- 2002-11-25 Listed $1,200,000 TheMLS
- 2000-02-04 Sold (MLS) $590,000 TheMLS
- 2000-01-21 Sold (Public Records) $590,000 Public Records
- 1999-12-02 Delisted — TheMLS
- 1999-09-27 Listed $649,000 TheMLS
- 1998-03-18 Sold (Public Records) $200,000 Public Records
- 1998-03-18 Sold (Public Records) $135,000 Public Records
- 1996-06-27 Sold (Public Records) $500 Public Records
Property tax history
+3.3%/yrLatest (2025): $51,181 · -4.5% YoY. Source: county tax records.
Cash-flow waterfall
monthlySold comps — $/sqft
last 12 mo · ≤1 miLoading sold comps…