1636 N Oak Grove Ave · Springfield, MO
Flood risk 1/10 · Minimal
- FEMA flood zone
- X (unshaded)
- Chance of flooding over 30 yrs
- 0.0%
- Est. flood insurance / yr
- $507 – $1,088
Fire risk 1/10 · Minimal
- Est. fire insurance / yr
- $1,054 – $1,958
Heat risk 5/10 · Moderate
- Hot days now (above 104°F)
- 7 days/yr
- Hot days in 30 yrs
- 19 days/yr
Wind risk 2/10 · Minimal
- Chance of severe wind over 30 yrs
- 0.0%
Air-quality risk 2/10 · Minimal
- Unhealthy air days now
- 2 days/yr
- Unhealthy air days in 30 yrs
- 2 days/yr
Risk factors via First Street. Map © Google.
Why this score? — see what drove the D grade
The composite is a weighted blend of 9 inputs, each scored 0–100. Each bar is that input's sub-score; the figure is the points it added to the 100-point composite (weight × sub-score).
- Cash flow +12.5/30.0
- ARV discount +8.4/15.0
- Livability +3.8/5.0
- DSCR +3.7/10.0
- Rent growth +3.6/5.0
- Schools +3.2/10.0
- 1% rule +2.7/10.0
- Condition / age +2.5/5.0
- Appreciation +0.0/10.0
$149,500
🖨 Deal sheet 📄 Offer letter ✓ Due diligence
Listing remarks
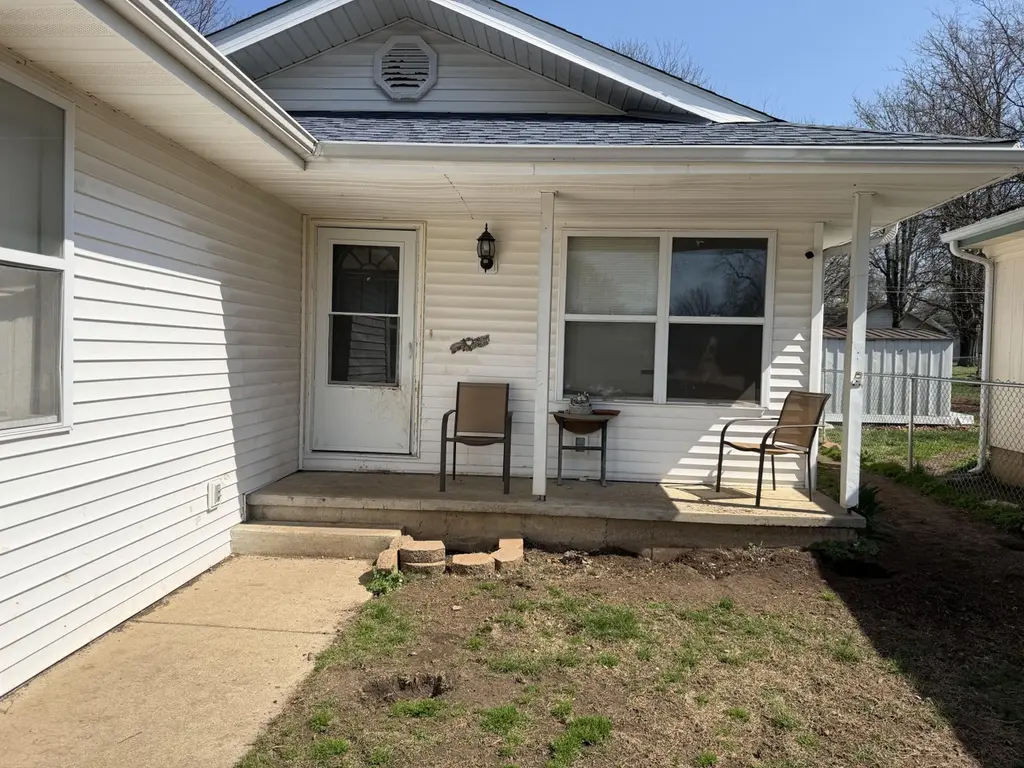
Welcome to 1636 N Oak Grove Ave--an opportunity-filled property with great potential and a standout shop setup. This 3-bedroom, 2-bath home with a 2-car garage offers a functional layout and sits on a lot with a chain-link fenced yard, providing space for pets or outdoor use. Built in 1996, the home has been maintained over the years and could benefit from some cosmetic updates and TLC, making it a great option for buyers looking to add their own personal touch. The true highlight of this property is the impressive detached shop--fully equipped with electricity, heat, plumbing, and a half bath. This space is perfect for automotive work, hobbies, or a small business setup. With just a little
Key facts
- Half bath
- Detached shop
- Car lift
Tags
Neighborhood map
What this means for you Summary
Snapshot
- This is a 3-bed/2.0-bath single-family listed at $150k.
Deal economics
- At list price, monthly cash flow is $-22 ($-263/yr) — negative.
- To cash-flow at today's rent, offer at most $146k (2.6% below list).
- To meet the 1% rule (rent ≥ 1% of price), the offer needs to be $115k (22.8% below list).
- Recommended offer: $115k (22.8% below list) — sets the bar for 1% rule.
- Cap rate 6.1% vs local median 4.6% in Springfield — top-decile yield for the area; either an underpriced asset or a hidden risk that comps aren't pricing in. Stress-test before assuming the spread holds.
Location & tenants
- Location reads 75/100 on livability (#57 in MO, #4,121 nationally) — a middle-class / working-renter tenant base. Strengths: commute A+, cost of living A+, housing A+; Watch: crime F, employment F.
- Springfield R-XII (urban): math 32% / reading 46% proficiency, ranked #174 of 324 in MO (top 54%) — families likely to look elsewhere, expect single-tenant / working-renter base with shorter leases.
- Zoned schools: Weller Elem. (math 17% / reading 32%, grade F, #879 of 1,115 statewide, top 81%, 297 students, 83% FRL); Central High (math 42% / reading 62%, grade D+, #92 of 521 statewide, top 20%, 1,464 students, 51% FRL) — zoned schools average 67% FRL vs 46% district-wide (21 pts higher); higher-poverty schools than district average — tighter screening recommended.
- Market conditions: Rents rising fast (+4.2%/yr); 394 active listings in the ZIP; 10 comparable units currently listed for rent nearby; rentals lingering (median 44d on market — plan ~5-8 weeks vacancy on turnover, expect pricing pressure); 60% of comp listings sitting > 30 days — soft ceiling on asking rent; 1,302 units permitted in Greene County in 2024 (250 in 5+ unit buildings).
Forward outlook
- Local home prices are declining (-3.0%/yr); year-one equity from $1k of loan paydown is wiped out by about $4k of value loss. Plan a longer hold.
- Greene County population projected at +25% by 2050 — long-run rental-demand tailwind backs the buy-and-hold thesis.
Negotiation context
- Only 5 days on market — expect competitive offers; lowballing is unlikely to land.
Risks & watch-outs
- Climate carrying-cost: extreme-heat days projected 7→19/yr by 2055 (HVAC capex compounding) — expect insurance premiums to compound above CPI over the hold.
Questions for the listing agent
- What do current leases actually rent for vs. the listed asking? Can we see a recent rent roll and the last 12 months of T-12 income?
- Is there a deadline driving the sale (1031 exchange, divorce, estate, relocation)? That informs how much negotiation room exists.
- Crime grade is F in this area — have there been break-ins, vandalism, or insurance claims at this property in the last 3 years? What carrier currently insures it and at what premium?
- The area grade is low — what's the realistic commute time and amenity access for the typical tenant pool here? Any planned neighborhood developments (good or bad) we should know about?
- What's the average days-on-market for RENTAL listings here right now (not sales)? A rising rental-DOM trend means longer vacancies and softer asking-rent achievability than the comps imply.
- What's the recent tenant-quality profile in this submarket — average credit score on applications, eviction rate, late-payment / NSF rate, and stable-employment percentage? A property-management company in the area should have these aggregated.
- How much new for-sale + rental construction is in the pipeline within 1–3 miles? Heavy new supply typically softens prices + rents 12–24 months out; constrained supply supports both.
Investment metrics
- 1% rule
- 0.77% ✗
- Cap rate
- 6.12%
- Cash-on-cash
- -0.63%
- DSCR
- 0.97
- GRM
- 10.8
CMA / ARV
- ARV (on-the-fly)
- $152,724
- Comps found
- 12
Show comp detail 12 sales within ~0.75 mi
| Address | Dist | Beds/Ba | Sqft | Sold | Price | $/sf | Match |
|---|---|---|---|---|---|---|---|
| 1636 N Oak Grove Ave | 0.00mi | 3/2.0 | 1,068 (0%) | 1mo | $149,500 | $140 | 99 |
| 2611 E Pacific St | 0.05mi | 3/2.0 | 1,144 (+7%) | 2mo | $224,900 | $197 | 84 |
| 1623 N Engel Ave | 0.11mi | 3/2.0 | 1,200 (+12%) | 2mo | $215,000 | $179 | 73 |
| 1638 N Engel Ave | 0.08mi | 3/2.0 | 1,208 (+13%) | 4mo | $220,000 | $182 | 72 |
| 1637 N Hayes Ave | 0.30mi | 2/1.0 (-1) | 1,118 (+5%) | 3mo | $159,900 | $143 | 67 |
| 1914 N Lone Pine Ave | 0.36mi | 3/1.5 | 1,008 (-6%) | 6mo | $129,900 | $129 | 67 |
| 1660 N Marlan Ave | 0.33mi | 3/2.0 | 1,177 (+10%) | 2mo | $219,900 | $187 | 66 |
| 2541 E Commercial St | 0.18mi | 4/2.0 (+1) | 1,188 (+11%) | 3mo | $155,000 | $130 | 66 |
| 1817 N Burton Ave | 0.26mi | 2/2.0 (-1) | 1,178 (+10%) | 3mo | $149,000 | $126 | 63 |
| 1921 N Lonepine Ave | 0.37mi | 3/1.0 | 1,152 (+8%) | 4mo | $169,000 | $147 | 63 |
| 2313 E Atlantic St | 0.48mi | 3/1.0 | 1,136 (+6%) | 5mo | $149,000 | $131 | 59 |
| 2312 E Atlantic St | 0.44mi | 3/1.0 | 1,187 (+11%) | 2mo | $94,900 | $80 | 55 |
Match score weights: distance 35% · size 25% · config 20% · recency 20%. Top-matched comps best support the ARV.
Projected returns pro-forma
-3.0% appreciation · 4.24% rent growth · sell at horizon
- IRR
- -16.1%
- Equity multiple
- 0.42×
- Total profit
- $-24,206
- Equity at exit
- $22,291
- IRR
- -6.0%
- Equity multiple
- 0.60×
- Total profit
- $-16,914
- Equity at exit
- $12,926
Cash invested: $41,860 (down + closing). Projections, not guarantees.
Landlord ↔ Tenant lean methodology
- Overall (STATE)
- 81 Strongly Landlord-Friendly
- State Missouri
- 81 Strongly Landlord-Friendly · R+10
- County
- — inherits STATE
- City
- — inherits STATE
ZIP-level market 65803
- Home prices YoY
- -29.8%
- Rents YoY
- 4.2%
- Active inventory
- 394
- Price-to-rent
- 10.8×
Monthly cashflow live
- Estimated rent
- $1,155 high interval (Pro) →
- Mortgage (P&I)
- −$784
- Tax from tax record
- −$88 /mo · $1,055/yr
- Insurance
- −$62
- HOA
- −$0
- Vacancy / Maint / Mgmt
- −$242
- Net cashflow
- $-22
Break-even live
UW: 25.0% down · 7.5% · 30yr · 1.5% tax · 5.0% vac · 8.0% maint · 8.0% mgmt
Financing live
Cash to close
- Down payment
- $37,375
- Closing costs
- $4,485
- Reserves months
- —
- Total cash needed
- —
Loan-product check · same deal, 3 products live
Conventional
25% down · 7.5% · 30yr
- Down + closing
- —
- Monthly P&I
- —
- Monthly cashflow
- —
- DSCR
- —
- Eligible?
- —
Personal DTI + credit; lowest rate.
DSCR
20% down · 8.5% · 30yr
- Down + closing
- —
- Monthly P&I
- —
- Monthly cashflow
- —
- DSCR
- —
- Eligible?
- —
No personal income docs; deal must DSCR.
Hard money
10% down · 12.0% · 12mo
- Down + closing
- —
- Monthly P&I
- —
- Monthly cashflow
- —
- DSCR
- —
- Eligible?
- —
Short-term bridge; refi at stabilization.
Rent comps 10 comps
| Address | Beds | Baths | Sqft | Rent | $/sqft | DOM | Units | Dist |
|---|---|---|---|---|---|---|---|---|
| 1825 N Oak Grove Ave Springfield, MO | 3.0 | 1.0 | 852 | $995 | $1.17 | 43d | 1 | 0.22mi |
| 2323 E Division St Springfield, MO | 4.0 | 2.0 | 1156 | $1,495 | $1.29 | 23d | 1 | 0.33mi |
| 531 N Oak Grove Ave Springfield, MO | 2.0 | 1.5 | 1184 | $925 | $0.78 | 43d | 1 | 1.04mi |
| 504 N Patterson Ave Apt C Springfield, MO | 2.0 | 1.0 | 760 | $725 | $0.95 | 43d | 1 | 1.11mi |
| 1710 E Commercial St Unit B Springfield, MO | 2.0 | 1.0 | 950 | $775 | $0.82 | 43d | 1 | 1.11mi |
| 2650 N Barnes Ave Unit A 23 Springfield, MO | 3.0 | 2.0 | 1200 | $1,200 | $1.00 | 43d | 1 | 1.23mi |
| 2650 N Barnes Ave Apt C22 Springfield, MO | 2.0 | 2.0 | 1100 | $1,000 | $0.91 | 43d | 1 | 1.29mi |
| 2264 E Nora St Springfield, MO | 3.0 | 1.5 | 1366 | $1,200 | $0.88 | 13d | 1 | 1.36mi |
| 1501 E Blaine St Springfield, MO | 2.0 | 1.0 | 958 | $695 | $0.73 | 23d | 1 | 1.38mi |
| 1529 N Weller Ave Springfield, MO | 2.0 | 1.0 | 870 | $995 | $1.14 | 23d | 1 | 1.41mi |
Listing history 2 events
-
2026-04-11status Pending
-
2026-04-07$149,500 Active
ⓘ Source: listings_history table (triggers on properties + properties_extension) + one-shot
backfill from property_details.listing_events for pre-trigger history.
Tax reassessment forecast MO · Resets to sale price
- Current annual tax
- $1,055 · $88/mo
- Projected year-2 tax
- $1,450 · $121/mo
- Expected delta
- +$395/yr (+$33/mo · 37.5%)
ⓘ Screening estimate from a state-policy table — verify with the county assessor before closing.
Climate risk First Street
- Flood 1/10 Low FEMA zone X (unshaded) · 0% chance over 30 yrs
- Wildfire 1/10 Low
- Heat 5/10 Major 7 d/yr ≥104°F today · 19 d/yr by 30 yrs out
- Wind 2/10 Low 0% chance of damaging wind over 30 yrs
- Air quality 2/10 Low 2 unhealthy d/yr today · 2 by 30 yrs out
Nearby sold comps map
Loading sold comps map…
Walkable amenities ~0.75 mi
Loading nearby amenities…
Taxation est. · year 1
- Rental income
- $13,857
- − Mortgage interest
- −$8,374
- − Property taxes
- −$1,055
- − Insurance
- −$748
- − Repairs & maintenance
- −$1,109
- − Management
- −$1,109
- − Depreciation
- −$4,349
- Taxable loss
- −$2,886
- Est. tax savings @ 24.0%
- +$693
- After-tax cash flow
- $430/yr
For passive investors: Depreciation is non-cash, so a rental often shows a tax loss while cash-flowing — sheltering income. Rental losses are passive: they offset passive income freely, and up to $25,000/yr can offset ordinary (W-2) income if you actively participate and your MAGI is under $100k (phasing out to $0 by $150k); unused losses carry forward. On sale, claimed depreciation is recaptured at up to 25%, and gains may owe capital-gains tax (a 1031 exchange can defer both). Figures are a year-1 estimate at your 24.0% rate — not tax advice; consult a CPA.
Schools (NCES district)
- District
- Springfield R-XII
- NCES district ID
- 2928860
- Math proficiency
- 32% ▼ -2.00%
- Reading proficiency
- 46% ▼ -3.00%
- Median HH income
- $37,886
- Composite
- 32.45/100
- National rank
- #5717
- State rank
- #174 of 324 in MO
Livability — Springfield
- Score
- 75/100
- State rank
- #57
- US rank
- #4121
Category grades
Schools grade is shown separately in the Schools card above.
Census & demographics
- Census place
- Springfield, MO
- County
- Greene County · 244,327 people
- City population
- 223,044
- Metro
- Springfield, MO
- Population (ZIP)
- 42,882
- Household income
- $50,572
- Rent vs Own
- Severe rent burden
- 1305.0
Population outlook (Greene County) Hauer SSP2
- Today (2025)
- 319,054 people
- By 2030
- 335,135 · +5.0%
- By 2040
- 366,186 · +14.8%
- By 2050
- 397,431 · +24.6%
- By 2075
- 477,035 · +49.5%
- By 2100
- 520,828 · +63.2%
Race, ethnicity, and origin ACS 2023
- Neighborhood character
- Predominantly White (82%)
- Race & ethnicity
- White 82% Two or more races 9% Hispanic / Latino 6% Black 4%
- Hispanic origin (detail)
- Mexican 2% Puerto Rican 2%
- Common ancestry
- Lithuanian 2% Italian 2% Iranian 2%
- Foreign-born
- 3% · Canada
- Languages at home
- 95% English-only · Spanish 3%
Political lean MEDSL · Greene
- 2024 margin
- Strong R (+20.8) · D 38.9% · R 59.7% · Other 1.4%
- 2008→2024 swing
- -5.0pp toward R · 2008: -15.8pp · 2024: -20.8pp
- All cycles
- 2024: R+20.8 2020: R+20.1 2016: R+27.4 2012: R+24.4 2008: R+15.8
Not yet ingested
- Civics
- —
Market trends
- HPI YoY
- ▼ -87.08%
- Current HPI
- 205.0439
- Rent YoY
- ▲ 4.24%
- Metro
- Springfield, MO
- State GDP YoY
- ▲ 1.84%
- F500 in state
- 20
Industry mix (Fortune 500 HQ in MO)
| Industry | F500 HQs | Revenue |
|---|---|---|
| Healthcare | 1 | $163B |
|
||
| Insurance | 1 | $21B |
|
||
| Industrial Technology | 1 | $17B |
|
||
| Retail | 1 | $16B |
|
||
| Industrial Distribution | 1 | $10B |
|
||
| Utilities | 1 | $9B |
|
||
Price history
2 events — show timeline
- 2026-04-11 Pending — SOMO
- 2026-04-07 Listed $149,500 SOMO
Property tax history
+2.7%/yrLatest (2025): $1,055 · +9.0% YoY. Source: county tax records.
Cash-flow waterfall
monthlySold comps — $/sqft
last 12 mo · ≤1 miLoading sold comps…