2746 Bonnie Crest Ct · Montgomery, AL
Flood risk 1/10 · Minimal
- FEMA flood zone
- X (unshaded)
- Chance of flooding over 30 yrs
- 0.0%
- Est. flood insurance / yr
- $507 – $1,088
Fire risk 3/10 · Minor
- Est. fire insurance / yr
- $916 – $1,700
Heat risk 7/10 · Major
- Hot days now (above 107°F)
- 7 days/yr
- Hot days in 30 yrs
- 18 days/yr
Wind risk 8/10 · Major
- Chance of severe wind over 30 yrs
- 80.0%
Air-quality risk 3/10 · Minor
- Unhealthy air days now
- 4 days/yr
- Unhealthy air days in 30 yrs
- 4 days/yr
Risk factors via First Street. Map © Google.
Why this score? — see what drove the B- grade
The composite is a weighted blend of 9 inputs, each scored 0–100. Each bar is that input's sub-score; the figure is the points it added to the 100-point composite (weight × sub-score).
- Cash flow +25.6/30.0
- ARV discount +15.0/15.0
- DSCR +8.5/10.0
- 1% rule +5.8/10.0
- Rent growth +3.8/5.0
- Livability +3.2/5.0
- Condition / age +2.5/5.0
- Schools +1.7/10.0
- Appreciation +0.0/10.0
$119,900
🖨 Deal sheet 📄 Offer letter ✓ Due diligence
Listing remarks MLS
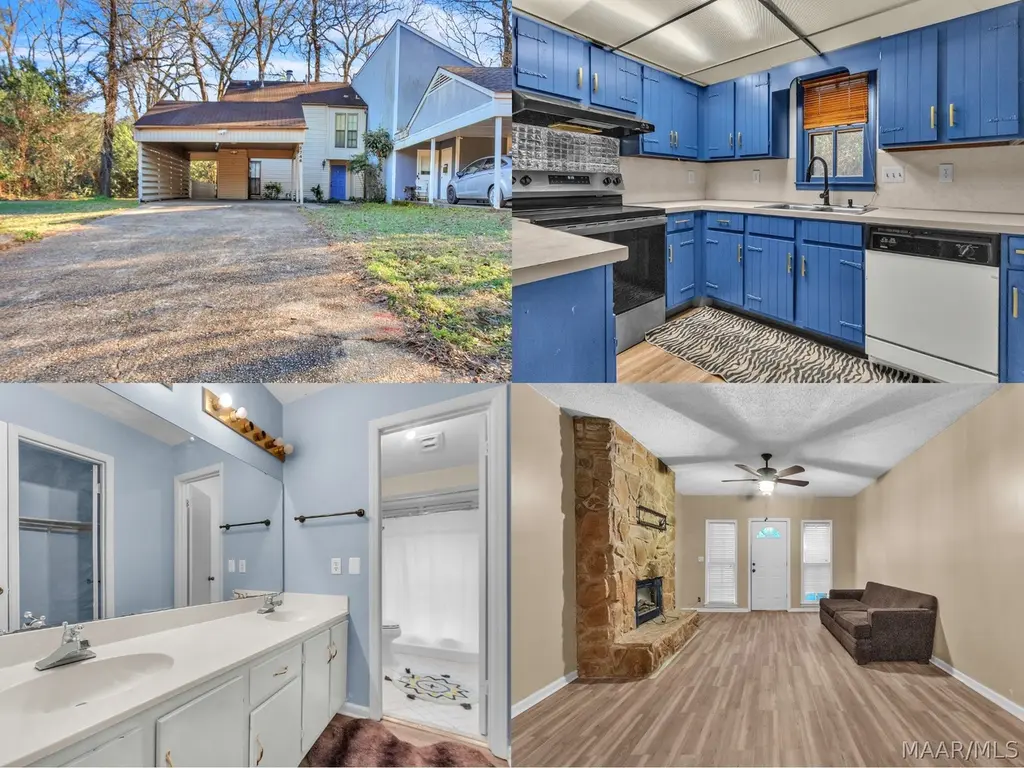
Charming 3-bedroom, 2.5-bath home offering comfort and functionality in a peaceful setting. The exterior features a welcoming façade with a spacious driveway and covered parking. Inside, the home includes a cozy living area highlighted by a striking stone fireplace and durable flooring, perfect for everyday living or entertaining. The kitchen showcases bold blue cabinetry, ample counter space, and modern appliances, providing a functional and inviting cooking space. Bathrooms are well-appointed with double vanities and clean, updated finishes. Natural light flows throughout the home, enhancing the bright and open feel. With generous living spaces, practical layout, and inviting outdoor surroundings, this property is ideal for homeowners seeking comfort, character, and convenience.
Key facts
- 2 parking spots
- Built 1978
- Listed 128 days
Neighborhood map
What this means for you Summary
Snapshot
- This is a 3-bed/2.0-bath single-family listed at $120k.
Deal economics
- At list price, monthly cash flow is $283 ($3k/yr) — positive.
- The deal already cash-flows at list — no discount required.
- Meets the 1% rule at list price ($1k rent vs $120k).
- Recommended offer: $106k (12.0% below list) — sets the bar for market timing.
- Cap rate 9.1% vs local median 6.0% in Montgomery — top-decile yield for the area; either an underpriced asset or a hidden risk that comps aren't pricing in. Stress-test before assuming the spread holds.
Location & tenants
- Location reads 65/100 on livability (#138 in AL) — a middle-class / working-renter tenant base. Strengths: cost of living A+, housing A+; Watch: schools C-, employment D, crime F.
- Montgomery County (urban): math 9% / reading 31% proficiency, ranked #106 of 129 in AL (top 82%) — low school quality limits family demand, transient renter base, plan for 1-2y turnover; 70% free/reduced lunch — lower-income household profile, screen leases tightly.
- Market conditions: Rents rising fast (+5.0%/yr); 67 active listings in the ZIP; 30 comparable units currently listed for rent nearby; rentals at typical pace (median 21d on market — plan ~3-4 weeks tenant-placement turnaround); 40% of comp listings sitting > 30 days — soft ceiling on asking rent; lower-income renter base — watch delinquency; 460 units permitted in Montgomery County in 2024 (37 in 5+ unit buildings).
- At $1,297/mo this rent would consume 48% of the median local household income ($32k/yr) (locally 642% of renters already pay >50% of income on rent) — very limited rent-growth headroom before tenants either downsize or default.
Forward outlook
- Local home prices are declining (-3.0%/yr); year-one equity from $829 of loan paydown is wiped out by about $4k of value loss. Plan a longer hold.
- Montgomery County population projected to shrink 8% by 2050 — rents likely to lag national; underwrite the cash flow, not the appreciation.
- At projected returns (-3.0% appreciation + 5.0% rent growth), your $34k cash investment doubles in ~9 years — after that, you're playing with house money.
Negotiation context
- It's been on market 128 days — a 12% lower offer ($106k) is reasonable based on typical stale-listing flexibility.
- 2 sale attempts since 6y ago with the ask held roughly flat each time — persistent listings suggest the price (not the market) is what's stuck; bring a comps-based counter.
- Current owner paid $54k; list at $120k implies a 122% gain — meaningful room to come down on a strong offer.
Risks & watch-outs
- Climate carrying-cost: severe wind risk, 80% chance of damaging wind over 30y; extreme-heat days projected 7→18/yr by 2055 (HVAC capex compounding) — expect insurance premiums to compound above CPI over the hold.
Questions for the listing agent
- It's been on market 128 days. Have you received any prior offers? Is the seller open to a 12% concession, seller financing, or rate buy-down credit?
- Built in 1978 — when were the roof, HVAC, electrical panel, plumbing, and water heater last replaced?
- Why hasn't it sold? Are there any deal-killer items the seller is aware of (foundation, flood, title, zoning, code violations)?
- Is there a deadline driving the sale (1031 exchange, divorce, estate, relocation)? That informs how much negotiation room exists.
- Crime grade is F in this area — have there been break-ins, vandalism, or insurance claims at this property in the last 3 years? What carrier currently insures it and at what premium?
- What's the average days-on-market for RENTAL listings here right now (not sales)? A rising rental-DOM trend means longer vacancies and softer asking-rent achievability than the comps imply.
- What's the recent tenant-quality profile in this submarket — average credit score on applications, eviction rate, late-payment / NSF rate, and stable-employment percentage? A property-management company in the area should have these aggregated.
- How much new for-sale + rental construction is in the pipeline within 1–3 miles? Heavy new supply typically softens prices + rents 12–24 months out; constrained supply supports both.
Investment metrics
- 1% rule
- 1.08% ✓
- Cap rate
- 9.12%
- Cash-on-cash
- 10.10%
- DSCR
- 1.45
- GRM
- 7.7
CMA / ARV
- ARV (median comp)
- $146,110
- List price
- $119,900
- Delta
- -17.94%
- Verdict
- UNDERPRICED
- Comps
- 6 within 2.0 mi
Show comp detail 12 sales within ~0.75 mi
| Address | Dist | Beds/Ba | Sqft | Sold | Price | $/sf | Match |
|---|---|---|---|---|---|---|---|
| 2713 Fairground Rd | 0.39mi | 3/2.0 | 1,802 (+1%) | 12mo | $84,900 | $47 | 71 |
| 713 Sweeten Creek Rd | 0.54mi | 3/2.0 | 1,836 (+3%) | 1mo | $150,000 | $82 | 70 |
| 989 Parkwood Dr | 0.25mi | 3/2.0 | 1,694 (-5%) | 19mo | $140,000 | $83 | 64 |
| 2804 Sumter Ave | 0.58mi | 3/2.0 | 1,800 (+1%) | 11mo | $109,900 | $61 | 63 |
| 1943 Johnson St | 0.67mi | 3/2.0 | 1,800 (+1%) | 9mo | $120,000 | $67 | 60 |
| 3013 Biltmore Ave | 0.73mi | 3/2.0 | 1,870 (+4%) | 0mo | $165,000 | $88 | 58 |
| 2731 Ashley Ave | 0.71mi | 3/2.5 | 1,919 (+7%) | 2mo | $225,000 | $117 | 51 |
| 2778 Crestview Ave | 0.43mi | 3/2.0 | 1,946 (+9%) | 18mo | $172,900 | $89 | 50 |
| 2048 Speigle St | 0.51mi | 3/1.0 | 2,000 (+12%) | 4mo | $86,200 | $43 | 49 |
| 2040 Midway St | 0.45mi | 4/2.0 (+1) | 1,684 (-6%) | 19mo | $57,000 | $34 | 48 |
| 2789 Ashley Ave | 0.70mi | 3/2.5 | 1,945 (+9%) | 7mo | $190,000 | $98 | 45 |
| 2865 Sumter Ave | 0.56mi | 3/2.0 | 2,031 (+14%) | 12mo | $185,000 | $91 | 41 |
Match score weights: distance 35% · size 25% · config 20% · recency 20%. Top-matched comps best support the ARV.
Projected returns pro-forma
-3.0% appreciation · 5.05% rent growth · sell at horizon
- IRR
- 1.0%
- Equity multiple
- 1.04×
- Total profit
- $1,262
- Equity at exit
- $17,877
- IRR
- 12.4%
- Equity multiple
- 2.07×
- Total profit
- $35,819
- Equity at exit
- $10,367
Cash invested: $33,572 (down + closing). Projections, not guarantees.
Landlord ↔ Tenant lean methodology
- Overall (STATE)
- 90 Strongly Landlord-Friendly
- State Alabama
- 90 Strongly Landlord-Friendly · R+15
- County
- — inherits STATE
- City
- — inherits STATE
ZIP-level market 36107
- Home prices YoY
- -10.9%
- Rents YoY
- 5.0%
- Active inventory
- 67
- Price-to-rent
- 7.7×
Monthly cashflow live
- Estimated rent
- $1,297 high interval (Pro) →
- Mortgage (P&I)
- −$629
- Tax from tax record
- −$64 /mo · $764/yr
- Insurance
- −$50
- HOA
- −$0
- Vacancy / Maint / Mgmt
- −$272
- Net cashflow
- $283
Break-even live
UW: 25.0% down · 7.5% · 30yr · 1.5% tax · 5.0% vac · 8.0% maint · 8.0% mgmt
Financing live
Cash to close
- Down payment
- $29,975
- Closing costs
- $3,597
- Reserves months
- —
- Total cash needed
- —
Loan-product check · same deal, 3 products live
Conventional
25% down · 7.5% · 30yr
- Down + closing
- —
- Monthly P&I
- —
- Monthly cashflow
- —
- DSCR
- —
- Eligible?
- —
Personal DTI + credit; lowest rate.
DSCR
20% down · 8.5% · 30yr
- Down + closing
- —
- Monthly P&I
- —
- Monthly cashflow
- —
- DSCR
- —
- Eligible?
- —
No personal income docs; deal must DSCR.
Hard money
10% down · 12.0% · 12mo
- Down + closing
- —
- Monthly P&I
- —
- Monthly cashflow
- —
- DSCR
- —
- Eligible?
- —
Short-term bridge; refi at stabilization.
Rent comps 30 comps
| Address | Beds | Baths | Sqft | Rent | $/sqft | DOM | Units | Dist |
|---|---|---|---|---|---|---|---|---|
| 942 Parkwood Ct Montgomery, AL | 4.0 | 2.0 | 1752 | $1,299 | $0.74 | 13d | 1 | 0.29mi |
| 3008 Cabot St Montgomery, AL | 4.0 | 2.0 | 1300 | $1,150 | $0.88 | 43d | 1 | 0.44mi |
| 2822 Sumter Ave Montgomery, AL | 3.0 | 2.5 | 1617 | $1,300 | $0.80 | 21d | 1 | 0.56mi |
| 3050 Willena Ave Montgomery, AL | 3.0 | 1.0 | 1466 | $985 | $0.67 | 21d | 1 | 0.57mi |
| 2001 Speigle St Montgomery, AL | 3.0 | 1.0 | 1260 | $1,035 | $0.82 | 43d | 1 | 0.59mi |
| 931 Whitehall Pkwy Montgomery, AL | 4.0 | 3.0 | 2403 | $1,800 | $0.75 | 44d | 1 | 0.68mi |
| 2814 Ashley Ave Montgomery, AL | 3.0 | 2.0 | 1683 | $1,350 | $0.80 | 13d | 1 | 0.71mi |
| 2941 Ashley Ave Unit 6616 Montgomery, AL | 3.0 | 2.0 | 2340 | $1,250 | $0.53 | 43d | 1 | 0.72mi |
| 1007 Highpoint Rd Montgomery, AL | 4.0 | 2.0 | 2089 | $1,581 | $0.76 | 13d | 1 | 0.82mi |
| 2769 Pelzer Ave Montgomery, AL | 3.0 | 2.0 | 1608 | $1,325 | $0.82 | 43d | 1 | 0.83mi |
| 3452 Harris St Montgomery, AL | 3.0 | 1.0 | 1400 | $1,150 | $0.82 | 21d | 1 | 0.88mi |
| 200 Eton Rd Montgomery, AL | 3.0 | 1.5 | 1500 | $895 | $0.60 | 13d | 1 | 0.98mi |
| 3105 Pelzer Ave Montgomery, AL | 4.0 | 2.0 | 1605 | $1,425 | $0.89 | 43d | 1 | 0.99mi |
| 108 Calhoun Rd Unit 108B Montgomery, AL | 2.0 | 1.0 | 1350 | $750 | $0.56 | 43d | 1 | 1.00mi |
| 167 E Salem Dr Montgomery, AL | 3.0 | 2.0 | 1700 | $1,050 | $0.62 | 43d | 1 | 1.03mi |
| 3462 Biltmore Ave Montgomery, AL | 3.0 | 2.0 | 1685 | $1,225 | $0.73 | 21d | 1 | 1.07mi |
| 19 Calhoun Rd Unit B Montgomery, AL | 2.0 | 1.0 | 2022 | $795 | $0.39 | 43d | 1 | 1.10mi |
| 804 Hillman St Montgomery, AL | 3.0 | 2.0 | 1356 | $1,295 | $0.96 | 21d | 1 | 1.12mi |
| 804 Hillman St Montgomery, AL | 3.0 | 2.0 | 1370 | $1,295 | $0.95 | 13d | 1 | 1.12mi |
| 3614 Princess Ann St Montgomery, AL | 4.0 | 2.0 | 1928 | $1,581 | $0.82 | 13d | 1 | 1.14mi |
| 2243 Winona Ave Montgomery, AL | 3.0 | 1.0 | 1492 | $1,225 | $0.82 | 21d | 1 | 1.27mi |
| 610 S Georgetown Dr Unit 1386555P Montgomery, AL | 3.0 | 1.0 | 1474 | $3,635 | $2.47 | 13d | 1 | 1.31mi |
| 7 Bradley Dr Montgomery, AL | 3.0 | 2.0 | 1529 | $1,500 | $0.98 | 13d | 1 | 1.33mi |
| 18 Oak Forest Dr Montgomery, AL | 3.0 | 2.0 | 1580 | $1,050 | $0.66 | 21d | 1 | 1.36mi |
| 15 Bradley Dr Montgomery, AL | 3.0 | 2.0 | 1365 | $1,500 | $1.10 | 21d | 1 | 1.37mi |
| 3737 Dalraida Pkwy Montgomery, AL | 3.0 | 1.0 | 1618 | $1,150 | $0.71 | 43d | 1 | 1.37mi |
| 1201 Dalraida Rd Montgomery, AL | 3.0 | 2.0 | 1673 | $1,625 | $0.97 | 43d | 1 | 1.39mi |
| 3801 Cedar Ave Montgomery, AL | 3.0 | 2.0 | 1818 | $1,681 | $0.92 | 21d | 1 | 1.44mi |
| 3760 Dalraida Pkwy Montgomery, AL | 4.0 | 2.5 | 1900 | $1,850 | $0.97 | 43d | 1 | 1.46mi |
| 3806 Marie Cook Dr Montgomery, AL | 3.0 | 2.0 | 1791 | $1,675 | $0.94 | 13d | 1 | 1.48mi |
Listing history 20 events
-
2026-06-18days on market $119,900 Active 128 DOM
-
2026-06-17days on market $119,900 Active 127 DOM
-
2026-06-16days on market $119,900 Active 126 DOM
-
2026-06-15days on market $119,900 Active 125 DOM
-
2026-06-14days on market $119,900 Active 123 DOM
-
2026-06-13days on market $119,900 Active 122 DOM
-
2026-06-10days on market $119,900 Active 120 DOM
-
2026-06-09days on market $119,900 Active 119 DOM
-
2026-06-08days on market $119,900 Active 118 DOM
-
2026-06-07days on market $119,900 Active 117 DOM
-
2026-06-03days on market $119,900 Active 113 DOM
-
2026-06-02days on market $119,900 Active 112 DOM
-
2026-06-01days on market $119,900 Active 111 DOM
-
2026-05-31days on market $119,900 Active 110 DOM
-
2026-05-30days on market $119,900 Active 109 DOM
-
2026-03-06price $119,900 798-char remark
Show marketing remark (798 chars)
Charming 3-bedroom, 2.5-bath home offering comfort and functionality in a peaceful setting. The exterior features a welcoming façade with a spacious driveway and covered parking. Inside, the home includes a cozy living area highlighted by a striking stone fireplace and durable flooring, perfect for everyday living or entertaining. The kitchen showcases bold blue cabinetry, ample counter space, and modern appliances, providing a functional and inviting cooking space. Bathrooms are well-appointed with double vanities and clean, updated finishes. Natural light flows throughout the home, enhancing the bright and open feel. With generous living spaces, practical layout, and inviting outdoor surroundings, this property is ideal for homeowners seeking comfort, character, and convenience.
-
2026-02-09$124,900 Active 798-char remark
Show marketing remark (798 chars)
Charming 3-bedroom, 2.5-bath home offering comfort and functionality in a peaceful setting. The exterior features a welcoming façade with a spacious driveway and covered parking. Inside, the home includes a cozy living area highlighted by a striking stone fireplace and durable flooring, perfect for everyday living or entertaining. The kitchen showcases bold blue cabinetry, ample counter space, and modern appliances, providing a functional and inviting cooking space. Bathrooms are well-appointed with double vanities and clean, updated finishes. Natural light flows throughout the home, enhancing the bright and open feel. With generous living spaces, practical layout, and inviting outdoor surroundings, this property is ideal for homeowners seeking comfort, character, and convenience.
-
2020-07-20soldstatus $54,000
-
2020-07-14soldstatus $54,000 494-char remark
Show marketing remark (494 chars)
3 large bedrooms, walk-in closet, sunken tub in master bath, and lots of storage. Close to downtown, Garrett Coliseum, and Gunter Air Force base. Attic has been converted into a loft for an office, bonus room, or additional bedroom. Storm windows. New french doors in the master bedroom. 2 car garage. Carpet is 3 years old downstairs. Sunken living room with stone fireplace, separate dining room with breakfast nook in kitchen with large pantry. Central heat and air. Maintenance-free siding.
-
2020-06-26$60,111 494-char remark
Show marketing remark (494 chars)
3 large bedrooms, walk-in closet, sunken tub in master bath, and lots of storage. Close to downtown, Garrett Coliseum, and Gunter Air Force base. Attic has been converted into a loft for an office, bonus room, or additional bedroom. Storm windows. New french doors in the master bedroom. 2 car garage. Carpet is 3 years old downstairs. Sunken living room with stone fireplace, separate dining room with breakfast nook in kitchen with large pantry. Central heat and air. Maintenance-free siding.
ⓘ Source: listings_history table (triggers on properties + properties_extension) + one-shot
backfill from property_details.listing_events for pre-trigger history.
Tax reassessment forecast AL · Resets to sale price
- Current annual tax
- $764 · $64/mo
- Projected year-2 tax
- $764 · $64/mo
- Expected delta
- $0/yr ($0/mo · 0.0%)
ⓘ Screening estimate from a state-policy table — verify with the county assessor before closing.
Climate risk First Street
- Flood 1/10 Low FEMA zone X (unshaded) · 0% chance over 30 yrs
- Wildfire 3/10 Moderate
- Heat 7/10 Severe 7 d/yr ≥107°F today · 18 d/yr by 30 yrs out
- Wind 8/10 Severe 80% chance of damaging wind over 30 yrs
- Air quality 3/10 Moderate 4 unhealthy d/yr today · 4 by 30 yrs out
Nearby sold comps map
Loading sold comps map…
Walkable amenities ~0.75 mi
Loading nearby amenities…
Taxation est. · year 1
- Rental income
- $15,569
- − Mortgage interest
- −$6,716
- − Property taxes
- −$764
- − Insurance
- −$600
- − Repairs & maintenance
- −$1,246
- − Management
- −$1,246
- − Depreciation
- −$3,488
- Taxable income
- $1,510
- Est. tax owed @ 24.0%
- −$362
- After-tax cash flow
- $3,028/yr
For passive investors: Depreciation is non-cash, so a rental often shows a tax loss while cash-flowing — sheltering income. Rental losses are passive: they offset passive income freely, and up to $25,000/yr can offset ordinary (W-2) income if you actively participate and your MAGI is under $100k (phasing out to $0 by $150k); unused losses carry forward. On sale, claimed depreciation is recaptured at up to 25%, and gains may owe capital-gains tax (a 1031 exchange can defer both). Figures are a year-1 estimate at your 24.0% rate — not tax advice; consult a CPA.
Schools (NCES district)
- District
- Montgomery County
- NCES district ID
- 0102430
- Math proficiency
- 9% ▼ -21.00%
- Reading proficiency
- 31% ▼ -1.00%
- Median HH income
- $43,902
- Composite
- 17.24/100
- National rank
- #9093
- State rank
- #106 of 129 in AL
Livability — Montgomery
- Score
- 65/100
- State rank
- #138
- US rank
- #13416
Category grades
Schools grade is shown separately in the Schools card above.
Census & demographics
- Census place
- Montgomery, AL
- County
- Montgomery County · 190,016 people
- City population
- 175,913
- Metro
- Montgomery, AL
- Population (ZIP)
- 8,001
- Household income
- $32,492
- Rent vs Own
- Severe rent burden
- 642.0
Population outlook (Montgomery County) Hauer SSP2
- Today (2025)
- 224,008 people
- By 2030
- 221,460 · -1.1%
- By 2040
- 214,179 · -4.4%
- By 2050
- 204,912 · -8.5%
- By 2075
- 177,821 · -20.6%
- By 2100
- 145,134 · -35.2%
Race, ethnicity, and origin ACS 2023
- Neighborhood character
- Diverse neighborhood (Simpson 0.69)
- Race & ethnicity
- Black 43% White 27% Hispanic / Latino 23% Two or more races 20%
- Hispanic origin (detail)
- Mexican 8% Cuban 3%
- Common ancestry
- Slovak 1% Iranian 1% Serbian 1%
- Foreign-born
- 11% · Canada
- Languages at home
- 83% English-only · Spanish 13%
Political lean MEDSL · Montgomery
- 2024 margin
- Solid D (+30.7) · D 64.8% · R 34.1% · Other 1.1%
- 2008→2024 swing
- +11.5pp toward D · 2008: 19.2pp · 2024: 30.7pp
- All cycles
- 2024: D+30.7 2020: D+31.5 2016: D+26.2 2012: D+24.3 2008: D+19.2
Not yet ingested
- Civics
- —
Market trends
- HPI YoY
- ▼ -18.16%
- Current HPI
- 147.8065
- Rent YoY
- ▲ 5.05%
- Metro
- Montgomery, AL
- State GDP YoY
- ▲ 2.94%
- F500 in state
- 4
Industry mix (Fortune 500 HQ in AL)
| Industry | F500 HQs | Revenue |
|---|---|---|
| Financial Services | 1 | $8B |
|
||
| Healthcare | 1 | $5B |
|
||
Price history
+99.5% since first listed5 events — show timeline
- 2026-03-06 Price Changed $119,900 MAAR
- 2026-02-09 Listed $124,900 MAAR
- 2020-07-20 Sold (Public Records) $54,000 Public Records
- 2020-07-14 Sold (MLS) $54,000 MAAR
- 2020-06-26 Listed $60,111 MAAR
Property tax history
+8.0%/yrLatest (2025): $764 · +0.0% YoY. Source: county tax records.
Cash-flow waterfall
monthlySold comps — $/sqft
last 12 mo · ≤1 miLoading sold comps…