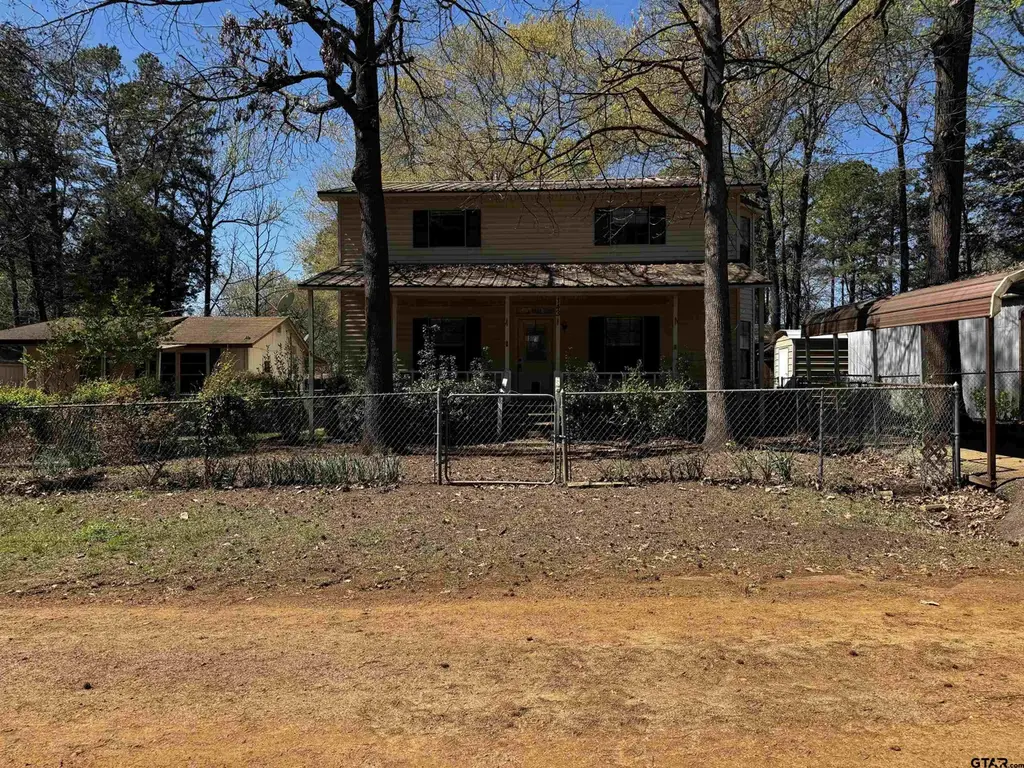
143 King Fisher · Winnsboro, TX
Flood risk 1/10 · Minimal
- FEMA flood zone
- —
- Chance of flooding over 30 yrs
- 0.0%
- Est. flood insurance / yr
- —
Fire risk 2/10 · Minimal
- Est. fire insurance / yr
- $1,222 – $2,270
Heat risk 6/10 · Moderate
- Hot days now (above 110°F)
- 7 days/yr
- Hot days in 30 yrs
- 22 days/yr
Wind risk 6/10 · Moderate
- Chance of severe wind over 30 yrs
- 27.0%
Air-quality risk 2/10 · Minimal
- Unhealthy air days now
- 0 days/yr
- Unhealthy air days in 30 yrs
- 1 days/yr
Risk factors via First Street. Map © Google.
Why this score? — see what drove the B- grade
The composite is a weighted blend of 9 inputs, each scored 0–100. Each bar is that input's sub-score; the figure is the points it added to the 100-point composite (weight × sub-score).
- Cash flow +30.0/30.0
- 1% rule +10.0/10.0
- DSCR +10.0/10.0
- ARV discount +7.5/15.0
- Schools +3.9/10.0
- Livability +3.5/5.0
- Rent growth +2.5/5.0
- Condition / age +2.5/5.0
- Appreciation +0.0/10.0
$155,000
🖨 Deal sheet 📄 Offer letter ✓ Due diligence
Listing remarks MLS
Charming property with access to beautiful Lake Cypress Springs, located in the desirable Pelican Bay community. This move-in ready home sits on four lots, offering plenty of space for outdoor living, gardening, or additional parking. The property includes a separate fully equipped cabin with kitchen, living area, bedroom, and bath—perfect for guests, extended family, or additional rental potential. Outdoor features include a large backyard ideal for cookouts and entertaining, a second carport for boat storage, a detached screened building, two storage sheds, and a small workshop perfect for keeping tools and outdoor equipment organized. The front and back yards are divided by chain-link fencing with gates, providing convenience for pets or separate outdoor spaces. Residents enjoy HOA amenities including an Olympic-size swimming pool, community building, playground, dock, and boat ramp with direct access to the lake.
Key facts
- Large backyard
- Small workshop
- Two storage sheds
Tags
Neighborhood map
What this means for you Summary
Snapshot
- This is a 3-bed/1.0-bath single-family listed at $155k.
Deal economics
- At list price, monthly cash flow is $2k ($20k/yr) — positive.
- The deal already cash-flows at list — no discount required.
- Meets the 1% rule at list price ($3k rent vs $155k).
- Recommended offer: $141k (9.0% below list) — sets the bar for market timing.
- Cap rate 19.1% vs local median 3.8% in Winnsboro — top-decile yield for the area; either an underpriced asset or a hidden risk that comps aren't pricing in. Stress-test before assuming the spread holds.
Location & tenants
- Location reads 69/100 on livability (#416 in TX) — a middle-class / working-renter tenant base. Strengths: cost of living A+, housing A+, crime B; Watch: employment D+, amenities F, commute F.
- Mount Vernon ISD (town): math 49% / reading 43% proficiency, ranked #251 of 826 in TX (top 30%) — families likely to look elsewhere, expect single-tenant / working-renter base with shorter leases.
- Market conditions: 217 active listings in the ZIP; 1 comparable units currently listed for rent nearby; 7 units permitted in Franklin County in 2024 (0 in 5+ unit buildings).
Forward outlook
- Local home prices are declining (-3.0%/yr); year-one equity from $1k of loan paydown is wiped out by about $5k of value loss. Plan a longer hold.
- At projected returns (-3.0% appreciation + 3.0% rent growth), your $43k cash investment doubles in ~3 years — after that, you're playing with house money.
Negotiation context
- It's been on market 102 days — a 9% lower offer ($141k) is reasonable based on typical stale-listing flexibility.
- 2 sale attempts since 9y ago with the ask held roughly flat each time — persistent listings suggest the price (not the market) is what's stuck; bring a comps-based counter.
Risks & watch-outs
- Climate carrying-cost: major wind risk, 27% chance of damaging wind over 30y; extreme-heat days projected 7→22/yr by 2055 (HVAC capex compounding) — expect insurance premiums to compound above CPI over the hold.
Questions for the listing agent
- It's been on market 102 days. Have you received any prior offers? Is the seller open to a 9% concession, seller financing, or rate buy-down credit?
- What does the HOA fee cover, when was the last increase, and are there any pending special assessments or reserve-fund shortfalls?
- Why hasn't it sold? Are there any deal-killer items the seller is aware of (foundation, flood, title, zoning, code violations)?
- Is there a deadline driving the sale (1031 exchange, divorce, estate, relocation)? That informs how much negotiation room exists.
- What's the average days-on-market for RENTAL listings here right now (not sales)? A rising rental-DOM trend means longer vacancies and softer asking-rent achievability than the comps imply.
- What's the recent tenant-quality profile in this submarket — average credit score on applications, eviction rate, late-payment / NSF rate, and stable-employment percentage? A property-management company in the area should have these aggregated.
- How much new for-sale + rental construction is in the pipeline within 1–3 miles? Heavy new supply typically softens prices + rents 12–24 months out; constrained supply supports both.
Investment metrics
- 1% rule
- 2.23% ✓
- Cap rate
- 19.06%
- Cash-on-cash
- 45.61%
- DSCR
- 3.03
- GRM
- 3.7
CMA / ARV
- ARV (median comp)
- $383,703
- List price
- $155,000
- Delta
- -59.60%
- Verdict
- UNDERPRICED
- Comps
- 4 within 1.0 mi
Projected returns pro-forma
-3.0% appreciation · 3.0% rent growth · sell at horizon
- IRR
- 42.8%
- Equity multiple
- 2.84×
- Total profit
- $79,996
- Equity at exit
- $23,111
- IRR
- 48.9%
- Equity multiple
- 5.73×
- Total profit
- $205,160
- Equity at exit
- $13,402
Cash invested: $43,400 (down + closing). Projections, not guarantees.
Landlord ↔ Tenant lean methodology
- Overall (STATE)
- 87 Strongly Landlord-Friendly
- State Texas
- 87 Strongly Landlord-Friendly · R+5
- County
- — inherits STATE
- City
- — inherits STATE
ZIP-level market 75494
- Home prices YoY
- -10.9%
- Active inventory
- 217
- Price-to-rent
- 3.7×
Monthly cashflow live
- Estimated rent
- $3,450 medium interval (Pro) →
- Mortgage (P&I)
- −$813
- Tax from tax record
- −$179 /mo · $2,143/yr
- Insurance
- −$65
- HOA
- −$20
- Vacancy / Maint / Mgmt
- −$724
- Net cashflow
- $1,649
Break-even live
UW: 25.0% down · 7.5% · 30yr · 1.5% tax · 5.0% vac · 8.0% maint · 8.0% mgmt
Financing live
Cash to close
- Down payment
- $38,750
- Closing costs
- $4,650
- Reserves months
- —
- Total cash needed
- —
Loan-product check · same deal, 3 products live
Conventional
25% down · 7.5% · 30yr
- Down + closing
- —
- Monthly P&I
- —
- Monthly cashflow
- —
- DSCR
- —
- Eligible?
- —
Personal DTI + credit; lowest rate.
DSCR
20% down · 8.5% · 30yr
- Down + closing
- —
- Monthly P&I
- —
- Monthly cashflow
- —
- DSCR
- —
- Eligible?
- —
No personal income docs; deal must DSCR.
Hard money
10% down · 12.0% · 12mo
- Down + closing
- —
- Monthly P&I
- —
- Monthly cashflow
- —
- DSCR
- —
- Eligible?
- —
Short-term bridge; refi at stabilization.
Rent comps 1 comps
| Address | Beds | Baths | Sqft | Rent | $/sqft | DOM | Units | Dist |
|---|---|---|---|---|---|---|---|---|
| 224 Miller Rd Scroggins, TX | 3.0 | 2.0 | 1485 | $3,450 | $2.32 | 43d | 1 | 1.16mi |
HOA detail
- Monthly dues
- $20 · $240/yr
- Likely covers
- pool
Listing history 27 events
-
2026-06-19days on market $155,000 Active 102 DOM
-
2026-06-18days on market $155,000 Active 101 DOM
-
2026-06-17days on market $155,000 Active 100 DOM
-
2026-06-16days on market $155,000 Active 99 DOM
-
2026-06-15days on market $155,000 Active 98 DOM
-
2026-06-14days on market $155,000 Active 96 DOM
-
2026-06-12days on market $155,000 Active 95 DOM
-
2026-06-09days on market $155,000 Active 92 DOM
-
2026-06-08days on market $155,000 Active 91 DOM
-
2026-06-07days on market $155,000 Active 90 DOM
-
2026-06-05days on market $155,000 Active 88 DOM
-
2026-06-02days on market $155,000 Active 85 DOM
-
2026-06-01days on market $155,000 Active 84 DOM
-
2026-05-31days on market $155,000 Active 83 DOM
-
2026-05-30days on market $155,000 Active 82 DOM
-
2026-03-09$155,000 Active 936-char remark
Show marketing remark (936 chars)
Charming property with access to beautiful Lake Cypress Springs, located in the desirable Pelican Bay community. This move-in ready home sits on four lots, offering plenty of space for outdoor living, gardening, or additional parking. The property includes a separate fully equipped cabin with kitchen, living area, bedroom, and bath—perfect for guests, extended family, or additional rental potential. Outdoor features include a large backyard ideal for cookouts and entertaining, a second carport for boat storage, a detached screened building, two storage sheds, and a small workshop perfect for keeping tools and outdoor equipment organized. The front and back yards are divided by chain-link fencing with gates, providing convenience for pets or separate outdoor spaces. Residents enjoy HOA amenities including an Olympic-size swimming pool, community building, playground, dock, and boat ramp with direct access to the lake.
-
2025-11-12price $165,000
-
2025-10-16price $179,500
-
2025-09-24price $185,000
-
2025-08-28price $189,500
-
2025-08-09price $192,500
-
2025-07-19price $195,000
-
2025-06-05price $197,500
-
2017-09-11soldstatus
-
2017-08-18$109,000
-
2007-11-28soldstatus
-
1999-05-05soldstatus
ⓘ Source: listings_history table (triggers on properties + properties_extension) + one-shot
backfill from property_details.listing_events for pre-trigger history.
Tax reassessment forecast TX · Resets to sale price
- Current annual tax
- $2,143 · $179/mo
- Projected year-2 tax
- $2,836 · $236/mo
- Expected delta
- +$693/yr (+$58/mo · 32.4%)
ⓘ Screening estimate from a state-policy table — verify with the county assessor before closing.
Climate risk First Street
- Flood 1/10 Low 0% chance over 30 yrs
- Wildfire 2/10 Low
- Heat 6/10 Major 7 d/yr ≥110°F today · 22 d/yr by 30 yrs out
- Wind 6/10 Major 27% chance of damaging wind over 30 yrs
- Air quality 2/10 Low 0 unhealthy d/yr today · 1 by 30 yrs out
Nearby sold comps map
Loading sold comps map…
Walkable amenities ~0.75 mi
Loading nearby amenities…
Taxation est. · year 1
- Rental income
- $41,400
- − Mortgage interest
- −$8,682
- − Property taxes
- −$2,143
- − Insurance
- −$775
- − Repairs & maintenance
- −$3,312
- − Management
- −$3,312
- − HOA
- −$240
- − Depreciation
- −$4,509
- Taxable income
- $18,426
- Est. tax owed @ 24.0%
- −$4,422
- After-tax cash flow
- $15,372/yr
For passive investors: Depreciation is non-cash, so a rental often shows a tax loss while cash-flowing — sheltering income. Rental losses are passive: they offset passive income freely, and up to $25,000/yr can offset ordinary (W-2) income if you actively participate and your MAGI is under $100k (phasing out to $0 by $150k); unused losses carry forward. On sale, claimed depreciation is recaptured at up to 25%, and gains may owe capital-gains tax (a 1031 exchange can defer both). Figures are a year-1 estimate at your 24.0% rate — not tax advice; consult a CPA.
Schools (NCES district)
- District
- Mount Vernon ISD
- NCES district ID
- 4831770
- Math proficiency
- 49% ▼ -6.00%
- Reading proficiency
- 43% ▬ 0.00%
- Median HH income
- $46,788
- Composite
- 39.19/100
- National rank
- #4021
- State rank
- #251 of 826 in TX
Livability — Winnsboro
- Score
- 69/100
- State rank
- #416
- US rank
- #8564
Category grades
Schools grade is shown separately in the Schools card above.
Census & demographics
- Population (ZIP)
- 11,685
Population outlook (Franklin County) Hauer SSP2
- Today (2025)
- 10,621 people
- By 2030
- 10,648 · +0.3%
- By 2040
- 10,629 · +0.1%
- By 2050
- 10,486 · -1.3%
- By 2075
- 10,038 · -5.5%
- By 2100
- 8,816 · -17.0%
Race, ethnicity, and origin ACS 2023
- Neighborhood character
- Predominantly White (82%)
- Race & ethnicity
- White 82% Hispanic / Latino 13% Two or more races 10% Black 1% Asian 1%
- Hispanic origin (detail)
- Mexican 12%
- Common ancestry
- Serbian 2% Iranian 2% Slovak 1%
- Foreign-born
- 7% · Canada, South Korea
- Languages at home
- 89% English-only · Spanish 8% German/W. Germanic 1% Arabic 1%
Political lean MEDSL · Franklin
- 2024 margin
- Solid R (+68.9) · D 15.3% · R 84.2%
- 2008→2024 swing
- -16.5pp toward R · 2008: -52.5pp · 2024: -68.9pp
- All cycles
- 2024: R+68.9 2020: R+67.0 2016: R+67.0 2012: R+63.4 2008: R+52.5
Not yet ingested
- Civics
- —
Market trends
- HPI YoY
- ▼ -28.64%
- Current HPI
- 234.6203
- Rent YoY
- —
- Metro
- —
- State GDP YoY
- ▲ 3.95%
- F500 in state
- 110
Industry mix (Fortune 500 HQ in TX)
| Industry | F500 HQs | Revenue |
|---|---|---|
| Energy | 16 | $1,198B |
|
||
| Technology | 5 | $198B |
|
||
| Engineering / Construction | 4 | $72B |
|
||
| Energy Services | 3 | $60B |
|
||
| Utilities | 3 | $41B |
|
||
| Healthcare | 2 | $330B |
|
||
Price history
+42.2% since first listed12 events — show timeline
- 2026-03-09 Listed $155,000 GTAR
- 2025-11-12 Price Changed $165,000 GTAR
- 2025-10-16 Price Changed $179,500 GTAR
- 2025-09-24 Price Changed $185,000 GTAR
- 2025-08-28 Price Changed $189,500 GTAR
- 2025-08-09 Price Changed $192,500 GTAR
- 2025-07-19 Price Changed $195,000 GTAR
- 2025-06-05 Price Changed $197,500 GTAR
- 2017-09-11 Sold (MLS) — GTAR
- 2017-08-18 Listed $109,000 GTAR
- 2007-11-28 Sold (Public Records) — Public Records
- 1999-05-05 Sold (Public Records) — Public Records
Property tax history
+0.7%/yrLatest (2025): $2,143 · +3.1% YoY. Source: county tax records.
Cash-flow waterfall
monthlySold comps — $/sqft
last 12 mo · ≤1 miLoading sold comps…