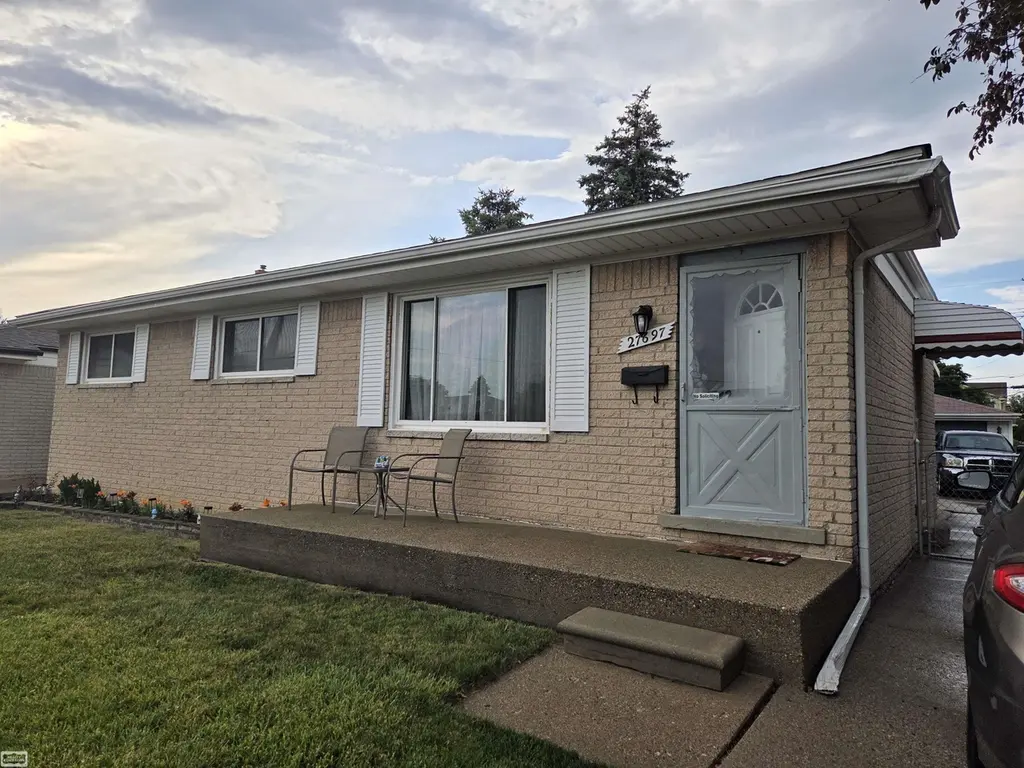
27697 Larry St · Roseville, MI
Flood risk 1/10 · Minimal
- FEMA flood zone
- X (unshaded)
- Chance of flooding over 30 yrs
- 0.0%
- Est. flood insurance / yr
- $473 – $860
Fire risk 1/10 · Minimal
- Est. fire insurance / yr
- $784 – $1,456
Heat risk 3/10 · Minor
- Hot days now (above 96°F)
- 7 days/yr
- Hot days in 30 yrs
- 15 days/yr
Wind risk 1/10 · Minimal
- Chance of severe wind over 30 yrs
- —
Air-quality risk 3/10 · Minor
- Unhealthy air days now
- 3 days/yr
- Unhealthy air days in 30 yrs
- 4 days/yr
Risk factors via First Street. Map © Google.
Why this score? — see what drove the F grade
The composite is a weighted blend of 9 inputs, each scored 0–100. Each bar is that input's sub-score; the figure is the points it added to the 100-point composite (weight × sub-score).
- Cash flow +11.7/30.0
- Livability +3.6/5.0
- DSCR +3.4/10.0
- 1% rule +3.1/10.0
- Rent growth +2.6/5.0
- Condition / age +2.5/5.0
- ARV discount +1.5/15.0
- Schools +1.5/10.0
- Appreciation +0.0/10.0
$185,000
🖨 Deal sheet 📄 Offer letter ✓ Due diligence
Listing remarks
Welcome home to this beautifully maintained ranch in a highly desirable Warren location! This move-in-ready home features numerous updates, including a newer roof, furnace, flooring, and an updated bathroom. The bright, open concept layout offers comfortable living and entertaining space, while the full, dry basement provides endless possibilities for additional living space, storage, or recreation. Enjoy year-round relaxation in the sunroom overlooking the spacious, fully fenced backyard. All appliances are included, making your move even easier. The oversized 2.5-car garage offers plenty of room for vehicles, tools, and extra storage. Conveniently located near shopping, dining, schools, p
Key facts
- Newer roof
- Sunroom
- Full dry basement
Tags
Property features AI
Exterior
- Parking: Detached garage with automatic door opener and electrical in the garage; Approximately 2.5 parking spaces in garage
- Utilities: Public water at street; Public sewer at street; Natural gas
- Home design: Single-story residential home; Built in 1967; Below-grade finished area present
- Construction: Brick construction; Basement foundation
- Exterior features: Brick exterior; Paved street frontage; Road frontage
Interior
- Bedrooms: All bedrooms on the first floor; Bedroom dimensions include 9 x 9 and 11 (width)
- Bathrooms: 1 full bathroom on the first floor
- Heating & cooling: Forced air heating; Natural gas fuel
- Interior features: Basement present
Neighborhood map
What this means for you Summary
Snapshot
- This is a 3-bed/1.0-bath single-family listed at $185k.
Deal economics
- At list price, monthly cash flow is $-54 ($-649/yr) — negative.
- To cash-flow at today's rent, offer at most $175k (5.2% below list).
- To meet the 1% rule (rent ≥ 1% of price), the offer needs to be $150k (18.8% below list).
- Recommended offer: $150k (18.8% below list) — sets the bar for 1% rule.
Location & tenants
- Location reads 72/100 on livability (#258 in MI) — a middle-class / working-renter tenant base. Strengths: commute A+, cost of living A+, housing A+; Watch: health & safety D+, employment D, schools F.
- Roseville Community Schools (suburban): math 11% / reading 24% proficiency, ranked #483 of 540 in MI (top 89%) — low school quality limits family demand, transient renter base, plan for 1-2y turnover; 60% free/reduced lunch — lower-income household profile, screen leases tightly.
- Market conditions: Rents flat; 265 active listings in the ZIP; 29 comparable units currently listed for rent nearby; rentals at typical pace (median 22d on market — plan ~3-4 weeks tenant-placement turnaround); 1,321 units permitted in Macomb County in 2024 (86 in 5+ unit buildings).
Forward outlook
- Local home prices are declining (-3.0%/yr); year-one equity from $1k of loan paydown is wiped out by about $6k of value loss. Plan a longer hold.
- Macomb County population projected at +9% by 2050 — modest demand growth; plan on rents tracking national, not racing it.
Negotiation context
- Only 4 days on market — expect competitive offers; lowballing is unlikely to land.
Questions for the listing agent
- What do current leases actually rent for vs. the listed asking? Can we see a recent rent roll and the last 12 months of T-12 income?
- Built in 1967 — when were the roof, HVAC, electrical panel, plumbing, and water heater last replaced?
- Is there a deadline driving the sale (1031 exchange, divorce, estate, relocation)? That informs how much negotiation room exists.
- Schools are F-rated, which usually means shorter tenancies and higher turnover. Who's the typical renter profile here, and what's been the actual vacancy rate?
- Crime grade is F in this area — have there been break-ins, vandalism, or insurance claims at this property in the last 3 years? What carrier currently insures it and at what premium?
- The area grade is low — what's the realistic commute time and amenity access for the typical tenant pool here? Any planned neighborhood developments (good or bad) we should know about?
- What's the average days-on-market for RENTAL listings here right now (not sales)? A rising rental-DOM trend means longer vacancies and softer asking-rent achievability than the comps imply.
- What's the recent tenant-quality profile in this submarket — average credit score on applications, eviction rate, late-payment / NSF rate, and stable-employment percentage? A property-management company in the area should have these aggregated.
- How much new for-sale + rental construction is in the pipeline within 1–3 miles? Heavy new supply typically softens prices + rents 12–24 months out; constrained supply supports both.
Investment metrics
- 1% rule
- 0.81% ✗
- Cap rate
- 5.94%
- Cash-on-cash
- -1.25%
- DSCR
- 0.94
- GRM
- 10.3
CMA / ARV
- ARV (on-the-fly)
- $163,254
- Comps found
- 12
Show comp detail 12 sales within ~0.75 mi
| Address | Dist | Beds/Ba | Sqft | Sold | Price | $/sf | Match |
|---|---|---|---|---|---|---|---|
| 27241 Woodmont St | 0.30mi | 3/1.0 | 924 (-4%) | 1mo | $122,000 | $132 | 78 |
| 27320 Grandmont St | 0.33mi | 3/1.0 | 924 (-4%) | 2mo | $160,000 | $173 | 76 |
| 27321 Grandmont St | 0.31mi | 3/1.0 | 924 (-4%) | 3mo | $107,500 | $116 | 76 |
| 28053 Fountain St | 0.61mi | 3/1.0 | 945 (-2%) | 1mo | $223,000 | $236 | 67 |
| 26710 Lehner St | 0.49mi | 3/1.0 | 924 (-4%) | 3mo | $180,000 | $195 | 67 |
| 26621 Kathy St | 0.55mi | 3/1.0 | 924 (-4%) | 0mo | $155,900 | $169 | 67 |
| 28140 Cole St | 0.27mi | 2/1.0 (-1) | 840 (-13%) | 1mo | $210,000 | $250 | 60 |
| 15010 Petrie St | 0.72mi | 3/1.0 | 936 (-3%) | 3mo | $180,000 | $192 | 59 |
| 26153 Nagel St | 0.73mi | 3/1.0 | 924 (-4%) | 2mo | $101,000 | $109 | 57 |
| 27281 Gloede Dr | 0.61mi | 2/1.0 (-1) | 918 (-5%) | 2mo | $119,900 | $131 | 56 |
| 26637 Wenfield St | 0.75mi | 2/1.0 (-1) | 945 (-2%) | 1mo | $122,000 | $129 | 56 |
| 27155 Blum St | 0.57mi | 3/1.0 | 1,068 (+11%) | 3mo | $137,000 | $128 | 53 |
Match score weights: distance 35% · size 25% · config 20% · recency 20%. Top-matched comps best support the ARV.
Projected returns pro-forma
-3.0% appreciation · 0.39% rent growth · sell at horizon
- IRR
- -21.2%
- Equity multiple
- 0.28×
- Total profit
- $-37,272
- Equity at exit
- $27,584
- IRR
- -22.1%
- Equity multiple
- -0.00×
- Total profit
- $-51,876
- Equity at exit
- $15,995
Cash invested: $51,800 (down + closing). Projections, not guarantees.
Landlord ↔ Tenant lean methodology
- Overall (STATE)
- 62 Landlord-Friendly
- State Michigan
- 62 Landlord-Friendly · EVEN
- County
- — inherits STATE
- City
- — inherits STATE
ZIP-level market 48066
- Rents YoY
- 0.4%
- Active inventory
- 265
- Price-to-rent
- 10.3×
Monthly cashflow live
- Estimated rent
- $1,503 high interval (Pro) →
- Mortgage (P&I)
- −$970
- Tax from tax record
- −$194 /mo · $2,332/yr
- Insurance
- −$77
- HOA
- −$0
- Vacancy / Maint / Mgmt
- −$316
- Net cashflow
- $-54
Break-even live
UW: 25.0% down · 7.5% · 30yr · 1.5% tax · 5.0% vac · 8.0% maint · 8.0% mgmt
Financing live
Cash to close
- Down payment
- $46,250
- Closing costs
- $5,550
- Reserves months
- —
- Total cash needed
- —
Loan-product check · same deal, 3 products live
Conventional
25% down · 7.5% · 30yr
- Down + closing
- —
- Monthly P&I
- —
- Monthly cashflow
- —
- DSCR
- —
- Eligible?
- —
Personal DTI + credit; lowest rate.
DSCR
20% down · 8.5% · 30yr
- Down + closing
- —
- Monthly P&I
- —
- Monthly cashflow
- —
- DSCR
- —
- Eligible?
- —
No personal income docs; deal must DSCR.
Hard money
10% down · 12.0% · 12mo
- Down + closing
- —
- Monthly P&I
- —
- Monthly cashflow
- —
- DSCR
- —
- Eligible?
- —
Short-term bridge; refi at stabilization.
Rent comps 29 comps
| Address | Beds | Baths | Sqft | Rent | $/sqft | DOM | Units | Dist |
|---|---|---|---|---|---|---|---|---|
| 27241 Woodmont St Roseville, MI | 3.0 | 1.0 | 924 | $1,550 | $1.68 | 2d | 1 | 0.30mi |
| 26711 Lehner St Roseville, MI | 3.0 | 1.0 | 960 | $1,575 | $1.64 | 24d | 1 | 0.52mi |
| 26536 Kathy St Roseville, MI | 3.0 | 1.0 | 1000 | $1,499 | $1.50 | 24d | 1 | 0.63mi |
| 26511 Grandmont St Roseville, MI | 3.0 | 1.0 | 960 | $1,495 | $1.56 | 4d | 1 | 0.67mi |
| 26153 Nagel St Roseville, MI | 3.0 | 1.0 | 924 | $1,500 | $1.62 | 15d | 1 | 0.74mi |
| 16425 12 Mile Rd Roseville, MI | 2.0 | 1.0 | 800 | $1,100 | $1.38 | 22d | 1 | 0.75mi |
| 16579 12 Mile Rd Unit 16579 Roseville, MI | 2.0 | 1.0 | 850 | $1,275 | $1.50 | 44d | 1 | 0.80mi |
| 16577 12 Mile Rd Roseville, MI | 2.0 | 1.0 | 850 | $1,275 | $1.50 | 44d | 1 | 0.80mi |
| 16840 E Eleven Mile Rd Roseville, MI | 2.0 | 1.0 | 900 | $1,300 | $1.44 | 22d | 3 | 0.82mi |
| 16840 E Eleven Mile Rd Roseville, MI | 2.0 | 1.0 | 900 | $1,300 | $1.44 | 24d | 3 | 0.82mi |
| 16840 E Eleven Mile Rd Unit 104 Roseville, MI | 2.0 | 1.0 | 900 | $1,200 | $1.33 | 44d | 1 | 0.82mi |
| 16840 E 11 Mile Rd Unit 109 Roseville, MI | 2.0 | 1.0 | 900 | $1,400 | $1.56 | 44d | 1 | 0.82mi |
| 16840 E Eleven Mile Rd Unit 103 Roseville, MI | 2.0 | 1.0 | 900 | $1,250 | $1.39 | 44d | 1 | 0.82mi |
| 16944 E 11 Mile Rd Unit C2 Roseville, MI | 2.0 | 1.0 | 900 | $1,295 | $1.44 | 24d | 1 | 0.88mi |
| 16651 Twelve Mile Rd Roseville, MI | 2.0–3.0 | 1.5 | 957 | $1,720 | $1.80 | 2d | 1 | 0.88mi |
| 26160 Regency Club Dr Warren, MI | 1.0–3.0 | 1.0–2.0 | 1011 | $1,998 | $1.98 | 2d | 15 | 0.90mi |
| 28368 Rosemont St Roseville, MI | 2.0 | 1.0 | 696 | $1,500 | $2.16 | 22d | 1 | 0.96mi |
| 17392 Tennyson St Roseville, MI | 3.0 | 1.0 | 900 | $1,649 | $1.83 | 2d | 1 | 1.01mi |
| 17405 Ivanhoe St Roseville, MI | 3.0 | 1.0 | 969 | $1,600 | $1.65 | 44d | 1 | 1.03mi |
| 28744 Maple St Roseville, MI | 3.0 | 1.0 | 1050 | $1,295 | $1.23 | 44d | 1 | 1.15mi |
| 25672 Lira Ln Warren, MI | 2.0 | 1.0 | 831 | $1,250 | $1.50 | 18d | 1 | 1.18mi |
| 25184 Wiseman St Roseville, MI | 3.0 | 1.0 | 1000 | $1,750 | $1.75 | 3d | 1 | 1.32mi |
| 25184 Wiseman St Roseville, MI | 3.0 | 1.0 | 895 | $1,750 | $1.96 | 22d | 1 | 1.32mi |
| 25202 Firwood Ave Warren, MI | 3.0 | 1.0 | 1100 | $1,350 | $1.23 | 24d | 1 | 1.35mi |
| 26251 Pinehurst St Unit 251d Roseville, MI | 2.0 | 1.0 | 1000 | $1,200 | $1.20 | 44d | 1 | 1.36mi |
| 26221 Pinehurst St Roseville, MI | 2.0 | 1.0 | 1000 | $1,200 | $1.20 | 2d | 1 | 1.37mi |
| 13741 McKinley Ave Unit 1032320P Warren, MI | 2.0 | 1.0 | 839 | $5,023 | $5.99 | 2d | 1 | 1.39mi |
| 25107 Rosenbusch Blvd Warren, MI | 3.0 | 1.0 | 903 | $1,523 | $1.69 | 14d | 1 | 1.44mi |
| 30541 Bluehill St Roseville, MI | 3.0 | 1.5 | 989 | $1,850 | $1.87 | 44d | 1 | 1.44mi |
Listing history 7 events
-
2026-06-18days on market $185,000 Active 4 DOM
-
2026-06-17days on market $185,000 Active 3 DOM
-
2026-06-16days on market $185,000 Active 2 DOM
-
2026-06-15days on market $185,000 Active 1 DOM
-
2026-06-15days on market $185,000 Active 2 DOM
-
2026-06-13remarks 699-char remark
-
2026-06-13$185,000 Active 1 DOM
ⓘ Source: listings_history table (triggers on properties + properties_extension) + one-shot
backfill from property_details.listing_events for pre-trigger history.
Tax reassessment forecast MI · Partial reset (capped growth)
- Current annual tax
- $2,332 · $194/mo
- Projected year-2 tax
- $2,591 · $216/mo
- Expected delta
- +$258/yr (+$22/mo · 11.1%)
ⓘ Screening estimate from a state-policy table — verify with the county assessor before closing.
Climate risk First Street
- Flood 1/10 Low FEMA zone X (unshaded) · 0% chance over 30 yrs
- Wildfire 1/10 Low
- Heat 3/10 Moderate 7 d/yr ≥96°F today · 15 d/yr by 30 yrs out
- Wind 1/10 Low
- Air quality 3/10 Moderate 3 unhealthy d/yr today · 4 by 30 yrs out
Nearby sold comps map
Loading sold comps map…
Walkable amenities ~0.75 mi
Loading nearby amenities…
Taxation est. · year 1
- Rental income
- $18,037
- − Mortgage interest
- −$10,363
- − Property taxes
- −$2,332
- − Insurance
- −$925
- − Repairs & maintenance
- −$1,443
- − Management
- −$1,443
- − Depreciation
- −$5,382
- Taxable loss
- −$3,850
- Est. tax savings @ 24.0%
- +$924
- After-tax cash flow
- $275/yr
For passive investors: Depreciation is non-cash, so a rental often shows a tax loss while cash-flowing — sheltering income. Rental losses are passive: they offset passive income freely, and up to $25,000/yr can offset ordinary (W-2) income if you actively participate and your MAGI is under $100k (phasing out to $0 by $150k); unused losses carry forward. On sale, claimed depreciation is recaptured at up to 25%, and gains may owe capital-gains tax (a 1031 exchange can defer both). Figures are a year-1 estimate at your 24.0% rate — not tax advice; consult a CPA.
Schools (NCES district)
- District
- Roseville Community Schools
- NCES district ID
- 2630210
- Math proficiency
- 11% ▼ -8.00%
- Reading proficiency
- 24% ▼ -7.00%
- Median HH income
- $41,590
- Composite
- 14.98/100
- National rank
- #9363
- State rank
- #483 of 540 in MI
Livability — Roseville
- Score
- 72/100
- State rank
- #258
- US rank
- #6400
Category grades
Schools grade is shown separately in the Schools card above.
Census & demographics
- Census place
- Roseville, MI
- County
- Macomb County · 638,552 people
- City population
- 47,123
- Metro
- Detroit-Warren-Dearborn, MI
- Population (ZIP)
- 47,123
- Household income
- $62,182
- Rent vs Own
- Severe rent burden
- 1712.0
Population outlook (Macomb County) Hauer SSP2
- Today (2025)
- 925,296 people
- By 2030
- 948,226 · +2.5%
- By 2040
- 983,961 · +6.3%
- By 2050
- 1,010,200 · +9.2%
- By 2075
- 1,076,222 · +16.3%
- By 2100
- 1,077,065 · +16.4%
Race, ethnicity, and origin ACS 2023
- Neighborhood character
- Predominantly White (65%)
- Race & ethnicity
- White 65% Black 23% Two or more races 7% Hispanic / Latino 4% Asian 2%
- Common ancestry
- Romanian 12% Lithuanian 4% Slovak 2%
- Foreign-born
- 5% · Canada
- Languages at home
- 93% English-only · Spanish 2% Russian/Polish/Slavic 1% Other Indo-European 1%
Political lean MEDSL · Macomb
- 2024 margin
- R (+13.7) · D 42.2% · R 55.9% · Other 1.9%
- 2008→2024 swing
- -22.3pp toward R · 2008: 8.6pp · 2024: -13.7pp
- All cycles
- 2024: R+13.7 2020: R+8.1 2016: R+11.6 2012: D+4.0 2008: D+8.6
Not yet ingested
- Civics
- —
Market trends
- HPI YoY
- ▼ -232.95%
- Current HPI
- 217.4171
- Rent YoY
- ▲ 0.39%
- Metro
- Detroit-Warren-Dearborn, MI
- State GDP YoY
- ▲ 1.37%
- F500 in state
- 28
Industry mix (Fortune 500 HQ in MI)
| Industry | F500 HQs | Revenue |
|---|---|---|
| Automotive Parts | 3 | $48B |
|
||
| Automotive | 2 | $372B |
|
||
| Chemicals | 1 | $45B |
|
||
| Automotive Retail | 1 | $29B |
|
||
| Healthcare / Medical Devices | 1 | $23B |
|
||
| Automotive Technology | 1 | $20B |
|
||
Price history
+0.0% since first listed2 events — show timeline
- 2026-06-13 Listed $185,000 MiRealSource-MiMLS
- 2026-06-12 Coming Soon $185,000 MiRealSource-MiMLS
Property tax history
+3.9%/yrLatest (2025): $2,332 · +4.3% YoY. Source: county tax records.
Cash-flow waterfall
monthlySold comps — $/sqft
last 12 mo · ≤1 miLoading sold comps…