25531 S 608 Ct · Copeland, OK
Flood risk 6/10 · Moderate
- FEMA flood zone
- X (unshaded)
- Chance of flooding over 30 yrs
- 0.71%
- Est. flood insurance / yr
- $507 – $1,088
Fire risk 1/10 · Minimal
- Est. fire insurance / yr
- $2,463 – $4,575
Heat risk 6/10 · Moderate
- Hot days now (above 111°F)
- 7 days/yr
- Hot days in 30 yrs
- 21 days/yr
Wind risk 3/10 · Minor
- Chance of severe wind over 30 yrs
- 4.0%
Air-quality risk 2/10 · Minimal
- Unhealthy air days now
- 1 days/yr
- Unhealthy air days in 30 yrs
- 2 days/yr
Risk factors via First Street. Map © Google.
Why this score? — see what drove the C- grade
The composite is a weighted blend of 9 inputs, each scored 0–100. Each bar is that input's sub-score; the figure is the points it added to the 100-point composite (weight × sub-score).
- Cash flow +22.4/30.0
- ARV discount +7.5/15.0
- DSCR +7.2/10.0
- 1% rule +5.0/10.0
- Livability +3.1/5.0
- Rent growth +2.5/5.0
- Condition / age +2.5/5.0
- Schools +2.4/10.0
- Appreciation +0.0/10.0
$140,000
🖨 Deal sheet 📄 Offer letter ✓ Due diligence
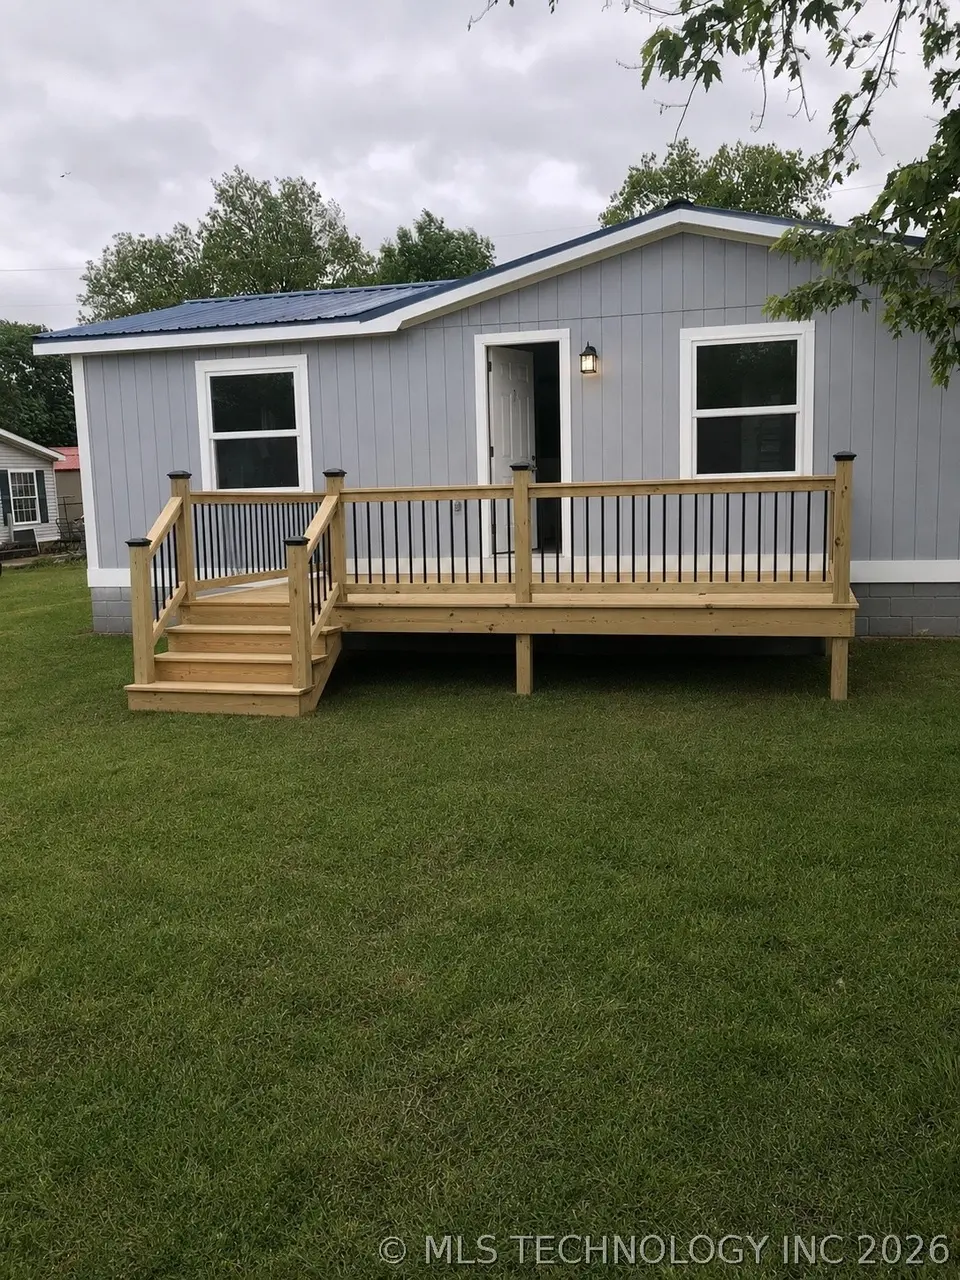
Listing remarks
Lake View! Cute, fully Remodeled 3 bed 2 bath Double Wide Home.
Key facts
- 6,750 sq ft lot
- Built 1996
Property features AI
Finance
- Other: Lot under 1 acre (lake access to Grand Lake with boat ramp/lift access; property less than 1 mile to water)
- HOA & community: Has homeowners association; Annual HOA fee of $435; HOA covers water and sewer
Exterior
- Security: No safety shelter
- Utilities: Electricity available; Private water; Private sewer
- Home design: Single-story; Southeast-facing; Has a view (Grand Lake)
- Construction: Built as modular/prefab; HardiPlank exterior; Metal roof; Crawlspace foundation; Year built per public records
- Exterior features: Deck; Porch; Shed(s); No notable additional exterior features listed
Interior
- Kitchen: Oven; Range; Dishwasher
- Flooring: Vinyl flooring
- Bathrooms: 2 full bathrooms
- Heating & cooling: Central heating (electric); Central air conditioning
- Interior features: Granite counters; Aluminum window frames
- Laundry & utility: Electric water heater
Neighborhood map
What this means for you Summary
Snapshot
- This is a 3-bed/1.0-bath manufactured listed at $140k.
Deal economics
- At list price, monthly cash flow is $232 ($3k/yr) — positive.
- The deal already cash-flows at list — no discount required.
- Meets the 1% rule at list price ($1k rent vs $140k).
Location & tenants
- Location reads 61/100 on livability (#312 in OK) — a middle-class / working-renter tenant base. Strengths: cost of living A+, housing A+, crime A; Watch: schools F, amenities F, commute F.
- Grove (town): math 26% / reading 31% proficiency, ranked #77 of 270 in OK (top 28%) — low school quality limits family demand, transient renter base, plan for 1-2y turnover.
- Market conditions: 116 active listings in the ZIP; 51 units permitted in Delaware County in 2024 (0 in 5+ unit buildings).
Forward outlook
- Local home prices are declining (-3.0%/yr); year-one equity from $968 of loan paydown is wiped out by about $4k of value loss. Plan a longer hold.
- Delaware County population projected to shrink 6% by 2050 — rents likely to lag national; underwrite the cash flow, not the appreciation.
Negotiation context
- Only 1 days on market — expect competitive offers; lowballing is unlikely to land.
- 2 sale attempts with the ask held roughly flat each time — persistent listings suggest the price (not the market) is what's stuck; bring a comps-based counter.
- Current owner paid $60k; list at $140k implies a 133% gain — meaningful room to come down on a strong offer.
Risks & watch-outs
- Climate carrying-cost: major flood risk; extreme-heat days projected 7→21/yr by 2055 (HVAC capex compounding) — expect insurance premiums to compound above CPI over the hold.
Questions for the listing agent
- What does the HOA fee cover, when was the last increase, and are there any pending special assessments or reserve-fund shortfalls?
- Is there a deadline driving the sale (1031 exchange, divorce, estate, relocation)? That informs how much negotiation room exists.
- Schools are F-rated, which usually means shorter tenancies and higher turnover. Who's the typical renter profile here, and what's been the actual vacancy rate?
- What's the average days-on-market for RENTAL listings here right now (not sales)? A rising rental-DOM trend means longer vacancies and softer asking-rent achievability than the comps imply.
- What's the recent tenant-quality profile in this submarket — average credit score on applications, eviction rate, late-payment / NSF rate, and stable-employment percentage? A property-management company in the area should have these aggregated.
- How much new for-sale + rental construction is in the pipeline within 1–3 miles? Heavy new supply typically softens prices + rents 12–24 months out; constrained supply supports both.
Investment metrics
- 1% rule
- 1.00% ✓
- Cap rate
- 8.28%
- Cash-on-cash
- 7.11%
- DSCR
- 1.32
- GRM
- 8.3
CMA / ARV
No comps found within radius.
Projected returns pro-forma
-3.0% appreciation · 3.0% rent growth · sell at horizon
- IRR
- -5.4%
- Equity multiple
- 0.80×
- Total profit
- $-7,921
- Equity at exit
- $20,874
- IRR
- 4.2%
- Equity multiple
- 1.31×
- Total profit
- $12,016
- Equity at exit
- $12,105
Cash invested: $39,200 (down + closing). Projections, not guarantees.
Landlord ↔ Tenant lean methodology
- Overall (STATE)
- 83 Strongly Landlord-Friendly
- State Oklahoma
- 83 Strongly Landlord-Friendly · R+20
- County
- — inherits STATE
- City
- — inherits STATE
ZIP-level market 74344
- Home prices YoY
- -4.8%
- Active inventory
- 116
- Price-to-rent
- 8.3×
Monthly cashflow live
- Estimated rent
- $1,402 medium interval (Pro) →
- Mortgage (P&I)
- −$734
- Tax from tax record
- −$47 /mo · $562/yr
- Insurance
- −$58
- HOA
- −$36
- Vacancy / Maint / Mgmt
- −$294
- Net cashflow
- $232
Break-even live
UW: 25.0% down · 7.5% · 30yr · 1.5% tax · 5.0% vac · 8.0% maint · 8.0% mgmt
Financing live
Cash to close
- Down payment
- $35,000
- Closing costs
- $4,200
- Reserves months
- —
- Total cash needed
- —
Loan-product check · same deal, 3 products live
Conventional
25% down · 7.5% · 30yr
- Down + closing
- —
- Monthly P&I
- —
- Monthly cashflow
- —
- DSCR
- —
- Eligible?
- —
Personal DTI + credit; lowest rate.
DSCR
20% down · 8.5% · 30yr
- Down + closing
- —
- Monthly P&I
- —
- Monthly cashflow
- —
- DSCR
- —
- Eligible?
- —
No personal income docs; deal must DSCR.
Hard money
10% down · 12.0% · 12mo
- Down + closing
- —
- Monthly P&I
- —
- Monthly cashflow
- —
- DSCR
- —
- Eligible?
- —
Short-term bridge; refi at stabilization.
HOA detail
- Monthly dues
- $36 · $432/yr
Listing history 2 events
-
2026-06-01remarks 63-char remark
-
2026-06-01$140,000 Pending 1 DOM
ⓘ Source: listings_history table (triggers on properties + properties_extension) + one-shot
backfill from property_details.listing_events for pre-trigger history.
Tax reassessment forecast OK · Resets to sale price
- Current annual tax
- $562 · $47/mo
- Projected year-2 tax
- $1,260 · $105/mo
- Expected delta
- +$698/yr (+$58/mo · 124.2%)
ⓘ Screening estimate from a state-policy table — verify with the county assessor before closing.
Climate risk First Street
- Flood 6/10 Major FEMA zone X (unshaded) · 71% chance over 30 yrs
- Wildfire 1/10 Low
- Heat 6/10 Major 7 d/yr ≥111°F today · 21 d/yr by 30 yrs out
- Wind 3/10 Moderate 4% chance of damaging wind over 30 yrs
- Air quality 2/10 Low 1 unhealthy d/yr today · 2 by 30 yrs out
Nearby sold comps map
Loading sold comps map…
Walkable amenities ~0.75 mi
Loading nearby amenities…
Taxation est. · year 1
- Rental income
- $16,826
- − Mortgage interest
- −$7,842
- − Property taxes
- −$562
- − Insurance
- −$700
- − Repairs & maintenance
- −$1,346
- − Management
- −$1,346
- − HOA
- −$432
- − Depreciation
- −$4,073
- Taxable income
- $525
- Est. tax owed @ 24.0%
- −$126
- After-tax cash flow
- $2,663/yr
For passive investors: Depreciation is non-cash, so a rental often shows a tax loss while cash-flowing — sheltering income. Rental losses are passive: they offset passive income freely, and up to $25,000/yr can offset ordinary (W-2) income if you actively participate and your MAGI is under $100k (phasing out to $0 by $150k); unused losses carry forward. On sale, claimed depreciation is recaptured at up to 25%, and gains may owe capital-gains tax (a 1031 exchange can defer both). Figures are a year-1 estimate at your 24.0% rate — not tax advice; consult a CPA.
Schools (NCES district)
- District
- Grove
- NCES district ID
- 4013530
- Math proficiency
- 26% ▼ -14.00%
- Reading proficiency
- 31% ▼ -10.00%
- Median HH income
- $39,379
- Composite
- 23.93/100
- National rank
- #7785
- State rank
- #77 of 270 in OK
Livability — Copeland
- Score
- 61/100
- State rank
- #312
- US rank
- #18050
Category grades
Schools grade is shown separately in the Schools card above.
Census & demographics
- Census place
- Copeland, OK
- Population (ZIP)
- 14,386
Population outlook (Delaware County) Hauer SSP2
- Today (2025)
- 41,302 people
- By 2030
- 40,888 · -1.0%
- By 2040
- 39,802 · -3.6%
- By 2050
- 38,839 · -6.0%
- By 2075
- 37,438 · -9.4%
- By 2100
- 34,910 · -15.5%
Race, ethnicity, and origin ACS 2023
- Neighborhood character
- Predominantly White (74%)
- Race & ethnicity
- White 74% Two or more races 11% Native American 11% Hispanic / Latino 5%
- Common ancestry
- Slovak 2% Iranian 2% Lithuanian 1%
- Foreign-born
- 2% · Canada
- Languages at home
- 97% English-only · Spanish 2%
Political lean MEDSL · Delaware
- 2024 margin
- Solid R (+60.4) · D 19.2% · R 79.6% · Other 1.2%
- 2008→2024 swing
- -26.6pp toward R · 2008: -33.8pp · 2024: -60.4pp
- All cycles
- 2024: R+60.4 2020: R+58.5 2016: R+54.1 2012: R+41.3 2008: R+33.8
Not yet ingested
- Civics
- —
Market trends
- HPI YoY
- ▼ -14.29%
- Current HPI
- 281.8539
- Rent YoY
- —
- Metro
- —
- State GDP YoY
- ▲ 1.55%
- F500 in state
- 6
Industry mix (Fortune 500 HQ in OK)
| Industry | F500 HQs | Revenue |
|---|---|---|
| Energy | 3 | $48B |
|
||
Price history
+102.9% since first listed5 events — show timeline
- 2026-06-01 Pending — MLS Technology, Inc.
- 2026-06-01 Listed $140,000 MLS Technology, Inc.
- 2025-06-05 Sold (MLS) $60,000 MLS Technology, Inc.
- 2025-05-05 Listing Removed — MLS Technology, Inc.
- 2025-05-05 Listed $69,000 MLS Technology, Inc.
Property tax history
+1.8%/yrLatest (2025): $562 · +6.6% YoY. Source: county tax records.
Cash-flow waterfall
monthlySold comps — $/sqft
last 12 mo · ≤1 miLoading sold comps…