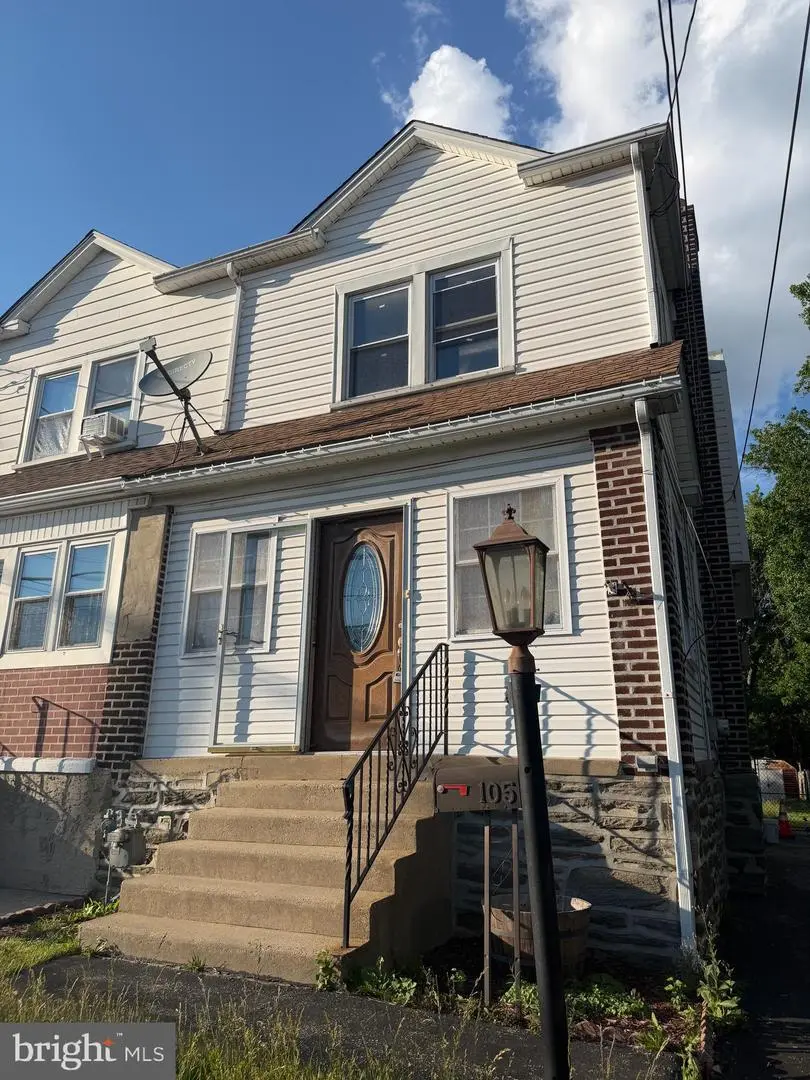
105 S Oak Ave · Aldan, PA
Flood risk 1/10 · Minimal
- FEMA flood zone
- X (unshaded)
- Chance of flooding over 30 yrs
- 0.0%
- Est. flood insurance / yr
- $473 – $860
Fire risk 1/10 · Minimal
- Est. fire insurance / yr
- $511 – $949
Heat risk 6/10 · Moderate
- Hot days now (above 103°F)
- 7 days/yr
- Hot days in 30 yrs
- 15 days/yr
Wind risk 6/10 · Moderate
- Chance of severe wind over 30 yrs
- 27.0%
Air-quality risk 4/10 · Minor
- Unhealthy air days now
- 3 days/yr
- Unhealthy air days in 30 yrs
- 6 days/yr
Risk factors via First Street. Map © Google.
Why this score? — see what drove the B grade
The composite is a weighted blend of 9 inputs, each scored 0–100. Each bar is that input's sub-score; the figure is the points it added to the 100-point composite (weight × sub-score).
- Cash flow +30.0/30.0
- ARV discount +15.0/15.0
- DSCR +10.0/10.0
- 1% rule +8.1/10.0
- Livability +4.2/5.0
- Rent growth +2.9/5.0
- Condition / age +2.5/5.0
- Schools +1.7/10.0
- Appreciation +0.0/10.0
$149,900
🖨 Deal sheet (PDF) 📄 Offer letter ✓ Due diligence
Listing remarks
CALLING ALL INVESTORS! This property is the one you have been waiting for! This one will not last! This Property is being sold As-Is condition. Buyer is responsible for all certifications. Seller never occupied. Neither the seller or listing agent make any representation as to the accuracy of any information contained herein. Buyer must conduct their own due diligence, verification, research and inspections and are relying solely on the results thereof. Buyer to pay all closing costs and transfer tax.
Key facts
- Built 1929
- Listed 12 days
Property features AI
Exterior
- Utilities: Public water; Public sewer
- Home design: End-of-row townhouse; Fee simple ownership
- Construction: Vinyl and aluminum siding; Block foundation; Above-grade and below-grade structures; Built year per assessor
- Exterior features: Lot dimensions approximately 25 x 178; No tidal water
Interior
- Bedrooms: Three bedrooms on the main level
- Bathrooms: One full bathroom on the main level
- Interior features: One fireplace
Neighborhood map
What this means for you Summary
Snapshot
- This is a 3-bed/1.0-bath townhouse listed at $150k.
Deal economics
- At list price, monthly cash flow is $647 ($8k/yr) — positive.
- The deal already cash-flows at list — no discount required.
- Meets the 1% rule at list price ($2k rent vs $150k).
- Cap rate 11.5% vs local median 4.7% in Aldan — top-decile yield for the area; either an underpriced asset or a hidden risk that comps aren't pricing in. Stress-test before assuming the spread holds.
Location & tenants
- Location reads 85/100 on livability (#65 in PA, #463 nationally) — a professional / high-income tenant draw. Strengths: commute A+, employment A+, cost of living A+; Watch: amenities F.
- William Penn SD (suburban): math 11% / reading 28% proficiency, ranked #491 of 539 in PA (top 91%) — low school quality limits family demand, transient renter base, plan for 1-2y turnover; 69% free/reduced lunch — lower-income household profile, screen leases tightly.
- Market conditions: Rents rising (+1.6%/yr); 79 active listings in the ZIP; 38 comparable units currently listed for rent nearby; rentals at typical pace (median 23d on market — plan ~3-4 weeks tenant-placement turnaround); 299 units permitted in Delaware County in 2024 (5 in 5+ unit buildings).
- This rent runs 32% of the median local income ($74k/yr) — at the standard rent-burdened threshold; future hikes will face affordability resistance.
Forward outlook
- Local home prices are declining (-3.0%/yr); year-one equity from $1k of loan paydown is wiped out by about $4k of value loss. Plan a longer hold.
- At projected returns (-3.0% appreciation + 1.6% rent growth), your $42k cash investment doubles in ~8 years — after that, you're playing with house money.
Negotiation context
- Only 13 days on market — expect competitive offers; lowballing is unlikely to land.
Risks & watch-outs
- Watch-outs: built in 1929 — expect roof / HVAC / electrical / plumbing capex.
- Climate carrying-cost: major wind risk, 27% chance of damaging wind over 30y; extreme-heat days projected 7→15/yr by 2055 (HVAC capex compounding) — expect insurance premiums to compound above CPI over the hold.
Questions for the listing agent
- Built in 1929 — when were the roof, HVAC, electrical panel, plumbing, and water heater last replaced?
- Is there a deadline driving the sale (1031 exchange, divorce, estate, relocation)? That informs how much negotiation room exists.
- What's the average days-on-market for RENTAL listings here right now (not sales)? A rising rental-DOM trend means longer vacancies and softer asking-rent achievability than the comps imply.
- What's the recent tenant-quality profile in this submarket — average credit score on applications, eviction rate, late-payment / NSF rate, and stable-employment percentage? A property-management company in the area should have these aggregated.
- How much new for-sale + rental construction is in the pipeline within 1–3 miles? Heavy new supply typically softens prices + rents 12–24 months out; constrained supply supports both.
Investment metrics
- 1% rule
- 1.31% ✓
- Cap rate
- 11.47%
- Cash-on-cash
- 18.49%
- DSCR
- 1.82
- GRM
- 6.4
CMA / ARV
- ARV (on-the-fly)
- $279,416
- Comps found
- 12
Show comp detail 12 sales within ~0.75 mi
| Address | Dist | Beds/Ba | Sqft | Sold | Price | $/sf | Match |
|---|---|---|---|---|---|---|---|
| 614 Rively Ave | 0.09mi | 3/1.0 | 1,152 (-13%) | 1mo | $255,000 | $221 | 74 |
| 751 Rively Ave | 0.27mi | 3/1.0 | 1,152 (-13%) | 1mo | $234,300 | $203 | 66 |
| 103 W Rively Ave | 0.37mi | 3/1.5 | 1,440 (+9%) | 1mo | $285,000 | $198 | 65 |
| 306 Pine St | 0.16mi | 3/2.0 | 1,120 (-15%) | 0mo | $259,000 | $231 | 63 |
| 304 Pine St | 0.17mi | 3/2.0 | 1,120 (-15%) | 2mo | $250,000 | $223 | 61 |
| 129 Shisler Ave | 0.52mi | 3/1.5 | 1,440 (+9%) | 2mo | $305,000 | $212 | 57 |
| 816 Crescent Dr | 0.60mi | 3/1.5 | 1,152 (-13%) | 1mo | $245,000 | $213 | 48 |
| 1117 Tremont Dr | 0.65mi | 3/1.5 | 1,152 (-13%) | 1mo | $150,000 | $130 | 46 |
| 150 W Berkley Ave | 0.72mi | 3/1.5 | 1,152 (-13%) | 1mo | $265,000 | $230 | 43 |
| 517 Chester Ave | 0.69mi | 3/1.5 | 1,152 (-13%) | 2mo | $228,000 | $198 | 43 |
| 1075 Brookwood Ln | 0.74mi | 3/1.5 | 1,152 (-13%) | 0mo | $238,000 | $207 | 42 |
| 139 W Madison Ave | 0.71mi | 3/2.0 | 1,152 (-13%) | 1mo | $225,000 | $195 | 41 |
Match score weights: distance 35% · size 25% · config 20% · recency 20%. Top-matched comps best support the ARV.
Projected returns pro-forma
-3.0% appreciation · 1.65% rent growth · sell at horizon
- IRR
- 8.8%
- Equity multiple
- 1.34×
- Total profit
- $14,216
- Equity at exit
- $22,351
- IRR
- 16.9%
- Equity multiple
- 2.30×
- Total profit
- $54,705
- Equity at exit
- $12,961
Cash invested: $41,972 (down + closing). Projections, not guarantees.
Landlord ↔ Tenant lean methodology
- Overall (STATE)
- 62 Landlord-Friendly
- State Pennsylvania
- 62 Landlord-Friendly · EVEN
- County
- — inherits STATE
- City
- — inherits STATE
ZIP-level market 19018
- Rents YoY
- 1.6%
- Active inventory
- 79
- Price-to-rent
- 6.4×
Monthly cashflow live
- Estimated rent
- $1,961 high interval (Pro) →
- Mortgage (P&I)
- −$786
- Tax from tax record
- −$54 /mo · $644/yr
- Insurance
- −$62
- HOA
- −$0
- Vacancy / Maint / Mgmt
- −$412
- Net cashflow
- $647
Break-even live
Sensitivity live
| Price | -10% $732 | -5% $689 | +0% $647 | +5% $604 | +10% $562 |
|---|---|---|---|---|---|
| Rent | -10% $492 | -5% $569 | +0% $647 | +5% $724 | +10% $802 |
| Rate | -1.0pp $722 | -0.5pp $685 | base $647 | +0.5pp $608 | +1.0pp $568 |
UW: 25.0% down · 7.5% · 30yr · 1.5% tax · 5.0% vac · 8.0% maint · 8.0% mgmt
Financing live
Cash to close
- Down payment
- $37,475
- Closing costs
- $4,497
- Reserves months
- —
- Total cash needed
- —
Loan-product check · same deal, 3 products live
Conventional
25% down · 7.5% · 30yr
- Down + closing
- —
- Monthly P&I
- —
- Monthly cashflow
- —
- DSCR
- —
- Eligible?
- —
Personal DTI + credit; lowest rate.
DSCR
20% down · 8.5% · 30yr
- Down + closing
- —
- Monthly P&I
- —
- Monthly cashflow
- —
- DSCR
- —
- Eligible?
- —
No personal income docs; deal must DSCR.
Hard money
10% down · 12.0% · 12mo
- Down + closing
- —
- Monthly P&I
- —
- Monthly cashflow
- —
- DSCR
- —
- Eligible?
- —
Short-term bridge; refi at stabilization.
Rent comps 38 comps
| Address | Beds | Baths | Sqft | Rent | $/sqft | DOM | Units | Dist |
|---|---|---|---|---|---|---|---|---|
| 100 S Oak Ave Glenolden, PA | 1.0–2.0 | 1.0–2.0 | 830 | $1,500 | $1.81 | 0d | 3 | 0.06mi |
| 306 Pine St Glenolden, PA | 3.0 | 2.0 | 1120 | $2,400 | $2.14 | 5d | 1 | 0.17mi |
| 304 Pine St Glenolden, PA | 3.0 | 2.0 | 1120 | $2,400 | $2.14 | 45d | 1 | 0.17mi |
| 902 Maple Ave Glenolden, PA | 3.0 | 1.0 | 1152 | $1,745 | $1.51 | 45d | 1 | 0.31mi |
| 925 Maple Ave Glenolden, PA | 3.0 | 2.0 | 1152 | $2,800 | $2.43 | 23d | 1 | 0.36mi |
| 1074 N Academy Ave Glenolden, PA | 3.0 | 1.0 | 1152 | $1,850 | $1.61 | 6d | 1 | 0.59mi |
| 201 Westbridge Rd Glenolden, PA | 3.0 | 1.5 | 1224 | $2,350 | $1.92 | 25d | 1 | 0.60mi |
| 304 Christopher Pl Unit 1st Floor Primos, PA | 2.0 | 1.0 | 875 | $1,400 | $1.60 | 4d | 1 | 0.63mi |
| 304 Christopher Pl Primos, PA | 2.0 | 1.0 | 1600 | $1,400 | $0.88 | 6d | 1 | 0.63mi |
| 304 Christopher Pl Unit 1st Floor Primos, PA | 2.0 | 1.0 | 1600 | $1,400 | $0.88 | 0d | 1 | 0.63mi |
| 1072 Tremont Dr Glenolden, PA | 4.0 | 2.0 | 1652 | $2,500 | $1.51 | 6d | 1 | 0.67mi |
| 319 S Church St Clifton Heights, PA | 3.0 | 1.0 | 1152 | $1,900 | $1.65 | 45d | 1 | 0.68mi |
| 116 W Berkley Ave Clifton Heights, PA | 4.0 | 2.0 | 1652 | $2,600 | $1.57 | 45d | 1 | 0.72mi |
| 60 W Broadway Ave Clifton Heights, PA | 3.0 | 1.0 | 1160 | $2,200 | $1.90 | 45d | 1 | 0.78mi |
| 100 S Oak Ave Unit B6 Clifton Heights, PA | 2.0 | 2.0 | 1000 | $1,500 | $1.50 | 25d | 1 | 0.81mi |
| 216 W Washington Ave Clifton Heights, PA | 3.0 | 1.5 | 1152 | $1,875 | $1.63 | 5d | 1 | 0.81mi |
| 225 W Washington Ave Clifton Heights, PA | 3.0 | 1.5 | 1152 | $1,950 | $1.69 | 45d | 1 | 0.84mi |
| 96 E Berkley Ave Clifton Heights, PA | 2.0 | 1.5 | 1352 | $1,850 | $1.37 | 19d | 1 | 0.85mi |
| 151 S Bishop Ave Clifton Heights, PA | 1.0–2.0 | 1.0–2.0 | 875 | $1,989 | $2.27 | 2d | 3 | 0.89mi |
| 640 South Ave Secane, PA | 1.0–2.0 | 1.0–1.5 | 742 | $1,600 | $2.16 | 14d | 5 | 0.93mi |
| 66 Folcroft Ave Folcroft, PA | 3.0 | 1.0 | 1224 | $1,895 | $1.55 | 4d | 1 | 0.97mi |
| 112 Juliana Ter Darby, PA | 3.0 | 1.0 | 1020 | $2,450 | $2.40 | 25d | 1 | 0.99mi |
| 112 Juliana Ter Darby, PA | 3.0 | 1.0 | 1020 | $2,350 | $2.30 | 45d | 1 | 0.99mi |
| 118 Felton Ave Darby, PA | 3.0 | 1.0 | 1152 | $1,750 | $1.52 | 23d | 1 | 1.01mi |
| 312 E Baltimore Ave Clifton Heights, PA | 1.0–2.0 | 1.0 | 812 | $1,649 | $2.03 | 3d | 3 | 1.04mi |
| 132 Folcroft Ave Folcroft, PA | 2.0 | 1.0 | 725 | $1,679 | $2.32 | 3d | 3 | 1.09mi |
| 413 E Baltimore Ave Clifton Heights, PA | 3.0 | 1.0 | 1152 | $1,595 | $1.38 | 25d | 1 | 1.12mi |
| 5238 Fairhaven Rd Clifton Heights, PA | 3.0 | 1.0 | 1152 | $2,000 | $1.74 | 45d | 1 | 1.19mi |
| 145 Isabel Ave Unit 145B Glenolden, PA | 2.0 | 1.0 | 890 | $1,525 | $1.71 | 45d | 1 | 1.25mi |
| 2 Winthrop Rd Darby, PA | 3.0 | 1.5 | 1224 | $1,900 | $1.55 | 23d | 1 | 1.27mi |
| 271 W Wyncliffe Ave Clifton Heights, PA | 3.0 | 1.0 | 1152 | $2,250 | $1.95 | 45d | 1 | 1.28mi |
| 68 Blanchard Rd Drexel Hill, PA | 3.0 | 2.0 | 1088 | $1,950 | $1.79 | 16d | 1 | 1.34mi |
| 1513 Elmwood Ave Unit 4 Folcroft, PA | 3.0 | 1.0 | 1025 | $1,699 | $1.66 | 25d | 1 | 1.37mi |
| 1503 Elmwood Ave Folcroft, PA | 3.0 | 1.0 | 1025 | $1,699 | $1.66 | 25d | 1 | 1.37mi |
| 209 Glenside Ave Unit 1ST FLOOR Holmes, PA | 2.0 | 1.0 | 1872 | $1,600 | $0.85 | 45d | 1 | 1.40mi |
| 202 Green St Holmes, PA | 2.0 | 1.0 | 1560 | $1,700 | $1.09 | 19d | 1 | 1.46mi |
| 100 E Glenolden Ave Glenolden, PA | 1.0–4.0 | 1.0–2.0 | 920 | $2,167 | $2.36 | 0d | 4 | 1.47mi |
| 329 N Oak Ave Clifton Heights, PA | 3.0 | 1.0 | 1152 | $2,300 | $2.00 | 45d | 1 | 1.47mi |
Listing history 9 events
-
2026-06-21days on market $149,900 Active 13 DOM
-
2026-06-18days on market $149,900 Active 10 DOM
-
2026-06-17days on market $149,900 Active 9 DOM
-
2026-06-16days on market $149,900 Active 8 DOM
-
2026-06-15days on market $149,900 Active 7 DOM
-
2026-06-13days on market $149,900 Active 5 DOM
-
2026-06-13days on market $149,900 Active 4 DOM
-
2026-06-08remarks 506-char remark
-
2026-06-08$149,900 Active 1 DOM
ⓘ Source: listings_history table (triggers on properties + properties_extension) + one-shot
backfill from property_details.listing_events for pre-trigger history.
Tax reassessment forecast PA · Partial reset (capped growth)
- Current annual tax
- $644 · $54/mo
- Projected year-2 tax
- $1,506 · $126/mo
- Expected delta
- +$862/yr (+$72/mo · 133.7%)
ⓘ Screening estimate from a state-policy table — verify with the county assessor before closing.
Climate risk First Street
- Flood 1/10 Low FEMA zone X (unshaded) · 0% chance over 30 yrs
- Wildfire 1/10 Low
- Heat 6/10 Major 7 d/yr ≥103°F today · 15 d/yr by 30 yrs out
- Wind 6/10 Major 27% chance of damaging wind over 30 yrs
- Air quality 4/10 Moderate 3 unhealthy d/yr today · 6 by 30 yrs out
Nearby sold comps map
Loading sold comps map…
Walkable amenities ~0.75 mi
Loading nearby amenities…
Taxation est. · year 1
- Rental income
- $23,528
- − Mortgage interest
- −$8,397
- − Property taxes
- −$644
- − Insurance
- −$750
- − Repairs & maintenance
- −$1,882
- − Management
- −$1,882
- − Depreciation
- −$4,361
- Taxable income
- $5,612
- Est. tax owed @ 24.0%
- −$1,347
- After-tax cash flow
- $6,413/yr
For passive investors: Depreciation is non-cash, so a rental often shows a tax loss while cash-flowing — sheltering income. Rental losses are passive: they offset passive income freely, and up to $25,000/yr can offset ordinary (W-2) income if you actively participate and your MAGI is under $100k (phasing out to $0 by $150k); unused losses carry forward. On sale, claimed depreciation is recaptured at up to 25%, and gains may owe capital-gains tax (a 1031 exchange can defer both). Figures are a year-1 estimate at your 24.0% rate — not tax advice; consult a CPA.
Schools (NCES district)
- District
- William Penn SD
- NCES district ID
- 4226390
- Math proficiency
- 11% ▼ -3.00%
- Reading proficiency
- 28% ▼ -7.00%
- Median HH income
- $48,543
- Composite
- 17.29/100
- National rank
- #9086
- State rank
- #491 of 539 in PA
Livability — Aldan
- Score
- 85/100
- State rank
- #65
- US rank
- #463
Category grades
Schools grade is shown separately in the Schools card above.
Census & demographics
- Census place
- Aldan, PA
- County
- Delaware County · 399,863 people
- Metro
- Philadelphia-Camden-Wilmington, PA-NJ-DE-MD
- Population (ZIP)
- 23,505
- Household income
- $73,522
- Rent vs Own
- Severe rent burden
- 770.0
Population outlook (Delaware County) Hauer SSP2
- Today (2025)
- 577,490 people
- By 2030
- 581,243 · +0.6%
- By 2040
- 584,700 · +1.2%
- By 2050
- 586,581 · +1.6%
- By 2075
- 598,706 · +3.7%
- By 2100
- 590,823 · +2.3%
Race, ethnicity, and origin ACS 2023
- Neighborhood character
- Diverse neighborhood (Simpson 0.61)
- Race & ethnicity
- White 55% Black 27% Asian 8% Two or more races 7% Hispanic / Latino 3%
- Common ancestry
- Italian 3% Romanian 3% Lithuanian 1%
- Foreign-born
- 14% · Canada, China, Vietnam
- Languages at home
- 83% English-only · Other Indo-European 5% Spanish 3% Other Asian/Pacific 2%
Political lean MEDSL · Delaware
- 2024 margin
- Strong D (+23.7) · D 61.4% · R 37.6% · Other 1.0%
- 2008→2024 swing
- +2.3pp toward D · 2008: 21.4pp · 2024: 23.7pp
- All cycles
- 2024: D+23.7 2020: D+26.7 2016: D+22.0 2012: D+21.8 2008: D+21.4
Not yet ingested
- Civics
- —
Market trends
- HPI YoY
- ▼ -188.00%
- Current HPI
- 291.1353
- Rent YoY
- ▲ 1.65%
- Metro
- Philadelphia-Camden-Wilmington, PA-NJ-DE-MD
- State GDP YoY
- ▲ 1.68%
- F500 in state
- 34
Industry mix (Fortune 500 HQ in PA)
| Industry | F500 HQs | Revenue |
|---|---|---|
| Healthcare | 2 | $309B |
|
||
| Insurance | 2 | $27B |
|
||
| Telecommunications / Media | 1 | $124B |
|
||
| Industrial Distribution | 1 | $22B |
|
||
| Financial Services | 1 | $20B |
|
||
| Chemicals / Materials | 1 | $18B |
|
||
Price history
+11.0% since first listed2 events — show timeline
- 2026-06-08 Listed $149,900 BRIGHT MLS
- 2025-04-23 Sold (Public Records) $135,000 Public Records
Property tax history
-10.2%/yrLatest (2026): $644 · -86.0% YoY. Source: county tax records.
Cash-flow waterfall
monthlySold comps — $/sqft
last 12 mo · ≤1 miLoading sold comps…