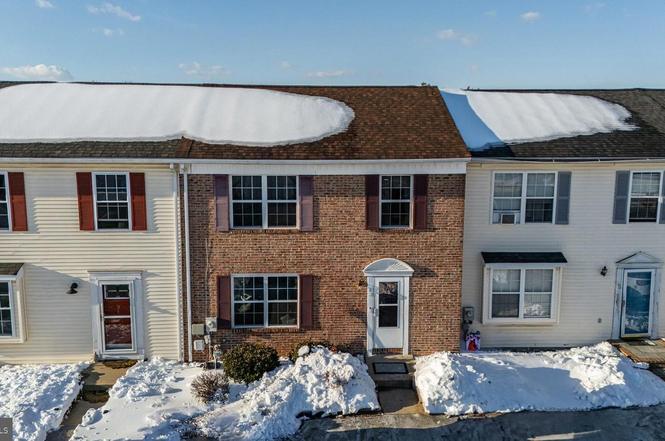
33 Pepperwood Ln · Bear, DE
Flood risk 1/10 · Minimal
- FEMA flood zone
- X (unshaded)
- Chance of flooding over 30 yrs
- 0.0%
- Est. flood insurance / yr
- $473 – $860
Fire risk 1/10 · Minimal
- Est. fire insurance / yr
- $476 – $884
Heat risk 7/10 · Major
- Hot days now (above 102°F)
- 7 days/yr
- Hot days in 30 yrs
- 15 days/yr
Wind risk 6/10 · Moderate
- Chance of severe wind over 30 yrs
- 27.0%
Air-quality risk 4/10 · Minor
- Unhealthy air days now
- 3 days/yr
- Unhealthy air days in 30 yrs
- 5 days/yr
Risk factors via First Street. Map © Google.
Why this score? — see what drove the F grade
The composite is a weighted blend of 9 inputs, each scored 0–100. Each bar is that input's sub-score; the figure is the points it added to the 100-point composite (weight × sub-score).
- Cash flow +12.2/30.0
- Rent growth +4.8/5.0
- Livability +3.7/5.0
- DSCR +3.6/10.0
- ARV discount +2.9/15.0
- 1% rule +2.6/10.0
- Schools +2.5/10.0
- Condition / age +2.5/5.0
- Appreciation +0.0/10.0
$299,000
🖨 Deal sheet (PDF) 📄 Offer letter ✓ Due diligence
Listing remarks MLS
Great Brick front townhome in desireable Bear location, This home features 3 bedrooms 1.5 baths, a finished basement with 2 seperate rooms and a large open kitchen. .. Many recent updates including new berber in the living room and updated kitchen floor, 5 1/4 inch baseboards in the living room, nice slider leading to a deck with fenced in yard. A great house in a great location for under 180k. ..
Key facts
- $8 HOA
- 3 parking spots
- Built 1991
Neighborhood map
What this means for you Summary
Snapshot
- This is a 3-bed/1.5-bath townhouse listed at $299k.
Deal economics
- At list price, monthly cash flow is $-58 ($-699/yr) — negative.
- To cash-flow at today's rent, offer at most $289k (3.4% below list).
- To meet the 1% rule (rent ≥ 1% of price), the offer needs to be $228k (23.9% below list).
- Recommended offer: $228k (23.9% below list) — sets the bar for 1% rule.
- Cap rate 6.1% vs local median 4.7% in Bear — meaningfully above typical; check what's discounted (condition, days-on-market, listing class) to confirm the premium yield is real.
Location & tenants
- Location reads 73/100 on livability (#8 in DE) — a middle-class / working-renter tenant base. Strengths: housing A+, employment A-, cost of living A-; Watch: crime C-, amenities F, commute F.
- Christina School District (suburban): math 22% / reading 33% proficiency, ranked #18 of 26 in DE (top 69%) — low school quality limits family demand, transient renter base, plan for 1-2y turnover.
- Zoned schools: Shue-Medill Middle School (math 21% / reading 30%, grade F, #21 of 36 statewide, top 57%, 808 students, 0% FRL); Christiana High School (math 49% / reading 66%, grade C, #3 of 40 statewide, top 5%, 1,256 students, 0% FRL) — zoned schools average 0% FRL vs 50% district-wide (50 pts lower); this property's tenant base skews higher-income than the district average.
- Zoned-school proficiency averages 42% at this address vs 28% district-wide (+14 pts) — the actual schools serving this property are materially stronger than the Christina School District average implies; a family-tenant draw the district grade alone would hide.
- Market conditions: Rents rising fast (+9.0%/yr); 111 active listings in the ZIP; 16 comparable units currently listed for rent nearby; rentals at typical pace (median 26d on market — plan ~3-4 weeks tenant-placement turnaround); high-income renter base; 1,367 units permitted in New Castle County in 2024 (201 in 5+ unit buildings).
Forward outlook
- Local home prices are declining (-3.0%/yr); year-one equity from $2k of loan paydown is wiped out by about $9k of value loss. Plan a longer hold.
- New Castle County population projected at +9% by 2050 — modest demand growth; plan on rents tracking national, not racing it.
Negotiation context
- Only 10 days on market — expect competitive offers; lowballing is unlikely to land.
- 3 sale attempts since 21y ago with the ask held roughly flat each time — persistent listings suggest the price (not the market) is what's stuck; bring a comps-based counter.
- Current owner paid $175k; list at $299k implies a 71% gain — meaningful room to come down on a strong offer.
Risks & watch-outs
- Climate carrying-cost: major wind risk, 27% chance of damaging wind over 30y; extreme-heat days projected 7→15/yr by 2055 (HVAC capex compounding) — expect insurance premiums to compound above CPI over the hold.
Questions for the listing agent
- What do current leases actually rent for vs. the listed asking? Can we see a recent rent roll and the last 12 months of T-12 income?
- What does the HOA fee cover, when was the last increase, and are there any pending special assessments or reserve-fund shortfalls?
- Is there a deadline driving the sale (1031 exchange, divorce, estate, relocation)? That informs how much negotiation room exists.
- Schools are D-rated, which usually means shorter tenancies and higher turnover. Who's the typical renter profile here, and what's been the actual vacancy rate?
- The area grade is low — what's the realistic commute time and amenity access for the typical tenant pool here? Any planned neighborhood developments (good or bad) we should know about?
- What's the average days-on-market for RENTAL listings here right now (not sales)? A rising rental-DOM trend means longer vacancies and softer asking-rent achievability than the comps imply.
- What's the recent tenant-quality profile in this submarket — average credit score on applications, eviction rate, late-payment / NSF rate, and stable-employment percentage? A property-management company in the area should have these aggregated.
- How much new for-sale + rental construction is in the pipeline within 1–3 miles? Heavy new supply typically softens prices + rents 12–24 months out; constrained supply supports both.
Investment metrics
- 1% rule
- 0.76% ✗
- Cap rate
- 6.06%
- Cash-on-cash
- -0.83%
- DSCR
- 0.96
- GRM
- 10.9
CMA / ARV
- ARV (on-the-fly)
- $271,400
- Comps found
- 12
Show comp detail 12 sales within ~0.75 mi
| Address | Dist | Beds/Ba | Sqft | Sold | Price | $/sf | Match |
|---|---|---|---|---|---|---|---|
| 1 Silktree Ct | 0.07mi | 3/1.5 | 1,150 (0%) | 5mo | $310,500 | $270 | 93 |
| 1 Sequoia Ct | 0.05mi | 3/1.5 | 1,250 (+9%) | 5mo | $305,000 | $244 | 79 |
| 6 Ross | 0.48mi | 2/1.5 (-1) | 1,125 (-2%) | 1mo | $265,000 | $236 | 69 |
| 308 Palmerston Ct | 0.38mi | 2/2.5 (-1) | 1,150 (0%) | 6mo | $280,000 | $243 | 68 |
| 3 Warren Pl | 0.54mi | 2/1.5 (-1) | 1,125 (-2%) | 1mo | $268,500 | $239 | 66 |
| 27 Stephanie Dr | 0.12mi | 3/2.5 | 1,300 (+13%) | 9mo | $250,000 | $192 | 61 |
| 3 Arnold Pl | 0.48mi | 2/2.5 (-1) | 1,175 (+2%) | 9mo | $261,000 | $222 | 58 |
| 8 Revere Pl | 0.45mi | 2/2.5 (-1) | 1,200 (+4%) | 9mo | $274,000 | $228 | 55 |
| 11 Schuyler Ct | 0.48mi | 2/1.5 (-1) | 1,256 (+9%) | 4mo | $270,000 | $215 | 54 |
| 29 Victoria Blvd | 0.36mi | 2/1.5 (-1) | 1,300 (+13%) | 6mo | $278,000 | $214 | 51 |
| 3 Ross Ct | 0.47mi | 2/1.5 (-1) | 1,256 (+9%) | 8mo | $260,000 | $207 | 51 |
| 18 S Merriment Dr | 0.64mi | 3/2.5 | 1,275 (+11%) | 9mo | $310,000 | $243 | 41 |
Match score weights: distance 35% · size 25% · config 20% · recency 20%. Top-matched comps best support the ARV.
Projected returns pro-forma
-3.0% appreciation · 8.0% rent growth · sell at horizon
- IRR
- -12.8%
- Equity multiple
- 0.52×
- Total profit
- $-40,222
- Equity at exit
- $44,582
- IRR
- 2.0%
- Equity multiple
- 1.17×
- Total profit
- $14,574
- Equity at exit
- $25,852
Cash invested: $83,720 (down + closing). Projections, not guarantees.
Landlord ↔ Tenant lean methodology
- Overall (STATE)
- 70 Landlord-Friendly
- State Delaware
- 70 Landlord-Friendly · D+7
- County
- — inherits STATE
- City
- — inherits STATE
ZIP-level market 19701
- Rents YoY
- 9.0%
- Active inventory
- 111
- Price-to-rent
- 10.9×
Monthly cashflow live
- Estimated rent
- $2,277 high interval (Pro) →
- Mortgage (P&I)
- −$1,568
- Tax from tax record
- −$156 /mo · $1,873/yr
- Insurance
- −$125
- HOA
- −$8
- Vacancy / Maint / Mgmt
- −$478
- Net cashflow
- $-58
Break-even live
Sensitivity live
| Price | -10% $111 | -5% $26 | +0% $-58 | +5% $-143 | +10% $-227 |
|---|---|---|---|---|---|
| Rent | -10% $-238 | -5% $-148 | +0% $-58 | +5% $32 | +10% $122 |
| Rate | -1.0pp $92 | -0.5pp $18 | base $-58 | +0.5pp $-136 | +1.0pp $-215 |
UW: 25.0% down · 7.5% · 30yr · 1.5% tax · 5.0% vac · 8.0% maint · 8.0% mgmt
Financing live
Cash to close
- Down payment
- $74,750
- Closing costs
- $8,970
- Reserves months
- —
- Total cash needed
- —
Loan-product check · same deal, 3 products live
Conventional
25% down · 7.5% · 30yr
- Down + closing
- —
- Monthly P&I
- —
- Monthly cashflow
- —
- DSCR
- —
- Eligible?
- —
Personal DTI + credit; lowest rate.
DSCR
20% down · 8.5% · 30yr
- Down + closing
- —
- Monthly P&I
- —
- Monthly cashflow
- —
- DSCR
- —
- Eligible?
- —
No personal income docs; deal must DSCR.
Hard money
10% down · 12.0% · 12mo
- Down + closing
- —
- Monthly P&I
- —
- Monthly cashflow
- —
- DSCR
- —
- Eligible?
- —
Short-term bridge; refi at stabilization.
Rent comps 16 comps
| Address | Beds | Baths | Sqft | Rent | $/sqft | DOM | Units | Dist |
|---|---|---|---|---|---|---|---|---|
| 525 Blackbird Dr Bear, DE | 3.0 | 1.5 | 1150 | $2,100 | $1.83 | 45d | 1 | 0.08mi |
| 9000 Rembrandt Cir Newark, DE | 1.0–2.0 | 1.0–2.0 | 855 | $1,772 | $2.07 | 23d | 1 | 0.46mi |
| 4 Arnold Pl Newark, DE | 2.0 | 2.5 | 1225 | $2,500 | $2.04 | 45d | 1 | 0.47mi |
| 13 Farland Way Newark, DE | 3.0 | 1.5 | 1175 | $2,100 | $1.79 | 6d | 1 | 0.51mi |
| 13 Farland Way Newark, DE | 3.0 | 2.0 | 1175 | $2,100 | $1.79 | 25d | 1 | 0.51mi |
| 104 Sandburg Pl Newark, DE | 3.0 | 2.0 | 1368 | $1,889 | $1.38 | 45d | 1 | 0.69mi |
| 104 Sandburg Pl Newark, DE | 2.0 | 2.0 | 1080 | $1,659 | $1.54 | 14d | 1 | 0.69mi |
| 35 Honeysuckle Dr Newark, DE | 3.0 | 1.5 | 1250 | $2,400 | $1.92 | 18d | 1 | 0.76mi |
| 13 Honeysuckle Dr Newark, DE | 3.0 | 2.0 | 1300 | $2,300 | $1.77 | 45d | 1 | 0.86mi |
| 100 N Barrett Ln Newark, DE | 2.0–3.0 | 2.5 | 1430 | $2,550 | $1.78 | 0d | 2 | 0.86mi |
| 1704 Barnaby St Newark, DE | 3.0 | 2.5 | 1375 | $1,845 | $1.34 | 45d | 1 | 1.15mi |
| 182 Darling St Newark, DE | 3.0 | 2.5 | 1345 | $2,450 | $1.82 | 45d | 1 | 1.23mi |
| 270 Brandywine Dr Bear, DE | 1.0–2.0 | 1.0–2.0 | 1015 | $2,295 | $2.26 | 0d | 1 | 1.25mi |
| 816 Lawrence Dr Newark, DE | 2.0 | 1.0–2.0 | 636 | $1,802 | $2.83 | 0d | 9 | 1.28mi |
| 325 Barley Dr Newark, DE | 2.0 | 1.5 | 1000 | $1,675 | $1.68 | 25d | 1 | 1.31mi |
| 157 Channing Dr Bear, DE | 3.0 | 1.5 | 1075 | $1,960 | $1.82 | 6d | 1 | 1.37mi |
HOA detail
- Monthly dues
- $8 · $96/yr
Listing history 10 events
-
2026-03-18status Pending
-
2026-03-09$299,000 Active
-
2026-03-06historical $299,000
-
2006-08-02soldstatus $175,000
-
2006-07-28soldstatus $175,000 400-char remark
Show marketing remark (400 chars)
Great Brick front townhome in desireable Bear location, This home features 3 bedrooms 1.5 baths, a finished basement with 2 seperate rooms and a large open kitchen. .. Many recent updates including new berber in the living room and updated kitchen floor, 5 1/4 inch baseboards in the living room, nice slider leading to a deck with fenced in yard. A great house in a great location for under 180k. ..
-
2006-06-01historical 400-char remark
Show marketing remark (400 chars)
Great Brick front townhome in desireable Bear location, This home features 3 bedrooms 1.5 baths, a finished basement with 2 seperate rooms and a large open kitchen. .. Many recent updates including new berber in the living room and updated kitchen floor, 5 1/4 inch baseboards in the living room, nice slider leading to a deck with fenced in yard. A great house in a great location for under 180k. ..
-
2006-04-30$175,000 400-char remark
Show marketing remark (400 chars)
Great Brick front townhome in desireable Bear location, This home features 3 bedrooms 1.5 baths, a finished basement with 2 seperate rooms and a large open kitchen. .. Many recent updates including new berber in the living room and updated kitchen floor, 5 1/4 inch baseboards in the living room, nice slider leading to a deck with fenced in yard. A great house in a great location for under 180k. ..
-
2005-06-30soldstatus $160,000 221-char remark
Show marketing remark (221 chars)
Perfect brick front townhome with new carpet, deck, shed, three upper level bedrooms and a finished basement. Perfect location and condition. Upgraded kitchen, first floor powder room, fenced yard and the list goes on. ..
-
2005-06-06$160,000 221-char remark
Show marketing remark (221 chars)
Perfect brick front townhome with new carpet, deck, shed, three upper level bedrooms and a finished basement. Perfect location and condition. Upgraded kitchen, first floor powder room, fenced yard and the list goes on. ..
-
1992-12-01soldstatus $81,990
ⓘ Source: listings_history table (triggers on properties + properties_extension) + one-shot
backfill from property_details.listing_events for pre-trigger history.
Tax reassessment forecast DE · Partial reset (capped growth)
- Current annual tax
- $1,873 · $156/mo
- Projected year-2 tax
- $1,873 · $156/mo
- Expected delta
- $0/yr ($0/mo · 0.0%)
ⓘ Screening estimate from a state-policy table — verify with the county assessor before closing.
Climate risk First Street
- Flood 1/10 Low FEMA zone X (unshaded) · 0% chance over 30 yrs
- Wildfire 1/10 Low
- Heat 7/10 Severe 7 d/yr ≥102°F today · 15 d/yr by 30 yrs out
- Wind 6/10 Major 27% chance of damaging wind over 30 yrs
- Air quality 4/10 Moderate 3 unhealthy d/yr today · 5 by 30 yrs out
Nearby sold comps map
Loading sold comps map…
Walkable amenities ~0.75 mi
Loading nearby amenities…
Taxation est. · year 1
- Rental income
- $27,318
- − Mortgage interest
- −$16,749
- − Property taxes
- −$1,873
- − Insurance
- −$1,495
- − Repairs & maintenance
- −$2,185
- − Management
- −$2,185
- − HOA
- −$96
- − Depreciation
- −$8,698
- Taxable loss
- −$5,964
- Est. tax savings @ 24.0%
- +$1,431
- After-tax cash flow
- $733/yr
For passive investors: Depreciation is non-cash, so a rental often shows a tax loss while cash-flowing — sheltering income. Rental losses are passive: they offset passive income freely, and up to $25,000/yr can offset ordinary (W-2) income if you actively participate and your MAGI is under $100k (phasing out to $0 by $150k); unused losses carry forward. On sale, claimed depreciation is recaptured at up to 25%, and gains may owe capital-gains tax (a 1031 exchange can defer both). Figures are a year-1 estimate at your 24.0% rate — not tax advice; consult a CPA.
Schools (NCES district)
- District
- Christina School District
- NCES district ID
- 1000200
- Math proficiency
- 22% ▼ -12.00%
- Reading proficiency
- 33% ▼ -5.00%
- Median HH income
- $58,838
- Composite
- 24.93/100
- National rank
- #7567
- State rank
- #18 of 26 in DE
Livability — Bear
- Score
- 73/100
- State rank
- #8
- US rank
- #5158
Category grades
Schools grade is shown separately in the Schools card above.
Census & demographics
- County
- New Castle County · 483,412 people
- City population
- 42,984
- Metro
- Philadelphia-Camden-Wilmington, PA-NJ-DE-MD
- Population (ZIP)
- 42,984
- Household income
- $111,198
- Rent vs Own
- Severe rent burden
- 619.0
Population outlook (New Castle County) Hauer SSP2
- Today (2025)
- 594,686 people
- By 2030
- 609,164 · +2.4%
- By 2040
- 632,154 · +6.3%
- By 2050
- 649,068 · +9.1%
- By 2075
- 687,771 · +15.7%
- By 2100
- 694,961 · +16.9%
Race, ethnicity, and origin ACS 2023
- Neighborhood character
- Diverse neighborhood (Simpson 0.67)
- Race & ethnicity
- White 50% Black 26% Hispanic / Latino 11% Asian 10% Two or more races 7%
- Hispanic origin (detail)
- Mexican 4% Puerto Rican 4%
- Common ancestry
- Romanian 4% Lithuanian 2% Slovak 1%
- Foreign-born
- 17% · Canada, China, Vietnam
- Languages at home
- 78% English-only · Spanish 8% Other Asian/Pacific 3% Other Indo-European 3%
Political lean MEDSL · New Castle
- 2024 margin
- Solid D (+32.6) · D 65.5% · R 32.9% · Other 1.6%
- 2008→2024 swing
- -8.1pp toward R · 2008: 40.6pp · 2024: 32.6pp
- All cycles
- 2024: D+32.6 2020: D+37.1 2016: D+29.6 2012: D+34.1 2008: D+40.6
Not yet ingested
- Civics
- —
Market trends
- HPI YoY
- ▼ -159.00%
- Current HPI
- 261.2988
- Rent YoY
- ▲ 9.03%
- Metro
- Philadelphia-Camden-Wilmington, PA-NJ-DE-MD
- State GDP YoY
- —
- F500 in state
- 0
Price history
+264.7% since first listed10 events — show timeline
- 2026-03-18 Pending — BRIGHT MLS
- 2026-03-09 Listed $299,000 BRIGHT MLS
- 2026-03-06 Coming Soon $299,000 BRIGHT MLS
- 2006-08-02 Sold (Public Records) $175,000 Public Records
- 2006-07-28 Sold (MLS) $175,000 BRIGHT MLS
- 2006-06-01 Listing Removed — BRIGHT MLS
- 2006-04-30 Listed $175,000 BRIGHT MLS
- 2005-06-30 Sold (MLS) $160,000 BRIGHT MLS
- 2005-06-06 Listed $160,000 BRIGHT MLS
- 1992-12-01 Sold (Public Records) $81,990 Public Records
Property tax history
+1.5%/yrLatest (2024): $1,873 · +3.4% YoY. Source: county tax records.
Cash-flow waterfall
monthlySold comps — $/sqft
last 12 mo · ≤1 miLoading sold comps…