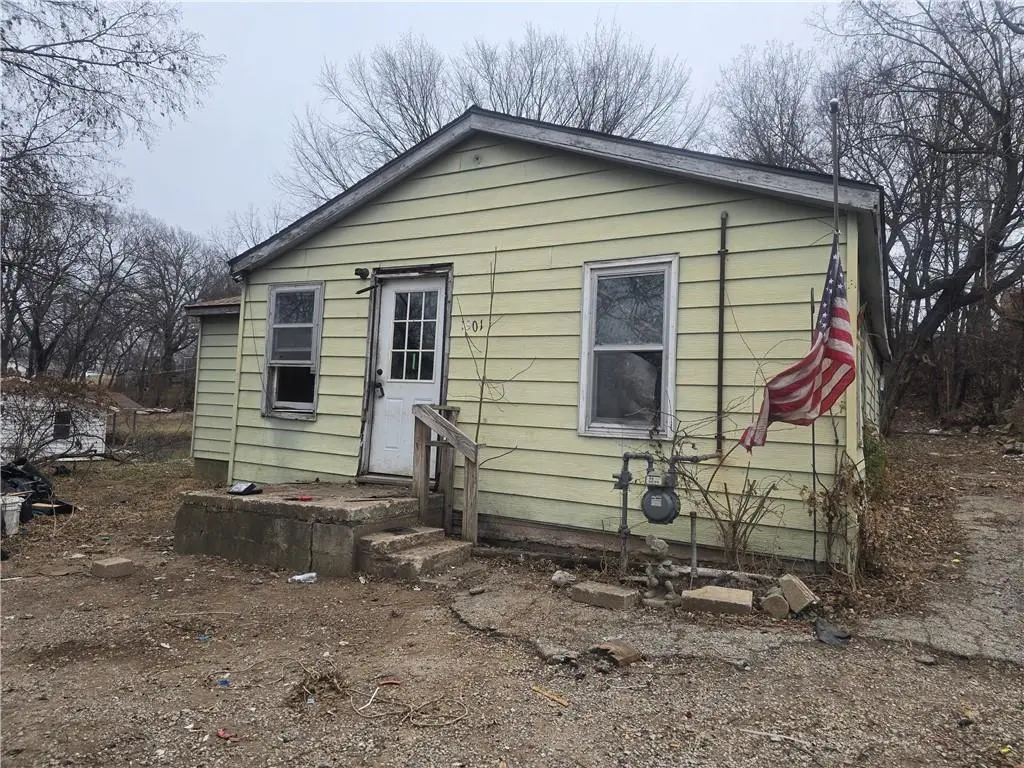
1901 Spring St · Blue Summit, MO
Flood risk 1/10 · Minimal
- FEMA flood zone
- X (unshaded)
- Chance of flooding over 30 yrs
- 0.0%
- Est. flood insurance / yr
- $507 – $1,088
Fire risk 1/10 · Minimal
- Est. fire insurance / yr
- $1,054 – $1,958
Heat risk 4/10 · Minor
- Hot days now (above 106°F)
- 7 days/yr
- Hot days in 30 yrs
- 15 days/yr
Wind risk 2/10 · Minimal
- Chance of severe wind over 30 yrs
- —
Air-quality risk 3/10 · Minor
- Unhealthy air days now
- 2 days/yr
- Unhealthy air days in 30 yrs
- 3 days/yr
Risk factors via First Street. Map © Google.
Why this score? — see what drove the C- grade
The composite is a weighted blend of 9 inputs, each scored 0–100. Each bar is that input's sub-score; the figure is the points it added to the 100-point composite (weight × sub-score).
- Cash flow +15.0/30.0
- Appreciation +10.0/10.0
- ARV discount +7.5/15.0
- 1% rule +5.0/10.0
- DSCR +5.0/10.0
- Schools +2.7/10.0
- Rent growth +2.5/5.0
- Livability +2.5/5.0
- Condition / age +2.5/5.0
$25,900
🖨 Deal sheet (PDF) 📄 Offer letter ✓ Due diligence
Listing remarks MLS
INVESTOR SPECIAL! Looking for a good rehab project this is it, turn this house into whatever you dream. 4 bedrooms! Huge backyard, Newer Roof, all on one level. Endless possibilities!
Key facts
- 9,485 sq ft lot
- Built 1953
- Listed 169 days
Neighborhood map
What this means for you Summary
Snapshot
- This is a 4-bed/1.0-bath single-family listed at $26k.
Deal economics
- At list price, monthly cash flow is $906 ($11k/yr) — positive.
- The deal already cash-flows at list — no discount required.
- Meets the 1% rule at list price ($1k rent vs $26k).
- Recommended offer: $23k (12.0% below list) — sets the bar for market timing.
Location & tenants
- Location reads: area grade C — affects rentability + tenant quality, not the cash-flow math above.
- Independence 30 (suburban): math 26% / reading 38% proficiency, ranked #252 of 324 in MO (top 78%) — families likely to look elsewhere, expect single-tenant / working-renter base with shorter leases.
- Market conditions: 22 active listings in the ZIP; 3 comparable units currently listed for rent nearby; rentals at typical pace (median 25d on market — plan ~3-4 weeks tenant-placement turnaround); 4,002 units permitted in Jackson County in 2024 (2,271 in 5+ unit buildings).
Forward outlook
- In year one you build about $3k of equity ($179 loan paydown + $3k appreciation (10.0% local appreciation)).
- Jackson County population projected at +4% by 2050 — modest demand growth; plan on rents tracking national, not racing it.
- At projected returns (10.0% appreciation + 3.0% rent growth), your $7k cash investment doubles in ~1 year — after that, you're playing with house money.
- By year 10, paydown + projected appreciation supports a ~$34k cash-out refi (75% LTV) — recoverable capital for the next deal without selling this one.
Negotiation context
- It's been on market 170 days — a 12% lower offer ($23k) is reasonable based on typical stale-listing flexibility.
- 5 sale attempts since 2y ago; this cycle's ask has dropped $14k (35%) from the opening price — seller is motivated, your offer sets the floor, not the list.
Risks & watch-outs
- Watch-outs: built in 1953 — expect roof / HVAC / electrical / plumbing capex.
Questions for the listing agent
- It's been on market 170 days. Have you received any prior offers? Is the seller open to a 12% concession, seller financing, or rate buy-down credit?
- Built in 1953 — when were the roof, HVAC, electrical panel, plumbing, and water heater last replaced?
- Why hasn't it sold? Are there any deal-killer items the seller is aware of (foundation, flood, title, zoning, code violations)?
- Is there a deadline driving the sale (1031 exchange, divorce, estate, relocation)? That informs how much negotiation room exists.
- What's the average days-on-market for RENTAL listings here right now (not sales)? A rising rental-DOM trend means longer vacancies and softer asking-rent achievability than the comps imply.
- What's the recent tenant-quality profile in this submarket — average credit score on applications, eviction rate, late-payment / NSF rate, and stable-employment percentage? A property-management company in the area should have these aggregated.
- How much new for-sale + rental construction is in the pipeline within 1–3 miles? Heavy new supply typically softens prices + rents 12–24 months out; constrained supply supports both.
Investment metrics
- 1% rule
- 5.38% ✓
- Cap rate
- 48.28%
- Cash-on-cash
- 149.96%
- DSCR
- 7.67
- GRM
- 1.5
CMA / ARV
- ARV (median comp)
- $123,798
- List price
- $25,900
- Delta
- -79.08%
- Verdict
- UNDERPRICED
- Comps
- 6 within 1.0 mi
Show comp detail 1 sale within ~0.75 mi
| Address | Dist | Beds/Ba | Sqft | Sold | Price | $/sf | Match |
|---|---|---|---|---|---|---|---|
| 1733 Corrington Ave | 0.75mi | 3/1.0 (-1) | 975 (+5%) | 15mo | $100,000 | $103 | 40 |
Match score weights: distance 35% · size 25% · config 20% · recency 20%. Top-matched comps best support the ARV.
Projected returns pro-forma
10.0% appreciation · 3.0% rent growth · sell at horizon
- IRR
- —
- Equity multiple
- 10.91×
- Total profit
- $71,858
- Equity at exit
- $23,333
- IRR
- —
- Equity multiple
- 23.93×
- Total profit
- $166,277
- Equity at exit
- $50,318
Cash invested: $7,252 (down + closing). Projections, not guarantees.
Landlord ↔ Tenant lean methodology
- Overall (STATE)
- 81 Strongly Landlord-Friendly
- State Missouri
- 81 Strongly Landlord-Friendly · R+10
- County
- — inherits STATE
- City
- — inherits STATE
ZIP-level market 64126
- Active inventory
- 22
- Price-to-rent
- 1.5×
Monthly cashflow live
- Estimated rent
- $1,393 medium interval (Pro) →
- Mortgage (P&I)
- −$136
- Tax from tax record
- −$47 /mo · $569/yr
- Insurance
- −$11
- HOA
- −$0
- Vacancy / Maint / Mgmt
- −$292
- Net cashflow
- $906
Break-even live
Sensitivity live
| Price | -10% $921 | -5% $914 | +0% $906 | +5% $899 | +10% $892 |
|---|---|---|---|---|---|
| Rent | -10% $796 | -5% $851 | +0% $906 | +5% $961 | +10% $1,016 |
| Rate | -1.0pp $919 | -0.5pp $913 | base $906 | +0.5pp $900 | +1.0pp $893 |
UW: 25.0% down · 7.5% · 30yr · 1.5% tax · 5.0% vac · 8.0% maint · 8.0% mgmt
Financing live
Cash to close
- Down payment
- $6,475
- Closing costs
- $777
- Reserves months
- —
- Total cash needed
- —
Loan-product check · same deal, 3 products live
Conventional
25% down · 7.5% · 30yr
- Down + closing
- —
- Monthly P&I
- —
- Monthly cashflow
- —
- DSCR
- —
- Eligible?
- —
Personal DTI + credit; lowest rate.
DSCR
20% down · 8.5% · 30yr
- Down + closing
- —
- Monthly P&I
- —
- Monthly cashflow
- —
- DSCR
- —
- Eligible?
- —
No personal income docs; deal must DSCR.
Hard money
10% down · 12.0% · 12mo
- Down + closing
- —
- Monthly P&I
- —
- Monthly cashflow
- —
- DSCR
- —
- Eligible?
- —
Short-term bridge; refi at stabilization.
Rent comps 3 comps
| Address | Beds | Baths | Sqft | Rent | $/sqft | DOM | Units | Dist |
|---|---|---|---|---|---|---|---|---|
| 1704 S Brookside Ave Independence, MO | 4.0 | 1.0 | 834 | $1,450 | $1.74 | 16d | 1 | 0.91mi |
| 2702 S Glenwood Ave Independence, MO | 3.0 | 1.0 | 1056 | $1,555 | $1.47 | 25d | 1 | 1.21mi |
| 9528 E Winner Rd Independence, MO | 1.0–3.0 | 1.0 | 730 | $1,099 | $1.51 | 45d | 1 | 1.32mi |
Listing history 29 events
-
2026-06-21days on market $25,900 Active 170 DOM
-
2026-06-18days on market $25,900 Active 167 DOM
-
2026-06-17days on market $25,900 Active 166 DOM
-
2026-06-16days on market $25,900 Active 165 DOM
-
2026-06-15days on market $25,900 Active 164 DOM
-
2026-06-13days on market $25,900 Active 162 DOM
-
2026-06-09days on market $25,900 Active 158 DOM
-
2026-06-08days on market $25,900 Active 157 DOM
-
2026-06-07days on market $25,900 Active 156 DOM
-
2026-06-05days on market $25,900 Active 153 DOM
-
2026-06-03days on market $25,900 Active 152 DOM
-
2026-06-02days on market $25,900 Active 151 DOM
-
2026-06-01days on market $25,900 Active 150 DOM
-
2026-05-31days on market $25,900 Active 149 DOM
-
2026-04-07price $25,900 185-char remark
Show marketing remark (185 chars)
INVESTOR SPECIAL! Looking for a good rehab project this is it, turn this house into whatever you dream. 4 bedrooms! Huge backyard, Newer Roof, all on one level. Endless possibilities!
-
2026-02-10price $28,900 185-char remark
Show marketing remark (185 chars)
INVESTOR SPECIAL! Looking for a good rehab project this is it, turn this house into whatever you dream. 4 bedrooms! Huge backyard, Newer Roof, all on one level. Endless possibilities!
-
2026-01-07price $33,900 185-char remark
Show marketing remark (185 chars)
INVESTOR SPECIAL! Looking for a good rehab project this is it, turn this house into whatever you dream. 4 bedrooms! Huge backyard, Newer Roof, all on one level. Endless possibilities!
-
2026-01-02$39,900 Active 185-char remark
Show marketing remark (185 chars)
INVESTOR SPECIAL! Looking for a good rehab project this is it, turn this house into whatever you dream. 4 bedrooms! Huge backyard, Newer Roof, all on one level. Endless possibilities!
-
2025-09-02historical
-
2025-02-17price $39,900
-
2025-01-07$44,900 Active
-
2024-12-11soldstatus Closed
-
2024-11-14status Pending
-
2024-11-13status Active
-
2024-10-24status Pending
-
2024-10-21status Active
-
2024-09-20status Pending
-
2024-09-04$12,900 Active
-
1994-09-15soldstatus
ⓘ Source: listings_history table (triggers on properties + properties_extension) + one-shot
backfill from property_details.listing_events for pre-trigger history.
Tax reassessment forecast MO · Resets to sale price
- Current annual tax
- $569 · $47/mo
- Projected year-2 tax
- $569 · $47/mo
- Expected delta
- $0/yr ($0/mo · 0.0%)
ⓘ Screening estimate from a state-policy table — verify with the county assessor before closing.
Climate risk First Street
- Flood 1/10 Low FEMA zone X (unshaded) · 0% chance over 30 yrs
- Wildfire 1/10 Low
- Heat 4/10 Moderate 7 d/yr ≥106°F today · 15 d/yr by 30 yrs out
- Wind 2/10 Low
- Air quality 3/10 Moderate 2 unhealthy d/yr today · 3 by 30 yrs out
Nearby sold comps map
Loading sold comps map…
Walkable amenities ~0.75 mi
Loading nearby amenities…
Taxation est. · year 1
- Rental income
- $16,713
- − Mortgage interest
- −$1,451
- − Property taxes
- −$569
- − Insurance
- −$130
- − Repairs & maintenance
- −$1,337
- − Management
- −$1,337
- − Depreciation
- −$753
- Taxable income
- $11,137
- Est. tax owed @ 24.0%
- −$2,673
- After-tax cash flow
- $8,203/yr
For passive investors: Depreciation is non-cash, so a rental often shows a tax loss while cash-flowing — sheltering income. Rental losses are passive: they offset passive income freely, and up to $25,000/yr can offset ordinary (W-2) income if you actively participate and your MAGI is under $100k (phasing out to $0 by $150k); unused losses carry forward. On sale, claimed depreciation is recaptured at up to 25%, and gains may owe capital-gains tax (a 1031 exchange can defer both). Figures are a year-1 estimate at your 24.0% rate — not tax advice; consult a CPA.
Schools (NCES district)
- District
- Independence 30
- NCES district ID
- 2915480
- Math proficiency
- 26% ▼ -8.00%
- Reading proficiency
- 38% ▼ -5.00%
- Median HH income
- $41,843
- Composite
- 27.04/100
- National rank
- #7054
- State rank
- #252 of 324 in MO
Livability — Blue Summit
No livability data for this city. (Only ~50 U.S. cities are tracked.)
Census & demographics
- Census place
- Blue Summit, MO
- City population
- 439,467
- Population (ZIP)
- 6,433
Population outlook (Jackson County) Hauer SSP2
- Today (2025)
- 719,589 people
- By 2030
- 731,456 · +1.6%
- By 2040
- 746,689 · +3.8%
- By 2050
- 749,289 · +4.1%
- By 2075
- 736,227 · +2.3%
- By 2100
- 668,210 · -7.1%
Race, ethnicity, and origin ACS 2023
- Neighborhood character
- Diverse neighborhood (Simpson 0.62)
- Race & ethnicity
- Hispanic / Latino 57% Two or more races 29% White 19% Black 14% Asian 3% Native American 2%
- Hispanic origin (detail)
- Mexican 38% Cuban 4%
- Common ancestry
- Slovak 2% Iranian 1% Lithuanian 1%
- Foreign-born
- 36% · Canada
- Languages at home
- 44% English-only · Spanish 50% Vietnamese 1%
Political lean MEDSL · Jackson
- 2024 margin
- D (+19.3) · D 58.9% · R 39.5% · Other 1.6%
- 2008→2024 swing
- -6.1pp toward R · 2008: 25.4pp · 2024: 19.3pp
- All cycles
- 2024: D+19.3 2020: D+22.0 2016: D+16.6 2012: D+19.0 2008: D+25.4
Not yet ingested
- Civics
- —
Market trends
- HPI YoY
- ▲ 100.10%
- Current HPI
- 369.8782
- Rent YoY
- —
- Metro
- —
- State GDP YoY
- ▲ 1.84%
- F500 in state
- 20
Industry mix (Fortune 500 HQ in MO)
| Industry | F500 HQs | Revenue |
|---|---|---|
| Healthcare | 1 | $163B |
|
||
| Insurance | 1 | $21B |
|
||
| Industrial Technology | 1 | $17B |
|
||
| Retail | 1 | $16B |
|
||
| Industrial Distribution | 1 | $10B |
|
||
| Utilities | 1 | $9B |
|
||
Price history
+100.8% since first listed15 events — show timeline
- 2026-04-07 Price Changed $25,900 Heartland MLS as Distributed by MLS Grid
- 2026-02-10 Price Changed $28,900 Heartland MLS as Distributed by MLS Grid
- 2026-01-07 Price Changed $33,900 Heartland MLS as Distributed by MLS Grid
- 2026-01-02 Listed $39,900 Heartland MLS as Distributed by MLS Grid
- 2025-09-02 Listing Removed — Heartland MLS as Distributed by MLS Grid
- 2025-02-17 Price Changed $39,900 Heartland MLS as Distributed by MLS Grid
- 2025-01-07 Listed $44,900 Heartland MLS as Distributed by MLS Grid
- 2024-12-11 Sold (MLS) — Heartland MLS as Distributed by MLS Grid
- 2024-11-14 Pending — Heartland MLS as Distributed by MLS Grid
- 2024-11-13 Relisted — Heartland MLS as Distributed by MLS Grid
- 2024-10-24 Pending — Heartland MLS as Distributed by MLS Grid
- 2024-10-21 Relisted — Heartland MLS as Distributed by MLS Grid
- 2024-09-20 Pending — Heartland MLS as Distributed by MLS Grid
- 2024-09-04 Listed $12,900 Heartland MLS as Distributed by MLS Grid
- 1994-09-15 Sold (Public Records) — Public Records
Property tax history
+3.4%/yrLatest (2025): $569 · -11.2% YoY. Source: county tax records.
Cash-flow waterfall
monthlySold comps — $/sqft
last 12 mo · ≤1 miLoading sold comps…