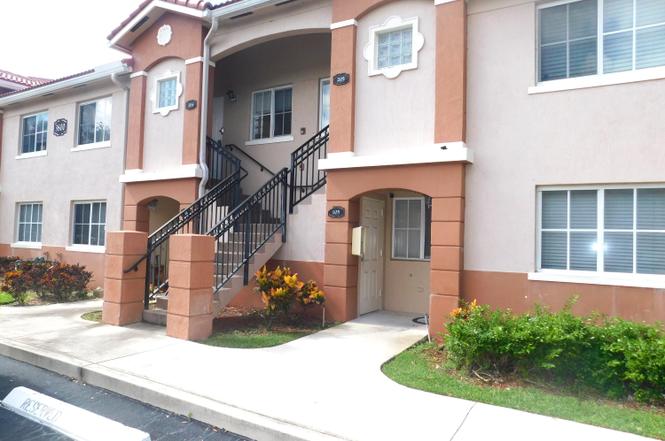
3800 N Jog Rd #204 · West Palm Beach, FL
Flood risk 1/10 · Minimal
- FEMA flood zone
- X (unshaded)
- Chance of flooding over 30 yrs
- 0.0%
- Est. flood insurance / yr
- $507 – $1,088
Fire risk 6/10 · Moderate
- Est. fire insurance / yr
- $947 – $1,759
Heat risk 10/10 · Severe
- Hot days now (above 105°F)
- 7 days/yr
- Hot days in 30 yrs
- 26 days/yr
Wind risk 10/10 · Severe
- Chance of severe wind over 30 yrs
- 99.0%
Air-quality risk 2/10 · Minimal
- Unhealthy air days now
- 1 days/yr
- Unhealthy air days in 30 yrs
- 1 days/yr
Risk factors via First Street. Map © Google.
Why this score? — see what drove the D- grade
The composite is a weighted blend of 9 inputs, each scored 0–100. Each bar is that input's sub-score; the figure is the points it added to the 100-point composite (weight × sub-score).
- Appreciation +10.0/10.0
- ARV discount +7.5/15.0
- Cash flow +5.1/30.0
- Schools +4.3/10.0
- Livability +4.1/5.0
- 1% rule +3.7/10.0
- Rent growth +2.7/5.0
- Condition / age +2.5/5.0
- DSCR +0.0/10.0
$210,000
🖨 Deal sheet 📄 Offer letter ✓ Due diligence
Listing remarks MLS
2004 - 2 BEDROOM, 2 BATH CONDO, UPGRADED TILE, STACKABLE WASHER & DRYER WITH NEUTRAL COLORS AND MORE.
Key facts
- Gated community
- Close access to pool
- Large walk in closet
Tags
Property features AI
Finance
- HOA & community: Community clubhouse; Community pool; Monthly HOA fee
Exterior
- Parking: Assigned parking
- Security: Gated (no guard)
- Utilities: Three-phase electric; Cable available; Water available
- Home design: Condominium; Single-story; Building faces north
- Construction: CBS construction
- Exterior features: Not waterfront
Interior
- Kitchen: Disposal; Electric range; Refrigerator
- Bedrooms: 2 bedrooms on the main level
- Bathrooms: 2 full bathrooms on the main level
- Heating & cooling: Central electric heating; Central electric cooling
- Interior features: Walk-in closet(s); Unfurnished
- Laundry & utility: Laundry inside the unit
Neighborhood map
What this means for you Summary
Snapshot
- This is a 2-bed/2.0-bath condo listed at $210k.
Deal economics
- At list price, monthly cash flow is $-486 ($-6k/yr) — negative.
- To cash-flow at today's rent, offer at most $124k (40.9% below list).
- To meet the 1% rule (rent ≥ 1% of price), the offer needs to be $183k (12.7% below list).
- Recommended offer: $124k (40.9% below list) — sets the bar for cash-flow.
Location & tenants
- Location reads 82/100 on livability (#75 in FL, #1,255 nationally) — a professional / high-income tenant draw. Strengths: commute A+, housing A+, health & safety A+; Watch: employment C-, crime F.
- Palm Beach (suburban): math 46% / reading 53% proficiency, ranked #34 of 73 in FL (top 47%) — families likely to look elsewhere, expect single-tenant / working-renter base with shorter leases.
- Zoned schools: Grassy Waters Elementary School (math 43% / reading 48%, grade D-, #1,247 of 2,144 statewide, top 59%, 739 students, 64% FRL); Jeaga Middle School (math 18% / reading 30%, grade F, #532 of 571 statewide, top 94%, 941 students, 78% FRL); Palm Beach Lakes High School (math 17% / reading 26%, grade F, #546 of 667 statewide, top 82%, 2,688 students, 70% FRL) — zoned schools average 71% FRL vs 52% district-wide (19 pts higher); higher-poverty schools than district average — tighter screening recommended.
- Zoned-school proficiency averages 30% at this address vs 50% district-wide (-19 pts) — the specific schools serving this property underperform the Palm Beach average; the district grade overstates school quality for this exact location.
- Market conditions: Rents flat; 574 active listings in the ZIP; 40 comparable units currently listed for rent nearby; rentals at typical pace (median 15d on market — plan ~3-4 weeks tenant-placement turnaround); solid renter incomes; 3,974 units permitted in Palm Beach County in 2024 (1,012 in 5+ unit buildings).
Forward outlook
- In year one you build about $22k of equity ($1k loan paydown + $21k appreciation (10.0% local appreciation)).
- Palm Beach County population projected at +30% by 2050 — long-run rental-demand tailwind backs the buy-and-hold thesis.
- By year 2, paydown + projected appreciation supports a ~$36k cash-out refi (75% LTV) — recoverable capital for the next deal without selling this one.
Negotiation context
- It's been on market 260 days — a 12% lower offer ($185k) is reasonable based on typical stale-listing flexibility.
- 3 sale attempts since 21y ago with the ask held roughly flat each time — persistent listings suggest the price (not the market) is what's stuck; bring a comps-based counter.
- Current owner paid $168k; 25% above their basis — modest negotiation headroom, anchor on the comps not their cost.
Risks & watch-outs
- Watch-outs: HOA is 22% of rent.
- Climate carrying-cost: severe wind risk, 99% chance of damaging wind over 30y; major wildfire risk; extreme-heat days projected 7→26/yr by 2055 (HVAC capex compounding) — expect insurance premiums to compound above CPI over the hold.
Questions for the listing agent
- What do current leases actually rent for vs. the listed asking? Can we see a recent rent roll and the last 12 months of T-12 income?
- It's been on market 260 days. Have you received any prior offers? Is the seller open to a 41% concession, seller financing, or rate buy-down credit?
- What does the HOA fee cover, when was the last increase, and are there any pending special assessments or reserve-fund shortfalls?
- Any open or pending special assessments — roof, HVAC, plumbing, elevator, façade? What's the per-unit balance and payoff schedule, and is the seller paying it off at close or rolling it to the buyer?
- Why hasn't it sold? Are there any deal-killer items the seller is aware of (foundation, flood, title, zoning, code violations)?
- Is there a deadline driving the sale (1031 exchange, divorce, estate, relocation)? That informs how much negotiation room exists.
- Crime grade is F in this area — have there been break-ins, vandalism, or insurance claims at this property in the last 3 years? What carrier currently insures it and at what premium?
- The area grade is low — what's the realistic commute time and amenity access for the typical tenant pool here? Any planned neighborhood developments (good or bad) we should know about?
- What's the average days-on-market for RENTAL listings here right now (not sales)? A rising rental-DOM trend means longer vacancies and softer asking-rent achievability than the comps imply.
- What's the recent tenant-quality profile in this submarket — average credit score on applications, eviction rate, late-payment / NSF rate, and stable-employment percentage? A property-management company in the area should have these aggregated.
- How much new apartment / multifamily construction is in the pipeline within 1–3 miles? Heavy new supply (>2% of stock underway) typically softens rents 12–24 months out; light construction supports rent growth.
Investment metrics
- 1% rule
- 0.87% ✗
- Cap rate
- 3.51%
- Cash-on-cash
- -9.93%
- DSCR
- 0.56
- GRM
- 9.5
CMA / ARV
No comps found within radius.
Projected returns pro-forma
10.0% appreciation · 0.85% rent growth · sell at horizon
- IRR
- 16.6%
- Equity multiple
- 2.36×
- Total profit
- $79,835
- Equity at exit
- $189,185
- IRR
- 15.4%
- Equity multiple
- 5.30×
- Total profit
- $252,899
- Equity at exit
- $407,984
Cash invested: $58,800 (down + closing). Projections, not guarantees.
Landlord ↔ Tenant lean methodology
- Overall (STATE)
- 87 Strongly Landlord-Friendly
- State Florida
- 87 Strongly Landlord-Friendly · R+3
- County
- — inherits STATE
- City
- — inherits STATE
ZIP-level market 33411
- Home prices YoY
- 1.9%
- Rents YoY
- 0.8%
- Active inventory
- 574
- Price-to-rent
- 9.5×
Monthly cashflow live
- Estimated rent
- $1,834 high interval (Pro) →
- Mortgage (P&I)
- −$1,101
- Tax from tax record
- −$343 /mo · $4,117/yr
- Insurance
- −$88
- HOA
- −$403
- Vacancy / Maint / Mgmt
- −$385
- Net cashflow
- $-486
Break-even live
UW: 25.0% down · 7.5% · 30yr · 1.5% tax · 5.0% vac · 8.0% maint · 8.0% mgmt
Financing live
Cash to close
- Down payment
- $52,500
- Closing costs
- $6,300
- Reserves months
- —
- Total cash needed
- —
Loan-product check · same deal, 3 products live
Conventional
25% down · 7.5% · 30yr
- Down + closing
- —
- Monthly P&I
- —
- Monthly cashflow
- —
- DSCR
- —
- Eligible?
- —
Personal DTI + credit; lowest rate.
DSCR
20% down · 8.5% · 30yr
- Down + closing
- —
- Monthly P&I
- —
- Monthly cashflow
- —
- DSCR
- —
- Eligible?
- —
No personal income docs; deal must DSCR.
Hard money
10% down · 12.0% · 12mo
- Down + closing
- —
- Monthly P&I
- —
- Monthly cashflow
- —
- DSCR
- —
- Eligible?
- —
Short-term bridge; refi at stabilization.
Rent comps 40 comps
| Address | Beds | Baths | Sqft | Rent | $/sqft | DOM | Units | Dist |
|---|---|---|---|---|---|---|---|---|
| 3790 N Jog Rd #203 West Palm Beach, FL | 2.0 | 2.0 | 863 | $1,850 | $2.14 | 7d | 1 | 0.03mi |
| 3810 N Jog Rd West Palm Beach, FL | 2.0 | 2.0 | 904 | $1,950 | $2.16 | 7d | 2 | 0.05mi |
| 3760 N Jog Rd #204 West Palm Beach, FL | 2.0 | 2.0 | 863 | $1,900 | $2.20 | 24d | 1 | 0.05mi |
| 3504 Briar Bay Blvd #205 West Palm Beach, FL | 2.0 | 2.0 | 863 | $1,850 | $2.14 | 24d | 1 | 0.10mi |
| 3504 Briar Bay Blvd #205 West Palm Beach, FL | 2.0 | 2.0 | 863 | $1,800 | $2.09 | 4d | 1 | 0.10mi |
| 3512 Briar Bay Blvd #105 West Palm Beach, FL | 2.0 | 2.0 | 883 | $2,000 | $2.27 | 7d | 1 | 0.18mi |
| 3490 Briar Bay Blvd West Palm Beach, FL | 2.0 | 2.0 | 920 | $1,800 | $1.96 | 4d | 1 | 0.19mi |
| 3490 Briar Bay Blvd #104 West Palm Beach, FL | 2.0 | 2.0 | 883 | $1,799 | $2.04 | 14d | 1 | 0.19mi |
| 197 Sussex E Unit 197 West Palm Beach, FL | 1.0 | 1.5 | 684 | $1,500 | $2.19 | 24d | 1 | 0.72mi |
| 16 Sussex E Unit 16 West Palm Beach, FL | 1.0 | 1.0 | 570 | $1,350 | $2.37 | 12d | 1 | 0.73mi |
| 176 Sussex I Unit I West Palm Beach, FL | 1.0 | 1.0 | 570 | $1,400 | $2.46 | 24d | 1 | 0.77mi |
| 172 Sussex I Unit I West Palm Beach, FL | 1.0 | 1.0 | 570 | $1,500 | $2.63 | 24d | 1 | 0.77mi |
| 159 Sussex H West Palm Beach, FL | 1.0 | 1.0 | 570 | $1,350 | $2.37 | 24d | 1 | 0.77mi |
| 4 Sussex a West Palm Beach, FL | 1.0 | 1.0 | 615 | $1,350 | $2.20 | 15d | 1 | 0.77mi |
| 176 Sussex I Unit I West Palm Beach, FL | 1.0 | 1.0 | 570 | $1,400 | $2.46 | 17d | 1 | 0.77mi |
| 166 Sussex I Unit I West Palm Beach, FL | 1.0 | 1.0 | 570 | $1,500 | $2.63 | 24d | 1 | 0.77mi |
| 188 Cambridge H Unit H West Palm Beach, FL | 1.0 | 1.5 | 684 | $1,345 | $1.97 | 5d | 1 | 0.77mi |
| 179 Canterbury H West Palm Beach, FL | 2.0 | 1.5 | 798 | $1,200 | $1.50 | 1d | 1 | 0.79mi |
| 179 Canterbury H Unit H West Palm Beach, FL | 2.0 | 1.5 | 798 | $1,200 | $1.50 | 24d | 1 | 0.79mi |
| 201 Canterbury I Unit I West Palm Beach, FL | 1.0 | 1.0 | 570 | $1,250 | $2.19 | 24d | 1 | 0.80mi |
| 1 Canterbury A Unit A West Palm Beach, FL | 2.0 | 1.5 | 798 | $1,595 | $2.00 | 24d | 1 | 0.80mi |
| 204 Canterbury I Unit I West Palm Beach, FL | 1.0 | 1.0 | 570 | $1,350 | $2.37 | 24d | 1 | 0.80mi |
| 50 Canterbury B West Palm Beach, FL | 1.0 | 1.5 | 774 | $1,250 | $1.61 | 14d | 1 | 0.80mi |
| 175 Canterbury H #175 West Palm Beach, FL | 1.0 | 1.0 | 570 | $1,250 | $2.19 | 15d | 1 | 0.80mi |
| 11 Cambridge E Unit 11 West Palm Beach, FL | 1.0 | 1.5 | 684 | $1,500 | $2.19 | 24d | 1 | 0.82mi |
| 210 Canterbury E Unit 1 West Palm Beach, FL | 1.0 | 1.0 | 570 | $1,375 | $2.41 | 12d | 1 | 0.83mi |
| 17 Cambridge a West Palm Beach, FL | 1.0 | 1.5 | 684 | $1,200 | $1.75 | 24d | 1 | 0.83mi |
| 49 Cambridge B Unit B West Palm Beach, FL | 1.0 | 1.5 | 684 | $1,350 | $1.97 | 3d | 1 | 0.83mi |
| 49 Cambridge B Unit B West Palm Beach, FL | 1.0 | 1.5 | 684 | $1,450 | $2.12 | 24d | 1 | 0.83mi |
| 79 Dorchester E Unit 79 West Palm Beach, FL | 2.0 | 1.5 | 798 | $1,500 | $1.88 | 24d | 1 | 0.84mi |
| 145 Dorchester E Unit 145 West Palm Beach, FL | 1.0 | 1.5 | 646 | $1,300 | $2.01 | 7d | 1 | 0.84mi |
| 6516 Morgan Hill Trl #1809 West Palm Beach, FL | 2.0 | 2.5 | 1086 | $2,050 | $1.89 | 3d | 1 | 0.88mi |
| 51 Dorchester E Unit 51 West Palm Beach, FL | 1.0 | 1.0 | 570 | $1,400 | $2.46 | 24d | 1 | 0.89mi |
| 144 Dorchester G West Palm Beach, FL | 2.0 | 1.5 | 798 | $1,700 | $2.13 | 12d | 1 | 0.90mi |
| 144 Dorchester G West Palm Beach, FL | 2.0 | 1.5 | 798 | $1,700 | $2.13 | 10d | 1 | 0.90mi |
| 3130 N Jog Rd West Palm Beach, FL | 1.0–3.0 | 1.0–2.0 | 1145 | $2,418 | $2.11 | 3d | 19 | 0.91mi |
| 245 Northampton M West Palm Beach, FL | 2.0 | 1.5 | 798 | $1,700 | $2.13 | 5d | 1 | 0.92mi |
| 243 Northampton M Unit M West Palm Beach, FL | 1.0 | 1.0 | 570 | $1,400 | $2.46 | 7d | 1 | 0.92mi |
| 235 Northampton L #235 West Palm Beach, FL | 1.0 | 1.0 | 615 | $1,300 | $2.11 | 10d | 1 | 0.94mi |
| 333 Northampton Q Unit 333 West Palm Beach, FL | 1.0 | 1.0 | 570 | $1,300 | $2.28 | 24d | 1 | 0.95mi |
HOA detail condo
- Monthly dues
- $403 · $4,836/yr
- Assessments
- None detected in remarks — confirm with the listing agent.
Listing history 18 events
-
2026-06-18days on market $210,000 Active 260 DOM
-
2026-06-17days on market $210,000 Active 259 DOM
-
2026-06-16days on market $210,000 Active 258 DOM
-
2026-06-15days on market $210,000 Active 257 DOM
-
2026-06-13days on market $210,000 Active 255 DOM
-
2026-06-09days on market $210,000 Active 251 DOM
-
2026-06-07days on market $210,000 Active 249 DOM
-
2026-06-04days on market $210,000 Active 246 DOM
-
2026-06-03days on market $210,000 Active 245 DOM
-
2026-06-01days on market $210,000 Active 243 DOM
-
2026-05-31days on market $210,000 Active 242 DOM
-
2025-10-01$210,000 Active
-
2014-10-17historical
-
2006-05-01$179,900
-
2005-04-25soldstatus $167,500
-
2005-03-31soldstatus $167,500 107-char remark
Show marketing remark (107 chars)
2004 - 2 BEDROOM, 2 BATH CONDO, UPGRADED TILE, STACKABLE WASHER & DRYER WITH NEUTRAL COLORS AND MORE.
-
2005-03-08historical 107-char remark
Show marketing remark (107 chars)
2004 - 2 BEDROOM, 2 BATH CONDO, UPGRADED TILE, STACKABLE WASHER & DRYER WITH NEUTRAL COLORS AND MORE.
-
2005-02-28$167,500 107-char remark
Show marketing remark (107 chars)
2004 - 2 BEDROOM, 2 BATH CONDO, UPGRADED TILE, STACKABLE WASHER & DRYER WITH NEUTRAL COLORS AND MORE.
ⓘ Source: listings_history table (triggers on properties + properties_extension) + one-shot
backfill from property_details.listing_events for pre-trigger history.
Tax reassessment forecast FL · Resets to sale price
- Current annual tax
- $4,117 · $343/mo
- Projected year-2 tax
- $4,117 · $343/mo
- Expected delta
- $0/yr ($0/mo · 0.0%)
ⓘ Screening estimate from a state-policy table — verify with the county assessor before closing.
Climate risk First Street
- Flood 1/10 Low FEMA zone X (unshaded) · 0% chance over 30 yrs
- Wildfire 6/10 Major
- Heat 10/10 Extreme 7 d/yr ≥105°F today · 26 d/yr by 30 yrs out
- Wind 10/10 Extreme 99% chance of damaging wind over 30 yrs
- Air quality 2/10 Low 1 unhealthy d/yr today · 1 by 30 yrs out
Nearby sold comps map
Loading sold comps map…
Walkable amenities ~0.75 mi
Loading nearby amenities…
Taxation est. · year 1
- Rental income
- $22,002
- − Mortgage interest
- −$11,763
- − Property taxes
- −$4,117
- − Insurance
- −$1,050
- − Repairs & maintenance
- −$1,760
- − Management
- −$1,760
- − HOA
- −$4,836
- − Depreciation
- −$6,109
- Taxable loss
- −$9,394
- Est. tax savings @ 24.0%
- +$2,255
- After-tax cash flow
- $-3,582/yr
For passive investors: Depreciation is non-cash, so a rental often shows a tax loss while cash-flowing — sheltering income. Rental losses are passive: they offset passive income freely, and up to $25,000/yr can offset ordinary (W-2) income if you actively participate and your MAGI is under $100k (phasing out to $0 by $150k); unused losses carry forward. On sale, claimed depreciation is recaptured at up to 25%, and gains may owe capital-gains tax (a 1031 exchange can defer both). Figures are a year-1 estimate at your 24.0% rate — not tax advice; consult a CPA.
Schools (NCES district)
- District
- Palm Beach
- NCES district ID
- 1201500
- Math proficiency
- 46% ▼ -16.00%
- Reading proficiency
- 53% ▼ -4.00%
- Median HH income
- $53,943
- Composite
- 42.72/100
- National rank
- #3160
- State rank
- #34 of 73 in FL
Livability — West Palm Beach
- Score
- 82/100
- State rank
- #75
- US rank
- #1255
Category grades
Schools grade is shown separately in the Schools card above.
Census & demographics
- Census place
- West Palm Beach, FL
- County
- Palm Beach County · 1,438,312 people
- City population
- 222,012
- Metro
- Miami-Fort Lauderdale-Pompano Beach, FL
- Population (ZIP)
- 76,863
- Household income
- $92,591
- Rent vs Own
- Severe rent burden
- 1870.0
Population outlook (Palm Beach County) Hauer SSP2
- Today (2025)
- 1,637,487 people
- By 2030
- 1,743,255 · +6.5%
- By 2040
- 1,948,712 · +19.0%
- By 2050
- 2,132,979 · +30.3%
- By 2075
- 2,530,027 · +54.5%
- By 2100
- 2,706,979 · +65.3%
Race, ethnicity, and origin ACS 2023
- Neighborhood character
- Diverse neighborhood (Simpson 0.70)
- Race & ethnicity
- White 44% Hispanic / Latino 24% Black 23% Two or more races 16% Asian 5%
- Hispanic origin (detail)
- Mexican 2% Puerto Rican 5% Cuban 4% Dominican 2%
- Common ancestry
- Hispanic 6% Romanian 2% Italian 1%
- Foreign-born
- 26% · Canada, Jamaica, China
- Languages at home
- 73% English-only · Spanish 17% French/Haitian/Cajun 4% Other Indo-European 2%
Political lean MEDSL · Palm Beach
- 2024 margin
- Toss-up / Even · D 50.0% · R 49.2%
- 2008→2024 swing
- -22.1pp toward R · 2008: 22.9pp · 2024: 0.8pp
- All cycles
- 2024: D+0.8 2020: D+12.8 2016: D+15.3 2012: D+17.0 2008: D+22.9
Not yet ingested
- Civics
- —
Market trends
- HPI YoY
- ▲ 17.04%
- Current HPI
- 903.78
- Rent YoY
- ▲ 0.85%
- Metro
- Miami-Fort Lauderdale-Pompano Beach, FL
- State GDP YoY
- ▲ 3.28%
- F500 in state
- 36
Industry mix (Fortune 500 HQ in FL)
| Industry | F500 HQs | Revenue |
|---|---|---|
| Industrial Technology | 2 | $29B |
|
||
| Insurance | 2 | $17B |
|
||
| Retail | 1 | $60B |
|
||
| Technology Distribution | 1 | $58B |
|
||
| Homebuilding | 1 | $35B |
|
||
| Technology Manufacturing | 1 | $35B |
|
||
Price history
+25.4% since first listed7 events — show timeline
- 2025-10-01 Listed $210,000 Beaches MLS
- 2014-10-17 Listing Removed — Beaches MLS
- 2006-05-01 Listed $179,900 Beaches MLS
- 2005-04-25 Sold (Public Records) $167,500 Public Records
- 2005-03-31 Sold (MLS) $167,500 Beaches MLS
- 2005-03-08 Listing Removed — Beaches MLS
- 2005-02-28 Listed $167,500 Beaches MLS
Property tax history
+6.4%/yrLatest (2025): $4,117 · +5.9% YoY. Source: county tax records.
Cash-flow waterfall
monthlySold comps — $/sqft
last 12 mo · ≤1 miLoading sold comps…