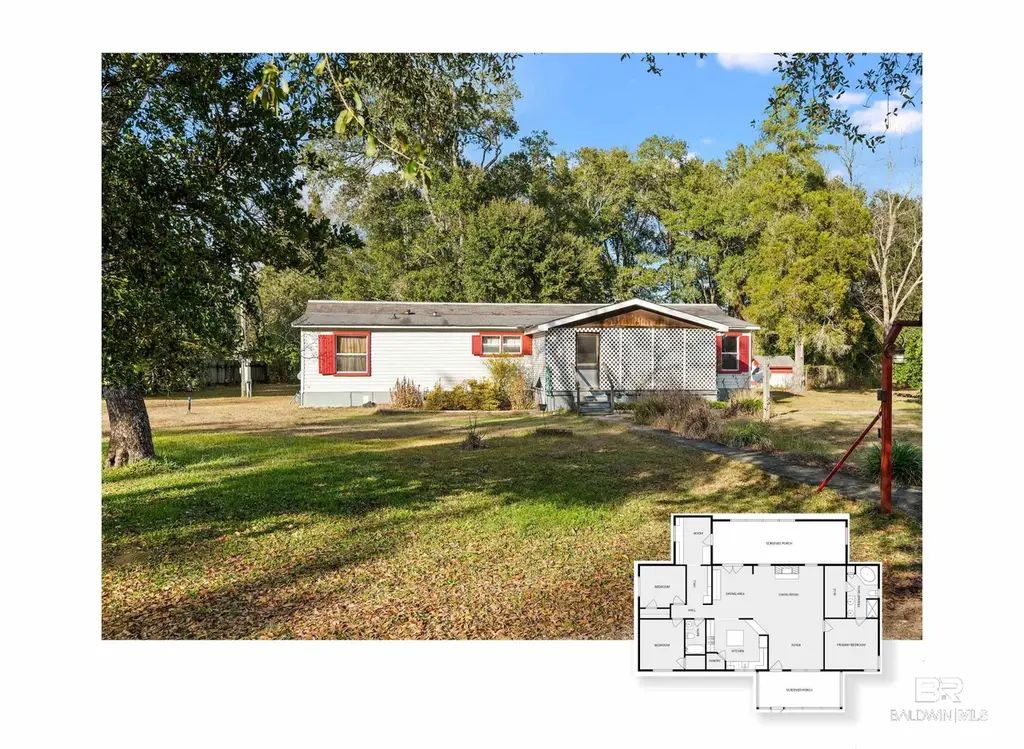
11960 Woodland Ave · Foley, AL
Flood risk 1/10 · Minimal
- FEMA flood zone
- X (unshaded)
- Chance of flooding over 30 yrs
- 0.0%
- Est. flood insurance / yr
- $507 – $1,088
Fire risk 4/10 · Minor
- Est. fire insurance / yr
- $916 – $1,700
Heat risk 10/10 · Severe
- Hot days now (above 104°F)
- 7 days/yr
- Hot days in 30 yrs
- 23 days/yr
Wind risk 9/10 · Severe
- Chance of severe wind over 30 yrs
- 99.0%
Air-quality risk 2/10 · Minimal
- Unhealthy air days now
- 1 days/yr
- Unhealthy air days in 30 yrs
- 1 days/yr
Risk factors via First Street. Map © Google.
Why this score? — see what drove the C grade
The composite is a weighted blend of 9 inputs, each scored 0–100. Each bar is that input's sub-score; the figure is the points it added to the 100-point composite (weight × sub-score).
- Cash flow +18.3/30.0
- ARV discount +14.2/15.0
- DSCR +5.7/10.0
- 1% rule +4.9/10.0
- Schools +3.9/10.0
- Livability +3.1/5.0
- Rent growth +3.0/5.0
- Condition / age +2.5/5.0
- Appreciation +0.0/10.0
$189,000
🖨 Deal sheet 📄 Offer letter ✓ Due diligence
Listing remarks MLS
Great fixer-upper or investment opportunity. This AS-IS WHERE IS 3 bedroom, 2 bath double wide offers 1,620 sq ft of living space and sits on an unzoned . 83 acre lot providing the possibility of adding a second dwelling to the lot with income potential. Conveniently located just minutes from OWA, 20 minutes to the beach, and a 20 minute drive to Florida. This property features a large 33' x 10' enclosed rear porch, 20' x 8' covered front porch, hurricane anchors to slab, shall shed, mature blackberry bushes, and a chicken coop. Whether your looking to renovate or invest, this property as so much potential. Bring all offers! Buyer to verify all information during due diligence.
Key facts
- 0.83 acre lot
- Built 1995
- Listed 171 days
Neighborhood map
What this means for you Summary
Snapshot
- This is a 3-bed/2.0-bath manufactured listed at $189k.
Deal economics
- At list price, monthly cash flow is $173 ($2k/yr) — positive.
- The deal already cash-flows at list — no discount required.
- To meet the 1% rule (rent ≥ 1% of price), the offer needs to be $187k (0.9% below list).
- Recommended offer: $166k (12.0% below list) — sets the bar for market timing.
- Cap rate 7.4% vs local median 4.0% in Foley — top-decile yield for the area; either an underpriced asset or a hidden risk that comps aren't pricing in. Stress-test before assuming the spread holds.
Location & tenants
- Location reads 61/100 on livability (#241 in AL) — a middle-class / working-renter tenant base. Strengths: housing A+, cost of living A-, crime B; Watch: schools D+, employment D+, amenities F.
- Baldwin County (rural): math 33% / reading 57% proficiency, ranked #18 of 129 in AL (top 14%) — families likely to look elsewhere, expect single-tenant / working-renter base with shorter leases.
- Market conditions: Rents rising (+1.8%/yr); 875 active listings in the ZIP; 1 comparable units currently listed for rent nearby; 3,883 units permitted in Baldwin County in 2024 (481 in 5+ unit buildings).
- This rent runs 34% of the median local income ($67k/yr) — at the standard rent-burdened threshold; future hikes will face affordability resistance.
Forward outlook
- Local home prices are declining (-3.0%/yr); year-one equity from $1k of loan paydown is wiped out by about $6k of value loss. Plan a longer hold.
- Baldwin County population projected at +42% by 2050 — long-run rental-demand tailwind backs the buy-and-hold thesis.
Negotiation context
- It's been on market 172 days — a 12% lower offer ($166k) is reasonable based on typical stale-listing flexibility.
- Current owner paid $66k; list at $189k implies a 186% gain — meaningful room to come down on a strong offer.
Risks & watch-outs
- Climate carrying-cost: severe wind risk, 99% chance of damaging wind over 30y; extreme-heat days projected 7→23/yr by 2055 (HVAC capex compounding) — expect insurance premiums to compound above CPI over the hold.
Questions for the listing agent
- It's been on market 172 days. Have you received any prior offers? Is the seller open to a 12% concession, seller financing, or rate buy-down credit?
- Why hasn't it sold? Are there any deal-killer items the seller is aware of (foundation, flood, title, zoning, code violations)?
- Is there a deadline driving the sale (1031 exchange, divorce, estate, relocation)? That informs how much negotiation room exists.
- Schools are D-rated, which usually means shorter tenancies and higher turnover. Who's the typical renter profile here, and what's been the actual vacancy rate?
- What's the average days-on-market for RENTAL listings here right now (not sales)? A rising rental-DOM trend means longer vacancies and softer asking-rent achievability than the comps imply.
- What's the recent tenant-quality profile in this submarket — average credit score on applications, eviction rate, late-payment / NSF rate, and stable-employment percentage? A property-management company in the area should have these aggregated.
- How much new for-sale + rental construction is in the pipeline within 1–3 miles? Heavy new supply typically softens prices + rents 12–24 months out; constrained supply supports both.
Investment metrics
- 1% rule
- 0.99% ✗
- Cap rate
- 7.39%
- Cash-on-cash
- 3.92%
- DSCR
- 1.17
- GRM
- 8.4
CMA / ARV
- ARV (median comp)
- $222,255
- List price
- $189,000
- Delta
- -14.96%
- Verdict
- UNDERPRICED
- Comps
- 1 within 2.0 mi
Show comp detail 1 sale within ~0.75 mi
| Address | Dist | Beds/Ba | Sqft | Sold | Price | $/sf | Match |
|---|---|---|---|---|---|---|---|
| 12288 Fernwood Dr | 0.50mi | 4/2.0 (+1) | 1,622 (+0%) | 7mo | $218,000 | $134 | 65 |
Match score weights: distance 35% · size 25% · config 20% · recency 20%. Top-matched comps best support the ARV.
Projected returns pro-forma
-3.0% appreciation · 1.81% rent growth · sell at horizon
- IRR
- -11.5%
- Equity multiple
- 0.59×
- Total profit
- $-21,804
- Equity at exit
- $28,181
- IRR
- -4.1%
- Equity multiple
- 0.74×
- Total profit
- $-13,570
- Equity at exit
- $16,341
Cash invested: $52,920 (down + closing). Projections, not guarantees.
Landlord ↔ Tenant lean methodology
- Overall (STATE)
- 90 Strongly Landlord-Friendly
- State Alabama
- 90 Strongly Landlord-Friendly · R+15
- County
- — inherits STATE
- City
- — inherits STATE
ZIP-level market 36535
- Home prices YoY
- -24.9%
- Rents YoY
- 1.8%
- Active inventory
- 875
- Price-to-rent
- 8.4×
Monthly cashflow live
- Estimated rent
- $1,872 medium interval (Pro) →
- Mortgage (P&I)
- −$991
- Tax est. 1.5%
- −$236 /mo · $2,835/yr
- Insurance
- −$79
- HOA
- −$0
- Vacancy / Maint / Mgmt
- −$393
- Net cashflow
- $173
Break-even live
UW: 25.0% down · 7.5% · 30yr · 1.5% tax · 5.0% vac · 8.0% maint · 8.0% mgmt
Financing live
Cash to close
- Down payment
- $47,250
- Closing costs
- $5,670
- Reserves months
- —
- Total cash needed
- —
Loan-product check · same deal, 3 products live
Conventional
25% down · 7.5% · 30yr
- Down + closing
- —
- Monthly P&I
- —
- Monthly cashflow
- —
- DSCR
- —
- Eligible?
- —
Personal DTI + credit; lowest rate.
DSCR
20% down · 8.5% · 30yr
- Down + closing
- —
- Monthly P&I
- —
- Monthly cashflow
- —
- DSCR
- —
- Eligible?
- —
No personal income docs; deal must DSCR.
Hard money
10% down · 12.0% · 12mo
- Down + closing
- —
- Monthly P&I
- —
- Monthly cashflow
- —
- DSCR
- —
- Eligible?
- —
Short-term bridge; refi at stabilization.
Rent comps 1 comps
| Address | Beds | Baths | Sqft | Rent | $/sqft | DOM | Units | Dist |
|---|---|---|---|---|---|---|---|---|
| 12407 Sandy Ln Foley, AL | 3.0 | 2.0 | 1558 | $2,100 | $1.35 | 43d | 1 | 0.64mi |
Listing history 20 events
-
2026-06-19days on market $189,000 Active 172 DOM
-
2026-06-18days on market $189,000 Active 171 DOM
-
2026-06-17days on market $189,000 Active 170 DOM
-
2026-06-16days on market $189,000 Active 169 DOM
-
2026-06-15days on market $189,000 Active 168 DOM
-
2026-06-14days on market $189,000 Active 166 DOM
-
2026-06-13days on market $189,000 Active 165 DOM
-
2026-06-10days on market $189,000 Active 163 DOM
-
2026-06-09days on market $189,000 Active 162 DOM
-
2026-06-08days on market $189,000 Active 161 DOM
-
2026-06-07days on market $189,000 Active 160 DOM
-
2026-06-03days on market $189,000 Active 156 DOM
-
2026-06-02days on market $189,000 Active 155 DOM
-
2026-06-01days on market $189,000 Active 154 DOM
-
2026-05-31days on market $189,000 Active 153 DOM
-
2026-05-30days on market $189,000 Active 152 DOM
-
2026-01-29price $189,000 686-char remark
Show marketing remark (686 chars)
Great fixer-upper or investment opportunity. This AS-IS WHERE IS 3 bedroom, 2 bath double wide offers 1,620 sq ft of living space and sits on an unzoned . 83 acre lot providing the possibility of adding a second dwelling to the lot with income potential. Conveniently located just minutes from OWA, 20 minutes to the beach, and a 20 minute drive to Florida. This property features a large 33' x 10' enclosed rear porch, 20' x 8' covered front porch, hurricane anchors to slab, shall shed, mature blackberry bushes, and a chicken coop. Whether your looking to renovate or invest, this property as so much potential. Bring all offers! Buyer to verify all information during due diligence.
-
2025-12-29$199,000 Active 686-char remark
Show marketing remark (686 chars)
Great fixer-upper or investment opportunity. This AS-IS WHERE IS 3 bedroom, 2 bath double wide offers 1,620 sq ft of living space and sits on an unzoned . 83 acre lot providing the possibility of adding a second dwelling to the lot with income potential. Conveniently located just minutes from OWA, 20 minutes to the beach, and a 20 minute drive to Florida. This property features a large 33' x 10' enclosed rear porch, 20' x 8' covered front porch, hurricane anchors to slab, shall shed, mature blackberry bushes, and a chicken coop. Whether your looking to renovate or invest, this property as so much potential. Bring all offers! Buyer to verify all information during due diligence.
-
2025-12-09historical $199,000 686-char remark
Show marketing remark (686 chars)
Great fixer-upper or investment opportunity. This AS-IS WHERE IS 3 bedroom, 2 bath double wide offers 1,620 sq ft of living space and sits on an unzoned . 83 acre lot providing the possibility of adding a second dwelling to the lot with income potential. Conveniently located just minutes from OWA, 20 minutes to the beach, and a 20 minute drive to Florida. This property features a large 33' x 10' enclosed rear porch, 20' x 8' covered front porch, hurricane anchors to slab, shall shed, mature blackberry bushes, and a chicken coop. Whether your looking to renovate or invest, this property as so much potential. Bring all offers! Buyer to verify all information during due diligence.
-
2009-05-20soldstatus $66,000
ⓘ Source: listings_history table (triggers on properties + properties_extension) + one-shot
backfill from property_details.listing_events for pre-trigger history.
Climate risk First Street
- Flood 1/10 Low FEMA zone X (unshaded) · 0% chance over 30 yrs
- Wildfire 4/10 Moderate
- Heat 10/10 Extreme 7 d/yr ≥104°F today · 23 d/yr by 30 yrs out
- Wind 9/10 Extreme 99% chance of damaging wind over 30 yrs
- Air quality 2/10 Low 1 unhealthy d/yr today · 1 by 30 yrs out
Nearby sold comps map
Loading sold comps map…
Walkable amenities ~0.75 mi
Loading nearby amenities…
Taxation est. · year 1
- Rental income
- $22,466
- − Mortgage interest
- −$10,587
- − Property taxes
- −$2,835
- − Insurance
- −$945
- − Repairs & maintenance
- −$1,797
- − Management
- −$1,797
- − Depreciation
- −$5,498
- Taxable loss
- −$994
- Est. tax savings @ 24.0%
- +$239
- After-tax cash flow
- $2,313/yr
For passive investors: Depreciation is non-cash, so a rental often shows a tax loss while cash-flowing — sheltering income. Rental losses are passive: they offset passive income freely, and up to $25,000/yr can offset ordinary (W-2) income if you actively participate and your MAGI is under $100k (phasing out to $0 by $150k); unused losses carry forward. On sale, claimed depreciation is recaptured at up to 25%, and gains may owe capital-gains tax (a 1031 exchange can defer both). Figures are a year-1 estimate at your 24.0% rate — not tax advice; consult a CPA.
Schools (NCES district)
- District
- Baldwin County
- NCES district ID
- 0100270
- Math proficiency
- 33% ▼ -26.00%
- Reading proficiency
- 57% ▲ 1.00%
- Median HH income
- $50,677
- Composite
- 38.61/100
- National rank
- #4157
- State rank
- #18 of 129 in AL
Livability — Foley
- Score
- 61/100
- State rank
- #241
- US rank
- #17616
Category grades
Schools grade is shown separately in the Schools card above.
Census & demographics
- County
- Baldwin County · 181,514 people
- City population
- 40,628
- Metro
- Daphne-Fairhope-Foley, AL
- Population (ZIP)
- 40,628
- Household income
- $66,714
- Rent vs Own
- Severe rent burden
- 803.0
Population outlook (Baldwin County) Hauer SSP2
- Today (2025)
- 248,264 people
- By 2030
- 270,315 · +8.9%
- By 2040
- 312,967 · +26.1%
- By 2050
- 352,262 · +41.9%
- By 2075
- 438,841 · +76.8%
- By 2100
- 487,736 · +96.5%
Race, ethnicity, and origin ACS 2023
- Neighborhood character
- Predominantly White (78%)
- Race & ethnicity
- White 78% Hispanic / Latino 10% Two or more races 8% Black 5% Asian 2%
- Hispanic origin (detail)
- Mexican 6%
- Common ancestry
- Lithuanian 2% Romanian 2% Slovak 1%
- Foreign-born
- 6% · Canada, China
- Languages at home
- 89% English-only · Spanish 7% Other Indo-European 2% Chinese 1%
Political lean MEDSL · Baldwin
- 2024 margin
- Solid R (+58.2) · D 20.5% · R 78.7%
- 2008→2024 swing
- -6.7pp toward R · 2008: -51.5pp · 2024: -58.2pp
- All cycles
- 2024: R+58.2 2020: R+53.8 2016: R+57.8 2012: R+55.8 2008: R+51.5
Not yet ingested
- Civics
- —
Market trends
- HPI YoY
- ▼ -86.82%
- Current HPI
- 262.2796
- Rent YoY
- ▲ 1.81%
- Metro
- Daphne-Fairhope-Foley, AL
- State GDP YoY
- ▲ 2.94%
- F500 in state
- 4
Industry mix (Fortune 500 HQ in AL)
| Industry | F500 HQs | Revenue |
|---|---|---|
| Financial Services | 1 | $8B |
|
||
| Healthcare | 1 | $5B |
|
||
Price history
+186.4% since first listed4 events — show timeline
- 2026-01-29 Price Changed $189,000 BCAR
- 2025-12-29 Listed $199,000 BCAR
- 2025-12-09 Coming Soon $199,000 BCAR
- 2009-05-20 Sold (Public Records) $66,000 Public Records
Cash-flow waterfall
monthlySold comps — $/sqft
last 12 mo · ≤1 miLoading sold comps…