419 Wood River Rd · Millsap, TX
Flood risk 1/10 · Minimal
- FEMA flood zone
- X
- Chance of flooding over 30 yrs
- 0.0%
- Est. flood insurance / yr
- $435 – $905
Fire risk 7/10 · Major
- Est. fire insurance / yr
- $1,222 – $2,270
Heat risk 7/10 · Major
- Hot days now (above threshold)
- 7 days/yr
- Hot days in 30 yrs
- 22 days/yr
Wind risk No data
- Chance of severe wind over 30 yrs
- —
Air-quality risk No data
- Unhealthy air days now
- —
- Unhealthy air days in 30 yrs
- —
Risk factors via First Street. Map © Google.
Why this score? — see what drove the D grade
The composite is a weighted blend of 9 inputs, each scored 0–100. Each bar is that input's sub-score; the figure is the points it added to the 100-point composite (weight × sub-score).
- Cash flow +15.2/30.0
- ARV discount +7.5/15.0
- DSCR +4.7/10.0
- Schools +4.4/10.0
- 1% rule +4.1/10.0
- Livability +3.0/5.0
- Rent growth +2.5/5.0
- Condition / age +2.5/5.0
- Appreciation +0.0/10.0
$149,999
🖨 Deal sheet 📄 Offer letter ✓ Due diligence
Listing remarks
A unique property on a beautiful treed lot. Just a min from the renowned Millsap high school, elementary school, and middle school. Fully fenced with 419 Wood River, but still very private. Commuting distance from Fort Worth and Weatherford. Fenced yard and gated. Three bedrooms and two bathrooms, open floor plan, and recently updated features. This is the perfect place to call home.
Key facts
- Fully fenced
- Fenced yard
- Private
Tags
Property features AI
Finance
- Other: Lot is approximately 1 acre and is listed as subdivided; No known restrictions
- Financial info: Accepts Cash, Conventional, and VA financing
- HOA & community: No HOA / association
Exterior
- Parking: Circular driveway (no covered or carport spaces listed)
- Utilities: Cable available; Septic; Asphalt road access; Municipal utility district: No
- Home design: Single-family residence; One story; Property attached: Yes; Subdivision: Wood River Add; Horse permitted
- Construction: Siding exterior; Preowned
- Exterior features: Acreage lot with few trees; Located on a cul-de-sac; Metal fencing; Circular driveway; Septic; Asphalt access
Interior
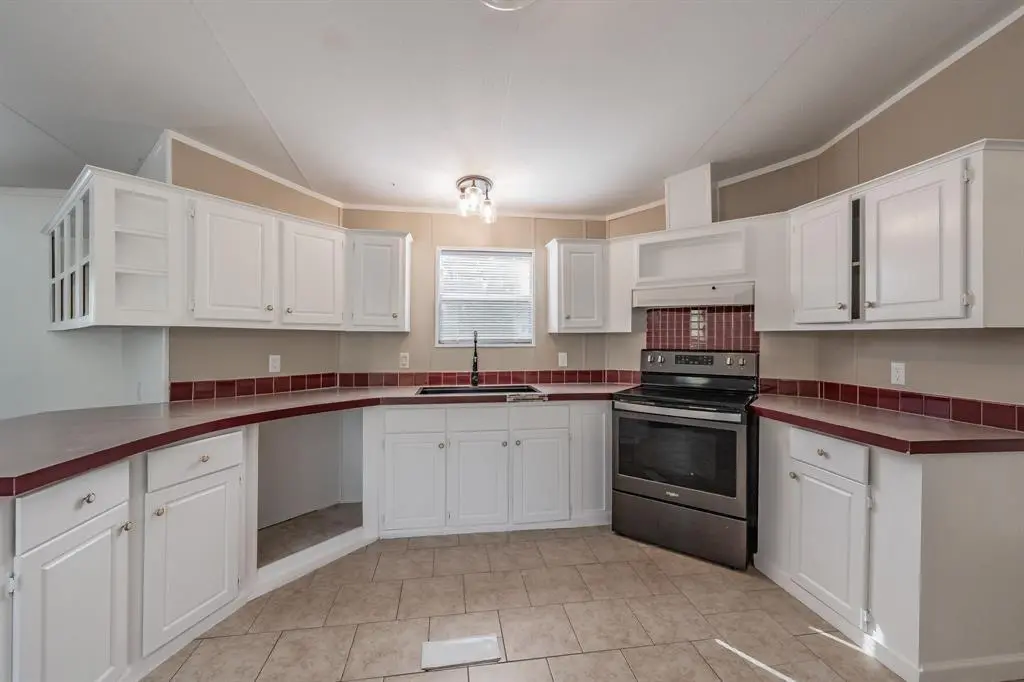
- Kitchen: Dishwasher; Electric range
- Bedrooms: 2 bedrooms (both on the main level)
- Bathrooms: 2 full bathrooms
- Heating & cooling: Central heating (electric); Central air conditioning; Ceiling fan(s)
- Interior features: Open floorplan; Decorative lighting; Walk-in closet(s); One living area; One dining area; 4 total rooms
Neighborhood map
What this means for you Summary
Snapshot
- This is a 2-bed/2.0-bath manufactured listed at $150k.
Deal economics
- At list price, monthly cash flow is $53 ($630/yr) — positive.
- The deal already cash-flows at list — no discount required.
- To meet the 1% rule (rent ≥ 1% of price), the offer needs to be $137k (8.9% below list).
- Recommended offer: $137k (8.9% below list) — sets the bar for 1% rule.
- Cap rate 6.7% vs local median 1.3% in Millsap — top-decile yield for the area; either an underpriced asset or a hidden risk that comps aren't pricing in. Stress-test before assuming the spread holds.
Location & tenants
- Location reads 60/100 on livability (#1,044 in TX) — a middle-class / working-renter tenant base. Strengths: cost of living A+, housing A+; Watch: health & safety D+, crime D-, amenities F.
- Millsap ISD (rural): math 53% / reading 49% proficiency, ranked #147 of 826 in TX (top 18%) — acceptable for families but not a draw, mixed tenant base, ~2y average lease.
- Zoned schools: Millsap El (math 48% / reading 48%, grade D, #971 of 4,322 statewide, top 23%, 531 students, 51% FRL).
- Market conditions: 70 active listings in the ZIP; 437 units permitted in Parker County in 2024 (0 in 5+ unit buildings).
Forward outlook
- Local home prices are declining (-3.0%/yr); year-one equity from $1k of loan paydown is wiped out by about $4k of value loss. Plan a longer hold.
- Parker County population projected at +32% by 2050 — long-run rental-demand tailwind backs the buy-and-hold thesis.
Negotiation context
- Only 14 days on market — expect competitive offers; lowballing is unlikely to land.
- 2 sale attempts with the ask held roughly flat each time — persistent listings suggest the price (not the market) is what's stuck; bring a comps-based counter.
Risks & watch-outs
- Climate carrying-cost: major wildfire risk; extreme-heat days projected 7→22/yr by 2055 (HVAC capex compounding) — expect insurance premiums to compound above CPI over the hold.
Questions for the listing agent
- Is there a deadline driving the sale (1031 exchange, divorce, estate, relocation)? That informs how much negotiation room exists.
- Schools are D-rated, which usually means shorter tenancies and higher turnover. Who's the typical renter profile here, and what's been the actual vacancy rate?
- Crime grade is D in this area — have there been break-ins, vandalism, or insurance claims at this property in the last 3 years? What carrier currently insures it and at what premium?
- The area grade is low — what's the realistic commute time and amenity access for the typical tenant pool here? Any planned neighborhood developments (good or bad) we should know about?
- What's the average days-on-market for RENTAL listings here right now (not sales)? A rising rental-DOM trend means longer vacancies and softer asking-rent achievability than the comps imply.
- What's the recent tenant-quality profile in this submarket — average credit score on applications, eviction rate, late-payment / NSF rate, and stable-employment percentage? A property-management company in the area should have these aggregated.
- How much new for-sale + rental construction is in the pipeline within 1–3 miles? Heavy new supply typically softens prices + rents 12–24 months out; constrained supply supports both.
Investment metrics
- 1% rule
- 0.91% ✗
- Cap rate
- 6.71%
- Cash-on-cash
- 1.50%
- DSCR
- 1.07
- GRM
- 9.2
CMA / ARV
No comps found within radius.
Projected returns pro-forma
-3.0% appreciation · 3.0% rent growth · sell at horizon
- IRR
- -13.9%
- Equity multiple
- 0.50×
- Total profit
- $-20,947
- Equity at exit
- $22,365
- IRR
- -5.1%
- Equity multiple
- 0.67×
- Total profit
- $-13,873
- Equity at exit
- $12,969
Cash invested: $42,000 (down + closing). Projections, not guarantees.
Landlord ↔ Tenant lean methodology
- Overall (STATE)
- 87 Strongly Landlord-Friendly
- State Texas
- 87 Strongly Landlord-Friendly · R+5
- County
- — inherits STATE
- City
- — inherits STATE
ZIP-level market 76066
- Active inventory
- 70
- Price-to-rent
- 9.2×
Monthly cashflow live
- Estimated rent
- $1,366 medium interval (Pro) →
- Mortgage (P&I)
- −$787
- Tax from tax record
- −$178 /mo · $2,131/yr
- Insurance
- −$62
- HOA
- −$0
- Vacancy / Maint / Mgmt
- −$287
- Net cashflow
- $53
Break-even live
UW: 25.0% down · 7.5% · 30yr · 1.5% tax · 5.0% vac · 8.0% maint · 8.0% mgmt
Financing live
Cash to close
- Down payment
- $37,500
- Closing costs
- $4,500
- Reserves months
- —
- Total cash needed
- —
Loan-product check · same deal, 3 products live
Conventional
25% down · 7.5% · 30yr
- Down + closing
- —
- Monthly P&I
- —
- Monthly cashflow
- —
- DSCR
- —
- Eligible?
- —
Personal DTI + credit; lowest rate.
DSCR
20% down · 8.5% · 30yr
- Down + closing
- —
- Monthly P&I
- —
- Monthly cashflow
- —
- DSCR
- —
- Eligible?
- —
No personal income docs; deal must DSCR.
Hard money
10% down · 12.0% · 12mo
- Down + closing
- —
- Monthly P&I
- —
- Monthly cashflow
- —
- DSCR
- —
- Eligible?
- —
Short-term bridge; refi at stabilization.
Listing history 10 events
-
2026-06-18days on market $149,999 Active 14 DOM
-
2026-06-17days on market $149,999 Active 13 DOM
-
2026-06-16days on market $149,999 Active 12 DOM
-
2026-06-15days on market $149,999 Active 11 DOM
-
2026-06-13days on market $149,999 Active 9 DOM
-
2026-06-13days on market $149,999 Active 8 DOM
-
2026-06-09days on market $149,999 Active 5 DOM
-
2026-06-08days on market $149,999 Active 4 DOM
-
2026-06-07remarks 386-char remark
-
2026-06-07$149,999 Active 3 DOM
ⓘ Source: listings_history table (triggers on properties + properties_extension) + one-shot
backfill from property_details.listing_events for pre-trigger history.
Tax reassessment forecast TX · Resets to sale price
- Current annual tax
- $2,131 · $178/mo
- Projected year-2 tax
- $2,745 · $229/mo
- Expected delta
- +$614/yr (+$51/mo · 28.8%)
ⓘ Screening estimate from a state-policy table — verify with the county assessor before closing.
Climate risk First Street
- Flood 1/10 Low FEMA zone X · 0% chance over 30 yrs
- Wildfire 7/10 Severe
- Heat 7/10 Severe
Nearby sold comps map
Loading sold comps map…
Walkable amenities ~0.75 mi
Loading nearby amenities…
Taxation est. · year 1
- Rental income
- $16,393
- − Mortgage interest
- −$8,402
- − Property taxes
- −$2,131
- − Insurance
- −$750
- − Repairs & maintenance
- −$1,311
- − Management
- −$1,311
- − Depreciation
- −$4,364
- Taxable loss
- −$1,877
- Est. tax savings @ 24.0%
- +$450
- After-tax cash flow
- $1,081/yr
For passive investors: Depreciation is non-cash, so a rental often shows a tax loss while cash-flowing — sheltering income. Rental losses are passive: they offset passive income freely, and up to $25,000/yr can offset ordinary (W-2) income if you actively participate and your MAGI is under $100k (phasing out to $0 by $150k); unused losses carry forward. On sale, claimed depreciation is recaptured at up to 25%, and gains may owe capital-gains tax (a 1031 exchange can defer both). Figures are a year-1 estimate at your 24.0% rate — not tax advice; consult a CPA.
Schools (NCES district)
- District
- Millsap ISD
- NCES district ID
- 4830870
- Math proficiency
- 53% ▼ -2.00%
- Reading proficiency
- 49% ▲ 2.00%
- Median HH income
- $55,988
- Composite
- 44.21/100
- National rank
- #2850
- State rank
- #147 of 826 in TX
Livability — Millsap
- Score
- 60/100
- State rank
- #1044
- US rank
- #18563
Category grades
Schools grade is shown separately in the Schools card above.
Census & demographics
- Population (ZIP)
- 5,615
Population outlook (Parker County) Hauer SSP2
- Today (2025)
- 147,426 people
- By 2030
- 157,863 · +7.1%
- By 2040
- 177,519 · +20.4%
- By 2050
- 194,786 · +32.1%
- By 2075
- 238,799 · +62.0%
- By 2100
- 264,126 · +79.2%
Race, ethnicity, and origin ACS 2023
- Neighborhood character
- Predominantly White (79%)
- Race & ethnicity
- White 79% Two or more races 19% Hispanic / Latino 15%
- Hispanic origin (detail)
- Mexican 9%
- Common ancestry
- Italian 2% European 2% Scotch-Irish 1%
- Foreign-born
- 6% · Canada
- Languages at home
- 90% English-only · Spanish 10%
Political lean MEDSL · Parker
- 2024 margin
- Solid R (+66.4) · D 16.4% · R 82.8%
- 2008→2024 swing
- -11.2pp toward R · 2008: -55.2pp · 2024: -66.4pp
- All cycles
- 2024: R+66.4 2020: R+64.4 2016: R+67.5 2012: R+65.8 2008: R+55.2
Not yet ingested
- Civics
- —
Market trends
- HPI YoY
- ▼ -81.09%
- Current HPI
- 140.3208
- Rent YoY
- —
- Metro
- —
- State GDP YoY
- ▲ 3.95%
- F500 in state
- 110
Industry mix (Fortune 500 HQ in TX)
| Industry | F500 HQs | Revenue |
|---|---|---|
| Energy | 16 | $1,198B |
|
||
| Technology | 5 | $198B |
|
||
| Engineering / Construction | 4 | $72B |
|
||
| Energy Services | 3 | $60B |
|
||
| Utilities | 3 | $41B |
|
||
| Healthcare | 2 | $330B |
|
||
Price history
+0.0% since first listed5 events — show timeline
- 2026-06-04 Listed $149,999 NTREIS
- 2026-04-30 Listing Removed — NTREIS
- 2025-11-26 Listed $149,999 NTREIS
- 2015-03-27 Sold (Public Records) — Public Records
- 2003-07-18 Sold (Public Records) — Public Records
Property tax history
+14.9%/yrLatest (2025): $2,131 · +12.7% YoY. Source: county tax records.
Cash-flow waterfall
monthlySold comps — $/sqft
last 12 mo · ≤1 miLoading sold comps…