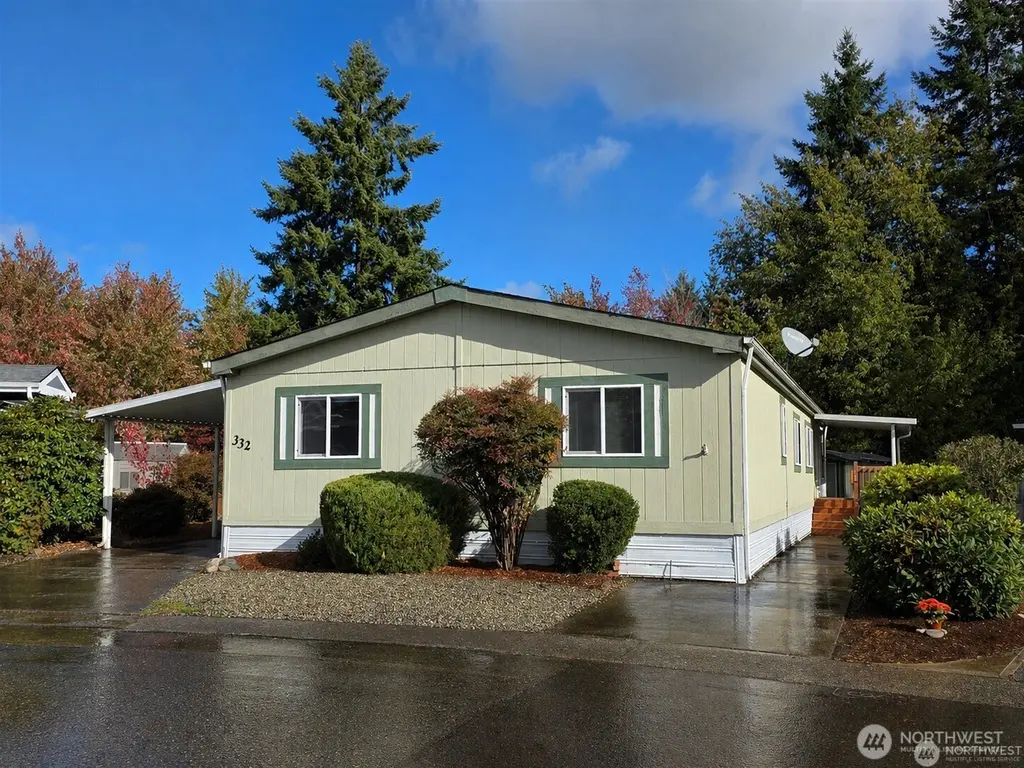
1111 Archwood Dr SW #332 · Olympia, WA
Flood risk No data
- FEMA flood zone
- —
- Chance of flooding over 30 yrs
- —
- Est. flood insurance / yr
- —
Fire risk No data
- Est. fire insurance / yr
- —
Heat risk No data
- Hot days now (above threshold)
- —
- Hot days in 30 yrs
- —
Wind risk No data
- Chance of severe wind over 30 yrs
- —
Air-quality risk No data
- Unhealthy air days now
- —
- Unhealthy air days in 30 yrs
- —
Risk factors via First Street. Map © Google.
Why this score? — see what drove the B+ grade
The composite is a weighted blend of 9 inputs, each scored 0–100. Each bar is that input's sub-score; the figure is the points it added to the 100-point composite (weight × sub-score).
- Cash flow +30.0/30.0
- 1% rule +10.0/10.0
- DSCR +10.0/10.0
- Appreciation +10.0/10.0
- Schools +6.2/10.0
- Livability +4.2/5.0
- Rent growth +3.3/5.0
- Condition / age +2.5/5.0
- ARV discount +0.1/15.0
$140,000
🖨 Deal sheet 📄 Offer letter ✓ Due diligence
Listing remarks
TURN KEY COME AND TAKE A LOOK - ONE OF THE BEST LOTS IN THE COMMUNITY!! Located in the Friendly Ridge 55+ Community, this turnkey 3-bedrom 2-bath home offers over 1,800 sq. ft. of comfortable living on one of the largest premium lots in the park. Step inside to vaulted ceilings, a formal living & dining room, plus a spacious family room off the kitchen. The primary suite features a private bath with walk-in shower and ADA upgrades and a walk-in closet. Recent updates include a new heat pump, furnace, refrigerator, dishwasher and newer water heater. Enjoy two covered patios, a private backyard, and an outbuilding for extra storage. Covered parking with great neighbors plus an additiona
Key facts
- Largest premium lots
- New heat pump
- New furnace
Tags
Property features AI
Finance
- Other: Manufactured home park approved for sale; Mobile home remains; Moduline make, model WAS 090848; Condition: Very good
- Financial info: Land lease: $1,365; Listing terms: Cash or Conventional
- HOA & community: Located in Friendly Ridge park; Senior community; Land lease required
Exterior
- Parking: Carport
- Utilities: Electric energy source; Public water; PSE power; XFinity cable; XFinity internet
- Home design: Manufactured double-wide; One level
- Construction: Wood construction; Composition roof
- Exterior features: Wood exterior; Paved lot; Outbuilding storage in backyard; Has view
Interior
- Kitchen: Dishwasher; Microwave; Refrigerator; Stove/Range
- Bedrooms: Three bedrooms
- Flooring: Laminate; Vinyl; Carpet
- Bathrooms: Two full bathrooms
- Heating & cooling: Forced air heating; Heat pump; Forced air cooling; Heat pump cooling
- Interior features: Den/office; Dining room; Family room; Kitchen with eating space; Living room; Utility room; Vaulted ceilings; Skylights; Ceiling fan(s); Double pane windows; Landscaped; Patio/porch/deck; Awnings; Bath off primary
- Laundry & utility: Washer; Dryer; Utility room
Neighborhood map
What this means for you Summary
Snapshot
- This is a 3-bed/2.0-bath manufactured listed at $140k.
Deal economics
- At list price, monthly cash flow is $915 ($11k/yr) — positive.
- The deal already cash-flows at list — no discount required.
- Meets the 1% rule at list price ($2k rent vs $140k).
- Recommended offer: $136k (3.0% below list) — sets the bar for market timing.
- Cap rate 14.1% vs local median 2.4% in Olympia — top-decile yield for the area; either an underpriced asset or a hidden risk that comps aren't pricing in. Stress-test before assuming the spread holds.
Location & tenants
- Location reads 83/100 on livability (#58 in WA, #1,036 nationally) — a professional / high-income tenant draw. Strengths: amenities A+, commute A+, health & safety A+; Watch: crime F, cost of living D-.
- Olympia School District (urban): math 66% / reading 75% proficiency, ranked #17 of 291 in WA (top 6%) — strong family-tenant draw, lease renewals of 3-5y typical.
- Zoned schools: Capital High School (1,326 students, 38% FRL).
- Market conditions: Rents rising (+3.2%/yr); 304 active listings in the ZIP; 4 comparable units currently listed for rent nearby; rentals lingering (median 44d on market — plan ~5-8 weeks vacancy on turnover, expect pricing pressure); 75% of comp listings sitting > 30 days — soft ceiling on asking rent; solid renter incomes; 1,222 units permitted in Thurston County in 2024 (508 in 5+ unit buildings).
- This rent runs 30% of the median local income ($92k/yr) — at the standard rent-burdened threshold; future hikes will face affordability resistance.
Forward outlook
- In year one you build about $15k of equity ($968 loan paydown + $14k appreciation (10.0% local appreciation)).
- Thurston County population projected at +27% by 2050 — long-run rental-demand tailwind backs the buy-and-hold thesis.
- At projected returns (10.0% appreciation + 3.2% rent growth), your $39k cash investment doubles in ~2 years — after that, you're playing with house money.
- By year 3, paydown + projected appreciation supports a ~$38k cash-out refi (75% LTV) — recoverable capital for the next deal without selling this one.
Negotiation context
- It's been on market 33 days — a 3% lower offer ($136k) is reasonable based on typical stale-listing flexibility.
- 5 sale attempts since 29y ago with the ask held roughly flat each time — persistent listings suggest the price (not the market) is what's stuck; bring a comps-based counter.
- Current owner paid $95k; 47% above their basis — modest negotiation headroom, anchor on the comps not their cost.
Questions for the listing agent
- It's been on market 33 days. Have you received any prior offers? Is the seller open to a 3% concession, seller financing, or rate buy-down credit?
- Is there a deadline driving the sale (1031 exchange, divorce, estate, relocation)? That informs how much negotiation room exists.
- Schools are A-rated — typically a magnet for longer-tenancy family renters. What's the average tenant stay here, and is there a school-zone premium baked into asking?
- Crime grade is F in this area — have there been break-ins, vandalism, or insurance claims at this property in the last 3 years? What carrier currently insures it and at what premium?
- What's the average days-on-market for RENTAL listings here right now (not sales)? A rising rental-DOM trend means longer vacancies and softer asking-rent achievability than the comps imply.
- What's the recent tenant-quality profile in this submarket — average credit score on applications, eviction rate, late-payment / NSF rate, and stable-employment percentage? A property-management company in the area should have these aggregated.
- How much new for-sale + rental construction is in the pipeline within 1–3 miles? Heavy new supply typically softens prices + rents 12–24 months out; constrained supply supports both.
Investment metrics
- 1% rule
- 1.67% ✓
- Cap rate
- 14.13%
- Cash-on-cash
- 28.00%
- DSCR
- 2.25
- GRM
- 5.0
CMA / ARV
- ARV (median comp)
- $120,196
- List price
- $140,000
- Delta
- 16.48%
- Verdict
- OVERPRICED
- Comps
- 20 within 1.0 mi
Show comp detail 5 sales within ~0.75 mi
| Address | Dist | Beds/Ba | Sqft | Sold | Price | $/sf | Match |
|---|---|---|---|---|---|---|---|
| 1111 Archwood Dr SW #226 | 0.21mi | 3/2.0 | 1,792 (+1%) | 16mo | $130,000 | $73 | 76 |
| 1111 Archwood Dr SW #306 | 0.05mi | 3/2.0 | 1,568 (-12%) | 4mo | $75,000 | $48 | 74 |
| 1111 Archwood Dr SW #213 | 0.22mi | 3/2.0 | 1,568 (-12%) | 14mo | $150,000 | $96 | 58 |
| 1111 Archwood Dr SW #202 | 0.22mi | 3/2.0 | 1,568 (-12%) | 14mo | $110,000 | $70 | 58 |
| 1111 Archwood Dr SW #429 | 0.32mi | 3/2.0 | 1,528 (-14%) | 10mo | $75,000 | $49 | 52 |
Match score weights: distance 35% · size 25% · config 20% · recency 20%. Top-matched comps best support the ARV.
Projected returns pro-forma
10.0% appreciation · 3.16% rent growth · sell at horizon
- IRR
- 45.6%
- Equity multiple
- 4.44×
- Total profit
- $134,902
- Equity at exit
- $126,123
- IRR
- 39.6%
- Equity multiple
- 9.99×
- Total profit
- $352,248
- Equity at exit
- $271,989
Cash invested: $39,200 (down + closing). Projections, not guarantees.
Landlord ↔ Tenant lean methodology
- Overall (STATE)
- 28 Tenant-Leaning
- State Washington
- 28 Tenant-Leaning · D+8
- County
- — inherits STATE
- City
- — inherits STATE
ZIP-level market 98502
- Home prices YoY
- 1.8%
- Rents YoY
- 3.2%
- Active inventory
- 304
- Price-to-rent
- 5.0×
Monthly cashflow live
- Estimated rent
- $2,341 medium interval (Pro) →
- Mortgage (P&I)
- −$734
- Tax from tax record
- −$142 /mo · $1,709/yr
- Insurance
- −$58
- HOA
- −$0
- Vacancy / Maint / Mgmt
- −$492
- Net cashflow
- $915
Break-even live
UW: 25.0% down · 7.5% · 30yr · 1.5% tax · 5.0% vac · 8.0% maint · 8.0% mgmt
Financing live
Cash to close
- Down payment
- $35,000
- Closing costs
- $4,200
- Reserves months
- —
- Total cash needed
- —
Loan-product check · same deal, 3 products live
Conventional
25% down · 7.5% · 30yr
- Down + closing
- —
- Monthly P&I
- —
- Monthly cashflow
- —
- DSCR
- —
- Eligible?
- —
Personal DTI + credit; lowest rate.
DSCR
20% down · 8.5% · 30yr
- Down + closing
- —
- Monthly P&I
- —
- Monthly cashflow
- —
- DSCR
- —
- Eligible?
- —
No personal income docs; deal must DSCR.
Hard money
10% down · 12.0% · 12mo
- Down + closing
- —
- Monthly P&I
- —
- Monthly cashflow
- —
- DSCR
- —
- Eligible?
- —
Short-term bridge; refi at stabilization.
Rent comps 4 comps
| Address | Beds | Baths | Sqft | Rent | $/sqft | DOM | Units | Dist |
|---|---|---|---|---|---|---|---|---|
| 4611 Greenwood Dr SW Olympia, WA | 3.0 | 3.0 | 1448 | $2,495 | $1.72 | 43d | 1 | 0.98mi |
| 2137 Conger Ave NW Unit C Olympia, WA | 3.0 | 2.0 | 1248 | $1,895 | $1.52 | 43d | 1 | 0.99mi |
| 2137 Conger Ave NW Unit A Olympia, WA | 3.0 | 2.0 | 1248 | $1,995 | $1.60 | 43d | 1 | 0.99mi |
| 5004 4th Way SW Olympia, WA | 2.0–3.0 | 2.0–2.5 | 1271 | $2,645 | $2.08 | 13d | 5 | 1.35mi |
Listing history 23 events
-
2026-06-13statusdays on market $140,000 Pending 33 DOM
-
2026-06-10days on market $140,000 Active 32 DOM
-
2026-06-09days on market $140,000 Active 31 DOM
-
2026-06-08days on market $140,000 Active 30 DOM
-
2026-06-07days on market $140,000 Active 29 DOM
-
2026-06-05days on market $140,000 Active 26 DOM
-
2026-06-02days on market $140,000 Active 24 DOM
-
2026-06-01days on market $140,000 Active 23 DOM
-
2026-05-31days on market $140,000 Active 22 DOM
-
2026-05-30days on market $140,000 Active 21 DOM
-
2026-05-09$140,000 Active
-
2021-08-06soldstatus $95,000 Closed
-
2021-07-13status Pending
-
2021-06-26$99,900 Active
-
2014-08-21soldstatus $39,900 Sold
-
2014-08-05price $39,900
-
2014-08-04price $44,900
-
2014-05-16price $48,500
-
2014-03-10$52,900 Active
-
2004-03-31soldstatus $66,900
-
2004-02-02$69,900
-
1998-03-06soldstatus $13,900
-
1997-11-22$15,900
ⓘ Source: listings_history table (triggers on properties + properties_extension) + one-shot
backfill from property_details.listing_events for pre-trigger history.
Tax reassessment forecast WA · Resets to sale price
- Current annual tax
- $1,709 · $142/mo
- Projected year-2 tax
- $1,709 · $142/mo
- Expected delta
- $0/yr ($0/mo · 0.0%)
ⓘ Screening estimate from a state-policy table — verify with the county assessor before closing.
Nearby sold comps map
Loading sold comps map…
Walkable amenities ~0.75 mi
Loading nearby amenities…
Taxation est. · year 1
- Rental income
- $28,097
- − Mortgage interest
- −$7,842
- − Property taxes
- −$1,709
- − Insurance
- −$700
- − Repairs & maintenance
- −$2,248
- − Management
- −$2,248
- − Depreciation
- −$4,073
- Taxable income
- $9,277
- Est. tax owed @ 24.0%
- −$2,226
- After-tax cash flow
- $8,751/yr
For passive investors: Depreciation is non-cash, so a rental often shows a tax loss while cash-flowing — sheltering income. Rental losses are passive: they offset passive income freely, and up to $25,000/yr can offset ordinary (W-2) income if you actively participate and your MAGI is under $100k (phasing out to $0 by $150k); unused losses carry forward. On sale, claimed depreciation is recaptured at up to 25%, and gains may owe capital-gains tax (a 1031 exchange can defer both). Figures are a year-1 estimate at your 24.0% rate — not tax advice; consult a CPA.
Schools (NCES district)
- District
- Olympia School District
- NCES district ID
- 5306180
- Math proficiency
- 66% ▼ -2.00%
- Reading proficiency
- 75% ▼ -2.00%
- Median HH income
- $63,852
- Composite
- 62.27/100
- National rank
- #1438
- State rank
- #17 of 291 in WA
Livability — Olympia
- Score
- 83/100
- State rank
- #58
- US rank
- #1036
Category grades
Schools grade is shown separately in the Schools card above.
Census & demographics
- Census place
- Olympia, WA
- County
- Thurston County · 269,345 people
- City population
- 98,428
- Metro
- Olympia-Lacey-Tumwater, WA
- Population (ZIP)
- 35,398
- Household income
- $92,207
- Rent vs Own
- Severe rent burden
- 1811.0
Population outlook (Thurston County) Hauer SSP2
- Today (2025)
- 308,239 people
- By 2030
- 326,483 · +5.9%
- By 2040
- 359,890 · +16.8%
- By 2050
- 391,800 · +27.1%
- By 2075
- 468,024 · +51.8%
- By 2100
- 519,890 · +68.7%
Race, ethnicity, and origin ACS 2023
- Neighborhood character
- Predominantly White (71%)
- Race & ethnicity
- White 71% Two or more races 13% Hispanic / Latino 11% Asian 6% Black 3% Native American 1%
- Hispanic origin (detail)
- Mexican 3% Puerto Rican 4%
- Common ancestry
- Italian 5% Portuguese 4% Iranian 3%
- Foreign-born
- 8% · Vietnam, Canada, China
- Languages at home
- 90% English-only · Spanish 3% Vietnamese 2% Other Asian/Pacific 1%
Political lean MEDSL · Thurston
- 2024 margin
- Strong D (+20.4) · D 58.5% · R 38.1% · Other 3.5%
- 2008→2024 swing
- -1.3pp toward R · 2008: 21.7pp · 2024: 20.4pp
- All cycles
- 2024: D+20.4 2020: D+18.6 2016: D+15.4 2012: D+19.0 2008: D+21.7
Not yet ingested
- Civics
- —
Market trends
- HPI YoY
- ▲ 18.49%
- Current HPI
- 1056.49
- Rent YoY
- ▲ 3.16%
- Metro
- Olympia-Lacey-Tumwater, WA
- State GDP YoY
- ▲ 4.65%
- F500 in state
- 22
Industry mix (Fortune 500 HQ in WA)
| Industry | F500 HQs | Revenue |
|---|---|---|
| Retail | 2 | $269B |
|
||
| Technology / Retail | 1 | $638B |
|
||
| Technology | 1 | $245B |
|
||
| Telecommunications | 1 | $38B |
|
||
| Food / Beverage | 1 | $36B |
|
||
| Automotive / Trucks | 1 | $34B |
|
||
Price history
+780.5% since first listed14 events — show timeline
- 2026-06-11 Pending — NWMLS as Distributed by MLS Grid
- 2026-05-09 Listed $140,000 NWMLS as Distributed by MLS Grid
- 2021-08-06 Sold (MLS) $95,000 NWMLS as Distributed by MLS Grid
- 2021-07-13 Pending — NWMLS as Distributed by MLS Grid
- 2021-06-26 Listed $99,900 NWMLS as Distributed by MLS Grid
- 2014-08-21 Sold (MLS) $39,900 NWMLS as Distributed by MLS Grid
- 2014-08-05 Price Changed $39,900 NWMLS as Distributed by MLS Grid
- 2014-08-04 Price Changed $44,900 NWMLS as Distributed by MLS Grid
- 2014-05-16 Price Changed $48,500 NWMLS as Distributed by MLS Grid
- 2014-03-10 Listed $52,900 NWMLS as Distributed by MLS Grid
- 2004-03-31 Sold (MLS) $66,900 NWMLS as Distributed by MLS Grid
- 2004-02-02 Listed $69,900 NWMLS as Distributed by MLS Grid
- 1998-03-06 Sold (MLS) $13,900 NWMLS as Distributed by MLS Grid
- 1997-11-22 Listed $15,900 NWMLS as Distributed by MLS Grid
Property tax history
+5.1%/yrLatest (2026): $1,709 · +19.4% YoY. Source: county tax records.
Cash-flow waterfall
monthlySold comps — $/sqft
last 12 mo · ≤1 miLoading sold comps…