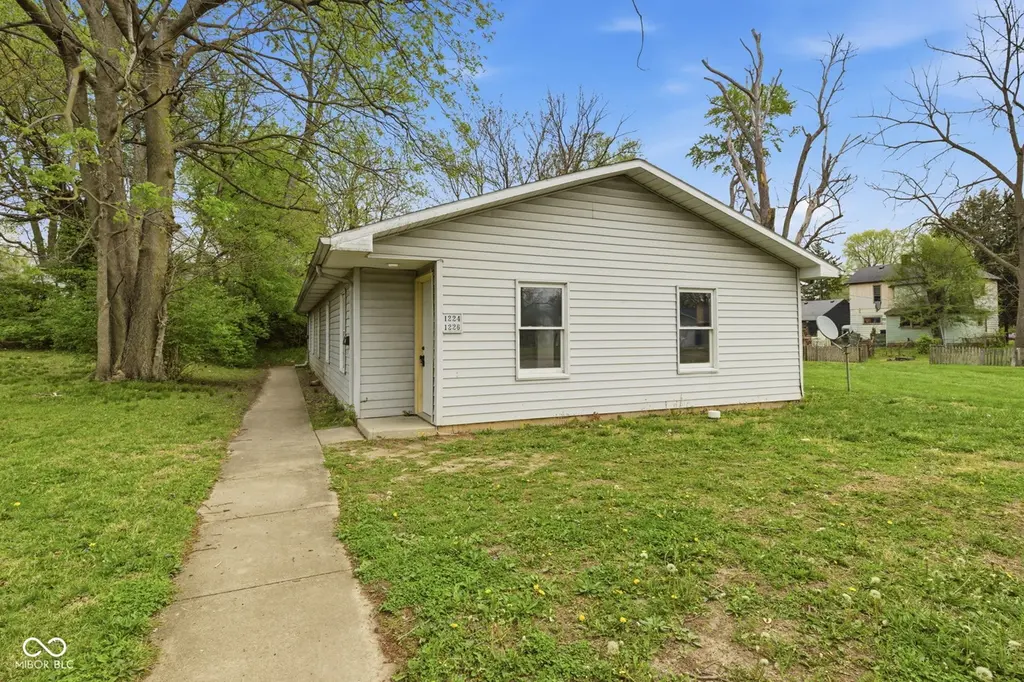
 Duplex
1224 W 13th St · Anderson, IN
Flood risk 1/10 · Minimal
- FEMA flood zone
- X (unshaded)
- Chance of flooding over 30 yrs
- 0.0%
- Est. flood insurance / yr
- $507 – $1,088
Fire risk 1/10 · Minimal
- Est. fire insurance / yr
- $717 – $1,331
Heat risk 3/10 · Minor
- Hot days now (above 100°F)
- 7 days/yr
- Hot days in 30 yrs
- 18 days/yr
Wind risk 2/10 · Minimal
- Chance of severe wind over 30 yrs
- —
Air-quality risk 3/10 · Minor
- Unhealthy air days now
- 2 days/yr
- Unhealthy air days in 30 yrs
- 3 days/yr
Risk factors via First Street. Map © Google.
Why this score? — see what drove the B- grade
The composite is a weighted blend of 9 inputs, each scored 0–100. Each bar is that input's sub-score; the figure is the points it added to the 100-point composite (weight × sub-score).
- Cash flow +30.0/30.0
- 1% rule +10.0/10.0
- DSCR +10.0/10.0
- ARV discount +7.5/15.0
- Rent growth +4.5/5.0
- Livability +3.0/5.0
- Condition / age +2.5/5.0
- Schools +1.6/10.0
- Appreciation +0.0/10.0
$135,000
🖨 Deal sheet (PDF) 📄 Offer letter ✓ Due diligence
Multi-family units
County records classify this as Multi-Family (2-4 Unit). Listing-text estimate: 2 units. confirmed
Listing remarks MLS
Great investment property. 1224 Offers 2 bedrooms with one bath and 1226 is a 3 bedroom with one bath. New carpet and paint in 12-22.
Key facts
- Single level living
- Income producing
- No hoa
Tags
Property features AI
Finance
- Other: Lot under 1/4 acre (approximately 0.14 acre)
- Financial info: Two-unit residential income property; One unit currently shows monthly rent of $825; other unit rent listed as $0; Reported gross income and expenses listed as 0
Exterior
- Parking: Parking lot with 1 assigned space
- Security: Smoke detector(s)
- Utilities: Municipal storm connected; Municipal solid waste service
- Home design: Duplex (attached property); One story; Faces south
- Construction: Vinyl siding
- Exterior features: Access road
Interior
- Kitchen: Eat-in kitchen; Range/oven; Refrigerator
- Bedrooms: Each unit is single-level
- Heating & cooling: Forced heat
- Interior features: Smoke detectors
- Laundry & utility: Washer/dryer connections in units; Forced heat (utilities for units)
Neighborhood map
What this means for you Summary
Snapshot
- This is a 2 × 4-bed/1.5-bath units multifamily listed at $135k.
Deal economics
- At list price, monthly cash flow is $816 ($10k/yr) — positive. Per door: $408/mo.
- The deal already cash-flows at list — no discount required.
- Meets the 1% rule at list price ($2k rent vs $135k).
- Recommended offer: $133k (1.5% below list) — sets the bar for market timing.
- Cap rate 13.5% vs local median 6.1% in Anderson — top-decile yield for the area; either an underpriced asset or a hidden risk that comps aren't pricing in. Stress-test before assuming the spread holds.
Location & tenants
- Location reads 60/100 on livability (#521 in IN) — a middle-class / working-renter tenant base. Strengths: cost of living A+, housing A+; Watch: crime D-, amenities F, commute F.
- Anderson Community School Corporation (urban): math 15% / reading 23% proficiency, ranked #280 of 301 in IN (top 93%) — low school quality limits family demand, transient renter base, plan for 1-2y turnover; 70% free/reduced lunch — lower-income household profile, screen leases tightly.
- Zoned schools: Tenth Street Elementary School (math 13% / reading 10%, grade F, #904 of 994 statewide, top 91%, 462 students, 89% FRL); Highland Middle School (math 9% / reading 22%, grade F, #293 of 330 statewide, top 90%, 914 students, 81% FRL); Anderson High School (math 21% / reading 51%, grade F, #261 of 369 statewide, top 71%, 1,790 students, 76% FRL).
- Market conditions: Rents rising fast (+7.9%/yr); 188 active listings in the ZIP; 40 comparable units currently listed for rent nearby; rentals at typical pace (median 26d on market — plan ~3-4 weeks tenant-placement turnaround); 40% of comp listings sitting > 30 days — soft ceiling on asking rent; lower-income renter base — watch delinquency; 184 units permitted in Madison County in 2024 (0 in 5+ unit buildings).
- At $2,176/mo this rent would consume 72% of the median local household income ($36k/yr) (locally 1193% of renters already pay >50% of income on rent) — very limited rent-growth headroom before tenants either downsize or default.
Forward outlook
- Local home prices are declining (-3.0%/yr); year-one equity from $933 of loan paydown is wiped out by about $4k of value loss. Plan a longer hold.
- Madison County population projected at -14% by 2050 — secular population decline; favor cash flow + early exit over multi-decade hold.
- At projected returns (-3.0% appreciation + 7.9% rent growth), your $38k cash investment doubles in ~4 years — after that, you're playing with house money.
Negotiation context
- It's been on market 20 days — a 2% lower offer ($133k) is reasonable based on typical stale-listing flexibility.
- 10 sale attempts since 24y ago with the ask held roughly flat each time — persistent listings suggest the price (not the market) is what's stuck; bring a comps-based counter.
- Current owner paid $107k; 26% above their basis — modest negotiation headroom, anchor on the comps not their cost.
Questions for the listing agent
- Can we see the unit-by-unit rent roll, current vacancy, and any below-market leases? What's the average tenancy length?
- What capital expenditures (roof, boiler, parking lot, exteriors) have been made in the last 5 years, and what's planned in the next 2?
- Is there a deadline driving the sale (1031 exchange, divorce, estate, relocation)? That informs how much negotiation room exists.
- Schools are F-rated, which usually means shorter tenancies and higher turnover. Who's the typical renter profile here, and what's been the actual vacancy rate?
- Crime grade is D in this area — have there been break-ins, vandalism, or insurance claims at this property in the last 3 years? What carrier currently insures it and at what premium?
- What's the average days-on-market for RENTAL listings here right now (not sales)? A rising rental-DOM trend means longer vacancies and softer asking-rent achievability than the comps imply.
- What's the recent tenant-quality profile in this submarket — average credit score on applications, eviction rate, late-payment / NSF rate, and stable-employment percentage? A property-management company in the area should have these aggregated.
- How much new apartment / multifamily construction is in the pipeline within 1–3 miles? Heavy new supply (>2% of stock underway) typically softens rents 12–24 months out; light construction supports rent growth.
Investment metrics
- 1% rule
- 1.61% ✓
- Cap rate
- 13.55%
- Cash-on-cash
- 25.91%
- DSCR
- 2.15
- GRM
- 5.2
CMA / ARV
No comps found within radius.
Projected returns pro-forma
-3.0% appreciation · 7.88% rent growth · sell at horizon
- IRR
- 24.9%
- Equity multiple
- 2.09×
- Total profit
- $41,340
- Equity at exit
- $20,129
- IRR
- 35.6%
- Equity multiple
- 5.07×
- Total profit
- $153,897
- Equity at exit
- $11,672
Cash invested: $37,800 (down + closing). Projections, not guarantees.
Landlord ↔ Tenant lean methodology
- Overall (STATE)
- 90 Strongly Landlord-Friendly
- State Indiana
- 90 Strongly Landlord-Friendly · R+11
- County
- — inherits STATE
- City
- — inherits STATE
ZIP-level market 46016
- Home prices YoY
- -3.5%
- Rents YoY
- 7.9%
- Active inventory
- 188
- Price-to-rent
- 10.3×
Monthly cashflow live
- Estimated rent
- $2,176 medium interval (Pro) →
- Mortgage (P&I)
- −$708
- Tax from tax record
- −$139 /mo · $1,662/yr
- Insurance
- −$56
- HOA
- −$0
- Vacancy / Maint / Mgmt
- −$457
- Net cashflow
- $816
Break-even live
Sensitivity live
| Price | -10% $893 | -5% $855 | +0% $816 | +5% $778 | +10% $740 |
|---|---|---|---|---|---|
| Rent | -10% $644 | -5% $730 | +0% $816 | +5% $902 | +10% $988 |
| Rate | -1.0pp $884 | -0.5pp $851 | base $816 | +0.5pp $781 | +1.0pp $746 |
2-unit breakdown (identical units grouped — click to expand)
| Units | Beds | Baths | Est. rent |
|---|---|---|---|
| 2× units | 4 | 1.5 | $2,176 |
| #1 | 4 | 1.5 | $1,088 |
| #2 | 4 | 1.5 | $1,088 |
| Total (2 units) | $2,176 | ||
UW: 25.0% down · 7.5% · 30yr · 1.5% tax · 5.0% vac · 8.0% maint · 8.0% mgmt
Financing live
Cash to close
- Down payment
- $33,750
- Closing costs
- $4,050
- Reserves months
- —
- Total cash needed
- —
Loan-product check · same deal, 3 products live
Conventional
25% down · 7.5% · 30yr
- Down + closing
- —
- Monthly P&I
- —
- Monthly cashflow
- —
- DSCR
- —
- Eligible?
- —
Personal DTI + credit; lowest rate.
DSCR
20% down · 8.5% · 30yr
- Down + closing
- —
- Monthly P&I
- —
- Monthly cashflow
- —
- DSCR
- —
- Eligible?
- —
No personal income docs; deal must DSCR.
Hard money
10% down · 12.0% · 12mo
- Down + closing
- —
- Monthly P&I
- —
- Monthly cashflow
- —
- DSCR
- —
- Eligible?
- —
Short-term bridge; refi at stabilization.
Rent comps 40 comps
| Address | Beds | Baths | Sqft | Rent | $/sqft | DOM | Units | Dist |
|---|---|---|---|---|---|---|---|---|
| 1222 Nichol Ave Unit 4 Anderson, IN | 3.0 | 1.0 | 1000 | $1,135 | $1.14 | 0d | 1 | 0.08mi |
| 1222 Nichol Ave Unit 4 Anderson, IN | 3.0 | 1.0 | 1000 | $1,135 | $1.14 | 9d | 1 | 0.08mi |
| 1502 Cedar St Anderson, IN | 2.0 | 1.0 | 1104 | $850 | $0.77 | 45d | 1 | 0.18mi |
| 1616 W 16th St Anderson, IN | 2.0 | 1.0 | 1038 | $1,050 | $1.01 | 45d | 1 | 0.33mi |
| 1640 W 17th St Anderson, IN | 2.0 | 1.0 | 810 | $895 | $1.10 | 22d | 1 | 0.40mi |
| 1312 W 8th St Unit 1332 F Anderson, IN | 2.0 | 1.0 | 850 | $979 | $1.15 | 45d | 1 | 0.41mi |
| 1312 W 8th St Unit 1308H Anderson, IN | 1.0 | 1.0 | 750 | $999 | $1.33 | 16d | 1 | 0.41mi |
| 1614 W 18th St Anderson, IN | 2.0 | 1.0 | 690 | $975 | $1.41 | 25d | 1 | 0.41mi |
| 803 1/2 W 9th St Anderson, IN | 1.0 | 1.0 | 600 | $525 | $0.88 | 45d | 1 | 0.42mi |
| 1123 Louise St Anderson, IN | 2.0 | 1.0 | 850 | $850 | $1.00 | 45d | 1 | 0.46mi |
| 1631 W 7th St Anderson, IN | 3.0 | 1.0 | 900 | $1,000 | $1.11 | 45d | 1 | 0.50mi |
| 1136 Irving Way Anderson, IN | 2.0 | 1.0 | 900 | $895 | $0.99 | 23d | 1 | 0.50mi |
| 1720 Nelle St Anderson, IN | 2.0 | 1.0 | 768 | $1,100 | $1.43 | 25d | 1 | 0.51mi |
| 1627 W 6th St Anderson, IN | 2.0 | 1.0 | 650 | $850 | $1.31 | 25d | 1 | 0.55mi |
| 925 W 5th St Unit 1 Anderson, IN | 1.0 | 1.0 | 617 | $775 | $1.26 | 18d | 1 | 0.56mi |
| 1708 W 7th St Anderson, IN | 1.0 | 1.0 | 700 | $875 | $1.25 | 19d | 1 | 0.56mi |
| 1708 W 7th St Anderson, IN | 1.0 | 1.0 | 700 | $1,000 | $1.43 | 45d | 1 | 0.56mi |
| 1708 W 7th St Anderson, IN | 1.0 | 1.0 | 700 | $875 | $1.25 | 21d | 1 | 0.56mi |
| 1020 W 5th St Unit 1022 Anderson, IN | 1.0 | 1.0 | 550 | $750 | $1.36 | 45d | 1 | 0.56mi |
| 924 W 5th St Unit 928 Anderson, IN | 1.0 | 1.0 | 600 | $600 | $1.00 | 45d | 1 | 0.59mi |
| 924 W 5th St Unit 924 Anderson, IN | 1.0 | 1.0 | 750 | $600 | $0.80 | 25d | 1 | 0.59mi |
| 2004 Arrow Ave Anderson, IN | 2.0 | 1.0 | 816 | $1,125 | $1.38 | 25d | 1 | 0.59mi |
| 1404 Walton St Anderson, IN | 3.0 | 1.0 | 1090 | $995 | $0.91 | 45d | 1 | 0.64mi |
| 2208 Hendricks St Unit 3 Anderson, IN | 1.0 | 1.0 | 585 | $600 | $1.03 | 0d | 1 | 0.66mi |
| 618 W 22nd St Anderson, IN | 3.0 | 1.0 | 900 | $1,250 | $1.39 | 45d | 1 | 0.69mi |
| 215 S Madison Ave Anderson, IN | 1.0 | 1.0 | 600 | $650 | $1.08 | 45d | 1 | 0.73mi |
| 702 W 23rd St Anderson, IN | 1.0 | 1.0 | 560 | $595 | $1.06 | 6d | 1 | 0.73mi |
| 213 Madison Ave Anderson, IN | 1.0 | 1.0 | 600 | $650 | $1.08 | 45d | 1 | 0.73mi |
| 2301 Sheridan St Anderson, IN | 2.0 | 1.0 | 900 | $950 | $1.06 | 45d | 1 | 0.74mi |
| 1529 W 2nd St Anderson, IN | 3.0 | 1.0 | 884 | $1,200 | $1.36 | 25d | 1 | 0.75mi |
| 120 W 10th St Anderson, IN | 1.0–3.0 | 1.0 | 1066 | $1,025 | $0.96 | 0d | 1 | 0.75mi |
| 1010 W 2nd St Unit 2 Anderson, IN | 2.0 | 1.0 | 875 | $1,025 | $1.17 | 23d | 1 | 0.76mi |
| 1010 W 2nd St Unit 3 Anderson, IN | 3.0 | 1.0 | 1025 | $1,125 | $1.10 | 16d | 1 | 0.76mi |
| 1010 W 2nd St Unit 1 Anderson, IN | 1.0 | 1.0 | 724 | $925 | $1.28 | 25d | 1 | 0.76mi |
| 2411 Hendricks St Anderson, IN | 3.0 | 1.0 | 860 | $1,000 | $1.16 | 25d | 1 | 0.79mi |
| 519 W 2nd St Anderson, IN | 1.0 | 1.0 | 650 | $800 | $1.23 | 45d | 1 | 0.86mi |
| 1317 Main St Unit D Anderson, IN | 2.0 | 1.0 | 834 | $725 | $0.87 | 0d | 1 | 0.88mi |
| 1317 Main St Anderson, IN | 2.0 | 1.0 | 750 | $800 | $1.07 | 45d | 1 | 0.88mi |
| 1807 Meridian St Apt 4 Anderson, IN | 2.0 | 1.0 | 600 | $675 | $1.12 | 0d | 1 | 0.89mi |
| 506 W 2nd St Anderson, IN | 3.0 | 1.0 | 964 | $1,095 | $1.14 | 25d | 1 | 0.89mi |
Listing history 28 events
-
2026-06-05statusdays on market $135,000 Pending 20 DOM
-
2026-06-03days on market $135,000 Active 19 DOM
-
2026-06-02days on market $135,000 Active 18 DOM
-
2026-06-01days on market $135,000 Active 17 DOM
-
2026-05-31days on market $135,000 Active 16 DOM
-
2026-04-29status Pending
-
2026-04-16$135,000 Active
-
2023-10-13soldstatus $107,000 Closed 134-char remark
Show marketing remark (134 chars)
Great investment property. 1224 Offers 2 bedrooms with one bath and 1226 is a 3 bedroom with one bath. New carpet and paint in 12-22.
-
2023-08-25status Pending 134-char remark
Show marketing remark (134 chars)
Great investment property. 1224 Offers 2 bedrooms with one bath and 1226 is a 3 bedroom with one bath. New carpet and paint in 12-22.
-
2023-07-25$125,000 Active 134-char remark
Show marketing remark (134 chars)
Great investment property. 1224 Offers 2 bedrooms with one bath and 1226 is a 3 bedroom with one bath. New carpet and paint in 12-22.
-
2016-04-01soldstatus $34,000 Sold 250-char remark
Show marketing remark (250 chars)
Updated duplex this is clean and freshly painted. Property has newer flooring and a newer furnace. Each tenant pays their own utilities. Each unit has a stove and refrigerator. Nice income or live in one side and rent out the other. Nice duplex.
-
2016-03-22status Pending 250-char remark
Show marketing remark (250 chars)
Updated duplex this is clean and freshly painted. Property has newer flooring and a newer furnace. Each tenant pays their own utilities. Each unit has a stove and refrigerator. Nice income or live in one side and rent out the other. Nice duplex.
-
2015-11-09$34,900 Active 250-char remark
Show marketing remark (250 chars)
Updated duplex this is clean and freshly painted. Property has newer flooring and a newer furnace. Each tenant pays their own utilities. Each unit has a stove and refrigerator. Nice income or live in one side and rent out the other. Nice duplex.
-
2011-09-23historical
-
2011-09-22soldstatus $15,000
-
2011-08-03historical
-
2011-08-02$16,500
-
2011-08-02$16,500
-
2011-06-24historical
-
2011-03-25historical
-
2011-03-23$29,000
-
2009-09-25$29,000
-
2006-09-11soldstatus $21,500
-
2006-06-08$23,900
-
2005-11-24historical
-
2005-01-24$57,000
-
2003-06-09soldstatus $56,375
-
2002-01-30$61,000
ⓘ Source: listings_history table (triggers on properties + properties_extension) + one-shot
backfill from property_details.listing_events for pre-trigger history.
Tax reassessment forecast IN · Partial reset (capped growth)
- Current annual tax
- $1,662 · $139/mo
- Projected year-2 tax
- $1,662 · $139/mo
- Expected delta
- $0/yr ($0/mo · 0.0%)
ⓘ Screening estimate from a state-policy table — verify with the county assessor before closing.
Climate risk First Street
- Flood 1/10 Low FEMA zone X (unshaded) · 0% chance over 30 yrs
- Wildfire 1/10 Low
- Heat 3/10 Moderate 7 d/yr ≥100°F today · 18 d/yr by 30 yrs out
- Wind 2/10 Low
- Air quality 3/10 Moderate 2 unhealthy d/yr today · 3 by 30 yrs out
Nearby sold comps map
Loading sold comps map…
Walkable amenities ~0.75 mi
Loading nearby amenities…
Taxation est. · year 1
- Rental income
- $26,112
- − Mortgage interest
- −$7,562
- − Property taxes
- −$1,662
- − Insurance
- −$675
- − Repairs & maintenance
- −$2,089
- − Management
- −$2,089
- − Depreciation
- −$3,927
- Taxable income
- $8,107
- Est. tax owed @ 24.0%
- −$1,946
- After-tax cash flow
- $7,850/yr
For passive investors: Depreciation is non-cash, so a rental often shows a tax loss while cash-flowing — sheltering income. Rental losses are passive: they offset passive income freely, and up to $25,000/yr can offset ordinary (W-2) income if you actively participate and your MAGI is under $100k (phasing out to $0 by $150k); unused losses carry forward. On sale, claimed depreciation is recaptured at up to 25%, and gains may owe capital-gains tax (a 1031 exchange can defer both). Figures are a year-1 estimate at your 24.0% rate — not tax advice; consult a CPA.
Schools (NCES district)
- District
- Anderson Community School Corporation
- NCES district ID
- 1800150
- Math proficiency
- 15% ▼ -14.00%
- Reading proficiency
- 23% ▼ -7.00%
- Median HH income
- $38,208
- Composite
- 15.93/100
- National rank
- #9250
- State rank
- #280 of 301 in IN
Livability — Anderson
- Score
- 60/100
- State rank
- #521
- US rank
- #18709
Category grades
Schools grade is shown separately in the Schools card above.
Census & demographics
- Census place
- Anderson, IN
- County
- Madison County · 69,445 people
- City population
- 57,762
- Metro
- Indianapolis-Carmel-Anderson, IN
- Population (ZIP)
- 17,834
- Household income
- $36,029
- Rent vs Own
- Severe rent burden
- 1193.0
Population outlook (Madison County) Hauer SSP2
- Today (2025)
- 125,800 people
- By 2030
- 122,640 · -2.5%
- By 2040
- 115,420 · -8.3%
- By 2050
- 108,148 · -14.0%
- By 2075
- 91,838 · -27.0%
- By 2100
- 75,670 · -39.8%
Race, ethnicity, and origin ACS 2023
- Neighborhood character
- Diverse neighborhood (Simpson 0.58)
- Race & ethnicity
- White 61% Black 18% Hispanic / Latino 13% Two or more races 11% Native American 1%
- Hispanic origin (detail)
- Mexican 10% Puerto Rican 1%
- Common ancestry
- Italian 2% Slovak 1% Iranian 1%
- Foreign-born
- 4% · Canada
- Languages at home
- 86% English-only · Spanish 12%
Political lean MEDSL · Madison
- 2024 margin
- Strong R (+26.9) · D 35.6% · R 62.5% · Other 1.9%
- 2008→2024 swing
- -33.5pp toward R · 2008: 6.5pp · 2024: -26.9pp
- All cycles
- 2024: R+26.9 2020: R+22.6 2016: R+25.7 2012: R+4.5 2008: D+6.5
Not yet ingested
- Civics
- —
Market trends
- HPI YoY
- ▼ -11.12%
- Current HPI
- 302.7437
- Rent YoY
- ▲ 7.88%
- Metro
- Indianapolis-Carmel-Anderson, IN
- State GDP YoY
- ▲ 2.90%
- F500 in state
- 18
Industry mix (Fortune 500 HQ in IN)
| Industry | F500 HQs | Revenue |
|---|---|---|
| Industrial Machinery | 2 | $37B |
|
||
| Healthcare | 1 | $177B |
|
||
| Pharmaceuticals | 1 | $45B |
|
||
| Metals / Steel | 1 | $18B |
|
||
| Agriculture | 1 | $17B |
|
||
| Packaging | 1 | $12B |
|
||
Price history
+121.3% since first listed23 events — show timeline
- 2026-04-29 Pending — MIBOR as Distributed by MLS Grid
- 2026-04-16 Listed $135,000 MIBOR as Distributed by MLS Grid
- 2023-10-13 Sold (MLS) $107,000 MIBOR as Distributed by MLS Grid
- 2023-08-25 Pending — MIBOR as Distributed by MLS Grid
- 2023-07-25 Listed $125,000 MIBOR as Distributed by MLS Grid
- 2016-04-01 Sold (MLS) $34,000 MIBOR as Distributed by MLS Grid
- 2016-03-22 Pending — MIBOR as Distributed by MLS Grid
- 2015-11-09 Listed $34,900 MIBOR as Distributed by MLS Grid
- 2011-09-23 Listing Removed — MIBOR as Distributed by MLS Grid
- 2011-09-22 Sold (MLS) $15,000 MIBOR as Distributed by MLS Grid
- 2011-08-03 Listing Removed — MIBOR as Distributed by MLS Grid
- 2011-08-02 Listed $16,500 MIBOR as Distributed by MLS Grid
- 2011-08-02 Listed $16,500 MIBOR as Distributed by MLS Grid
- 2011-06-24 Listing Removed — MIBOR as Distributed by MLS Grid
- 2011-03-25 Listing Removed — MIBOR as Distributed by MLS Grid
- 2011-03-23 Listed $29,000 MIBOR as Distributed by MLS Grid
- 2009-09-25 Listed $29,000 MIBOR as Distributed by MLS Grid
- 2006-09-11 Sold (MLS) $21,500 MIBOR as Distributed by MLS Grid
- 2006-06-08 Listed $23,900 MIBOR as Distributed by MLS Grid
- 2005-11-24 Listing Removed — MIBOR as Distributed by MLS Grid
- 2005-01-24 Listed $57,000 MIBOR as Distributed by MLS Grid
- 2003-06-09 Sold (MLS) $56,375 MIBOR as Distributed by MLS Grid
- 2002-01-30 Listed $61,000 MIBOR as Distributed by MLS Grid
Property tax history
+7.4%/yrLatest (2024): $1,662 · +9.3% YoY. Source: county tax records.
Cash-flow waterfall
monthlySold comps — $/sqft
last 12 mo · ≤1 miLoading sold comps…