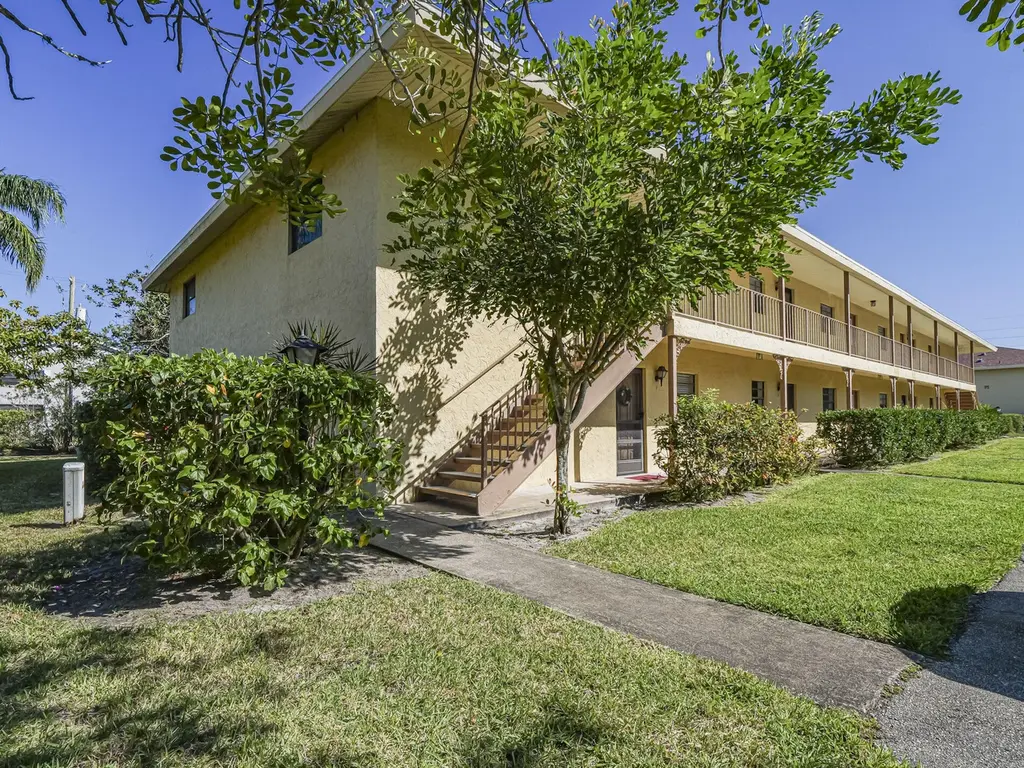
400 18th St Unit G2 · Vero Beach, FL
Flood risk 9/10 · Severe
- FEMA flood zone
- X (shaded)
- Chance of flooding over 30 yrs
- 0.99%
- Est. flood insurance / yr
- $507 – $1,088
Fire risk 2/10 · Minimal
- Est. fire insurance / yr
- $947 – $1,759
Heat risk 10/10 · Severe
- Hot days now (above 105°F)
- 7 days/yr
- Hot days in 30 yrs
- 25 days/yr
Wind risk 10/10 · Severe
- Chance of severe wind over 30 yrs
- 99.0%
Air-quality risk 1/10 · Minimal
- Unhealthy air days now
- 0 days/yr
- Unhealthy air days in 30 yrs
- 0 days/yr
Risk factors via First Street. Map © Google.
Why this score? — see what drove the D grade
The composite is a weighted blend of 9 inputs, each scored 0–100. Each bar is that input's sub-score; the figure is the points it added to the 100-point composite (weight × sub-score).
- Cash flow +9.9/30.0
- 1% rule +8.0/10.0
- ARV discount +7.5/15.0
- Schools +4.2/10.0
- Livability +4.0/5.0
- DSCR +2.8/10.0
- Condition / age +2.5/5.0
- Rent growth +2.1/5.0
- Appreciation +0.0/10.0
$149,000
🖨 Deal sheet 📄 Offer letter ✓ Due diligence
Listing remarks MLS
Remodeled first floor unit with newer appliances, tile floors and great layout! Oak Park Terrace is a vibrant 55+ community less than 2 miles to beaches. Community features pool and tennis and close proximity to shops and restaurants.
Key facts
- Tennis
- Tile floors
- Newer appliances
Tags
Property features AI
Finance
- Other: Pets not allowed
- HOA & community: Monthly HOA fee ($597) covering grounds maintenance, trash, and recreation facility; Senior community
Exterior
- Parking: Assigned parking (1 space)
- Security: Part of an association (community amenities and managed grounds)
- Utilities: Public water; Public sewer; Electricity connected; Cable available; Sewer connected; Water connected
- Home design: Condominium; Single-story; Faces west; Resale property
- Construction: Concrete construction; Other roof type
- Exterior features: Not waterfront; Clubhouse, community pool, and tennis courts (association amenities)
Interior
- Kitchen: Electric range; Dishwasher; Microwave; Refrigerator; Electric water heater
- Bedrooms: 2 bedrooms on the main level
- Flooring: Tile flooring
- Bathrooms: 2 full bathrooms on the main level
- Heating & cooling: Central heating; Central air; Ceiling fans
- Interior features: Split bedroom layout
- Laundry & utility: Laundry: Other (on-site/unknown location)
Neighborhood map
What this means for you Summary
Snapshot
- This is a 2-bed/2.0-bath condo listed at $149k.
Deal economics
- At list price, monthly cash flow is $-158 ($-2k/yr) — negative.
- To cash-flow at today's rent, offer at most $121k (18.7% below list).
- Meets the 1% rule at list price ($2k rent vs $149k).
- Recommended offer: $121k (18.7% below list) — sets the bar for cash-flow.
- Cap rate 5.6% vs local median 2.9% in Vero Beach — top-decile yield for the area; either an underpriced asset or a hidden risk that comps aren't pricing in. Stress-test before assuming the spread holds.
Location & tenants
- Location reads 80/100 on livability (#116 in FL, #1,784 nationally) — a professional / high-income tenant draw. Strengths: crime A+, commute A+, health & safety A+; Watch: employment D+, amenities D.
- Indian River (other): math 48% / reading 52% proficiency, ranked #35 of 73 in FL (top 48%) — acceptable for families but not a draw, mixed tenant base, ~2y average lease.
- Zoned schools: Beachland Elementary School (math 54% / reading 58%, grade C+, #832 of 2,144 statewide, top 40%, 523 students, 39% FRL); Gifford Middle School (math 46% / reading 45%, grade D+, #305 of 571 statewide, top 54%, 582 students, 72% FRL); Vero Beach High School (math 28% / reading 43%, grade F, #367 of 667 statewide, top 57%, 2,847 students, 50% FRL) — zoned schools at 54% FRL track the district average.
- Market conditions: Rents soft (-1.7%/yr); 206 active listings in the ZIP; 40 comparable units currently listed for rent nearby; rentals at typical pace (median 21d on market — plan ~3-4 weeks tenant-placement turnaround); 564 units permitted in Indian River County in 2024 (281 in 5+ unit buildings).
- This rent runs 42% of the median local income ($55k/yr) — at the standard rent-burdened threshold; future hikes will face affordability resistance.
Forward outlook
- Local home prices are declining (-3.0%/yr); year-one equity from $1k of loan paydown is wiped out by about $4k of value loss. Plan a longer hold.
- Indian River County population projected at +18% by 2050 — long-run rental-demand tailwind backs the buy-and-hold thesis.
Negotiation context
- Only 1 days on market — expect competitive offers; lowballing is unlikely to land.
- 11 sale attempts since 11y ago with the ask held roughly flat each time — persistent listings suggest the price (not the market) is what's stuck; bring a comps-based counter.
- Current owner paid $70k; list at $149k implies a 111% gain — meaningful room to come down on a strong offer.
Risks & watch-outs
- Watch-outs: flood insurance adds $66/mo; HOA is 31% of rent.
- Climate carrying-cost: severe flood risk; severe wind risk, 99% chance of damaging wind over 30y; extreme-heat days projected 7→25/yr by 2055 (HVAC capex compounding) — expect insurance premiums to compound above CPI over the hold.
Questions for the listing agent
- What do current leases actually rent for vs. the listed asking? Can we see a recent rent roll and the last 12 months of T-12 income?
- What's the actual annual flood-insurance premium (NFIP or private), and is the property in a SFHA with mandatory coverage?
- What does the HOA fee cover, when was the last increase, and are there any pending special assessments or reserve-fund shortfalls?
- Any open or pending special assessments — roof, HVAC, plumbing, elevator, façade? What's the per-unit balance and payoff schedule, and is the seller paying it off at close or rolling it to the buyer?
- Is there a deadline driving the sale (1031 exchange, divorce, estate, relocation)? That informs how much negotiation room exists.
- The area grade is low — what's the realistic commute time and amenity access for the typical tenant pool here? Any planned neighborhood developments (good or bad) we should know about?
- What's the average days-on-market for RENTAL listings here right now (not sales)? A rising rental-DOM trend means longer vacancies and softer asking-rent achievability than the comps imply.
- What's the recent tenant-quality profile in this submarket — average credit score on applications, eviction rate, late-payment / NSF rate, and stable-employment percentage? A property-management company in the area should have these aggregated.
- How much new apartment / multifamily construction is in the pipeline within 1–3 miles? Heavy new supply (>2% of stock underway) typically softens rents 12–24 months out; light construction supports rent growth.
Investment metrics
- 1% rule
- 1.30% ✓
- Cap rate
- 5.56%
- Cash-on-cash
- -2.63%
- DSCR
- 0.88
- GRM
- 6.4
CMA / ARV
No comps found within radius.
Projected returns pro-forma
-3.0% appreciation · 0.0% rent growth · sell at horizon
- IRR
- -29.7%
- Equity multiple
- 0.05×
- Total profit
- $-39,440
- Equity at exit
- $22,216
- IRR
- -70.9%
- Equity multiple
- -0.62×
- Total profit
- $-67,434
- Equity at exit
- $12,883
Cash invested: $41,720 (down + closing). Projections, not guarantees.
Landlord ↔ Tenant lean methodology
- Overall (STATE)
- 87 Strongly Landlord-Friendly
- State Florida
- 87 Strongly Landlord-Friendly · R+3
- County
- — inherits STATE
- City
- — inherits STATE
ZIP-level market 32960
- Home prices YoY
- -25.5%
- Rents YoY
- -1.7%
- Active inventory
- 206
- Price-to-rent
- 6.4×
Monthly cashflow live
- Estimated rent
- $1,932 high interval (Pro) →
- Mortgage (P&I)
- −$781
- Tax from tax record
- −$178 /mo · $2,131/yr
- Insurance
- −$62
- Flood insurance flood zone
- −$66 /mo · $798/yr
- HOA
- −$597
- Vacancy / Maint / Mgmt
- −$406
- Net cashflow
- $-158
Break-even live
UW: 25.0% down · 7.5% · 30yr · 1.5% tax · 5.0% vac · 8.0% maint · 8.0% mgmt
Financing live
Cash to close
- Down payment
- $37,250
- Closing costs
- $4,470
- Reserves months
- —
- Total cash needed
- —
Loan-product check · same deal, 3 products live
Conventional
25% down · 7.5% · 30yr
- Down + closing
- —
- Monthly P&I
- —
- Monthly cashflow
- —
- DSCR
- —
- Eligible?
- —
Personal DTI + credit; lowest rate.
DSCR
20% down · 8.5% · 30yr
- Down + closing
- —
- Monthly P&I
- —
- Monthly cashflow
- —
- DSCR
- —
- Eligible?
- —
No personal income docs; deal must DSCR.
Hard money
10% down · 12.0% · 12mo
- Down + closing
- —
- Monthly P&I
- —
- Monthly cashflow
- —
- DSCR
- —
- Eligible?
- —
Short-term bridge; refi at stabilization.
Rent comps 40 comps
| Address | Beds | Baths | Sqft | Rent | $/sqft | DOM | Units | Dist |
|---|---|---|---|---|---|---|---|---|
| 400 18th St Vero Beach, FL | 2.0 | 2.0 | 1065 | $1,512 | $1.42 | 13d | 2 | 0.10mi |
| 400 18th St Vero Beach, FL | 2.0 | 2.0 | 1065 | $1,575 | $1.48 | 21d | 1 | 0.10mi |
| 1765 6th Ave Vero Beach, FL | 2.0 | 1.0 | 800 | $1,550 | $1.94 | 21d | 1 | 0.12mi |
| 635 18th Pl Vero Beach, FL | 3.0 | 2.0 | 1120 | $2,300 | $2.05 | 21d | 1 | 0.14mi |
| 1745 6th Ave Unit 7(R) Vero Beach, FL | 2.0 | 1.0 | 800 | $1,550 | $1.94 | 21d | 1 | 0.15mi |
| 303 18th Pl Vero Beach, FL | 2.0 | 1.5 | 1200 | $1,599 | $1.33 | 21d | 1 | 0.20mi |
| 315 18th Pl Unit 315 Vero Beach, FL | 2.0 | 1.5 | 1200 | $1,599 | $1.33 | 21d | 1 | 0.22mi |
| 686 17th St Vero Beach, FL | 2.0 | 1.0 | 950 | $1,700 | $1.79 | 13d | 2 | 0.22mi |
| 1801 Indian River Blvd Unit C7 Vero Beach, FL | 2.0 | 2.0 | 1200 | $1,700 | $1.42 | 13d | 1 | 0.24mi |
| 1845 Robalo Dr Unit 205 Vero Beach, FL | 2.0 | 2.0 | 1000 | $2,500 | $2.50 | 21d | 1 | 0.32mi |
| 1873 Robalo Dr Vero Beach, FL | 2.0 | 2.0 | 1152 | $2,300 | $2.00 | 21d | 1 | 0.32mi |
| 1953 Robalo Dr Vero Beach, FL | 2.0 | 2.0 | 1400 | $5,000 | $3.57 | 21d | 1 | 0.34mi |
| 1860 Robalo Dr Vero Beach, FL | 2.0 | 2.0 | 950 | $2,600 | $2.74 | 21d | 2 | 0.36mi |
| 1935 Cobia Dr Unit 202E Vero Beach, FL | 2.0 | 2.0 | 1000 | $2,250 | $2.25 | 21d | 1 | 0.41mi |
| 1510 3rd Ct Vero Beach, FL | 3.0 | 2.0 | 950 | $6,000 | $6.32 | 13d | 1 | 0.46mi |
| 1450 5th Ave Vero Beach, FL | 3.0 | 2.0 | 1124 | $2,400 | $2.14 | 21d | 1 | 0.49mi |
| 677 Royal Palm Blvd #22 Vero Beach, FL | 2.0 | 2.0 | 1200 | $1,700 | $1.42 | 13d | 1 | 0.51mi |
| 1840 Tarpon Ln Unit D202 Vero Beach, FL | 2.0 | 2.0 | 1400 | $2,500 | $1.79 | 21d | 1 | 0.52mi |
| 808 22nd St Unit 8 Vero Beach, FL | 2.0 | 2.0 | 1000 | $1,465 | $1.47 | 21d | 1 | 0.52mi |
| 939 19th St Unit 961 Vero Beach, FL | 2.0 | 2.0 | 1000 | $1,850 | $1.85 | 21d | 1 | 0.53mi |
| 516 13th Pl Vero Beach, FL | 3.0 | 2.0 | 1102 | $1,800 | $1.63 | 21d | 1 | 0.57mi |
| 974 14th Ln Vero Beach, FL | 1.0–3.0 | 1.0–3.0 | 1828 | $4,049 | $2.21 | 13d | 32 | 0.57mi |
| 600 Royal Palm Blvd Unit 1A Vero Beach, FL | 2.0 | 2.0 | 1400 | $2,000 | $1.43 | 21d | 1 | 0.58mi |
| 923 22nd Pl #106 Vero Beach, FL | 2.0 | 2.0 | 860 | $1,600 | $1.86 | 21d | 1 | 0.61mi |
| 1200 6th Dr Vero Beach, FL | 2.0 | 2.0 | 800 | $1,550 | $1.94 | 13d | 1 | 0.80mi |
| 1100 Ponce de Leon Cir #305 Vero Beach, FL | 2.0 | 2.0 | 840 | $1,350 | $1.61 | 21d | 1 | 0.81mi |
| 1170 6th Ave Unit 2D Vero Beach, FL | 2.0 | 2.5 | 1170 | $1,800 | $1.54 | 13d | 1 | 0.83mi |
| 2222 Ponce De Leon Cir Unit B Vero Beach, FL | 2.0 | 1.0 | 970 | $1,650 | $1.70 | 13d | 1 | 0.83mi |
| 1135 3rd Ave #101 Vero Beach, FL | 2.0 | 2.0 | 906 | $1,800 | $1.99 | 21d | 1 | 0.88mi |
| 1166 6th Ave Vero Beach, FL | 2.0 | 2.0 | 1140 | $2,200 | $1.93 | 13d | 1 | 0.89mi |
| 1166 6th Ave Unit D Vero Beach, FL | 2.0 | 2.0 | 1140 | $2,000 | $1.75 | 21d | 1 | 0.89mi |
| 23 Royal Palm Pointe Unit B Vero Beach, FL | 2.0 | 2.0 | 1100 | $2,695 | $2.45 | 21d | 1 | 0.95mi |
| 263 Provence Pl Vero Beach, FL | 2.0 | 2.5 | 1364 | $3,500 | $2.57 | 21d | 1 | 0.96mi |
| 2800 Indian River Blvd Vero Beach, FL | 1.0–2.0 | 1.5–2.0 | 847 | $3,200 | $3.78 | 13d | 5 | 0.96mi |
| 1041 Normandie Way Vero Beach, FL | 2.0 | 2.0 | 1178 | $2,100 | $1.78 | 13d | 1 | 0.99mi |
| 1429 19th Pl #4 Vero Beach, FL | 2.0 | 1.0 | 873 | $1,800 | $2.06 | 21d | 1 | 1.00mi |
| 400 E Waverly Pl Unit 2b Vero Beach, FL | 2.0 | 2.5 | 1170 | $1,900 | $1.62 | 21d | 1 | 1.10mi |
| 340 E Waverly Pl Unit 6D Vero Beach, FL | 1.0 | 1.5 | 1200 | $1,000 | $0.83 | 21d | 1 | 1.10mi |
| 1936 18th Ave Unit A Vero Beach, FL | 2.0 | 1.0 | 1100 | $2,000 | $1.82 | 21d | 1 | 1.19mi |
| 1306 12th St Unit B Vero Beach, FL | 2.0 | 1.0 | 1000 | $1,600 | $1.60 | 21d | 1 | 1.19mi |
HOA detail condo
- Monthly dues
- $597 · $7,164/yr
- Likely covers
- pool
- Assessments
- None detected in remarks — confirm with the listing agent.
Listing history 2 events
-
2026-06-18remarks 241-char remark
-
2026-06-18$149,000 Active 1 DOM
ⓘ Source: listings_history table (triggers on properties + properties_extension) + one-shot
backfill from property_details.listing_events for pre-trigger history.
Tax reassessment forecast FL · Resets to sale price
- Current annual tax
- $2,131 · $178/mo
- Projected year-2 tax
- $2,131 · $178/mo
- Expected delta
- $0/yr ($0/mo · 0.0%)
ⓘ Screening estimate from a state-policy table — verify with the county assessor before closing.
Climate risk First Street
- Flood 9/10 Extreme FEMA zone X (shaded) · 99% chance over 30 yrs
- Wildfire 2/10 Low
- Heat 10/10 Extreme 7 d/yr ≥105°F today · 25 d/yr by 30 yrs out
- Wind 10/10 Extreme 99% chance of damaging wind over 30 yrs
- Air quality 1/10 Low 0 unhealthy d/yr today · 0 by 30 yrs out
Nearby sold comps map
Loading sold comps map…
Walkable amenities ~0.75 mi
Loading nearby amenities…
Taxation est. · year 1
- Rental income
- $23,186
- − Mortgage interest
- −$8,346
- − Property taxes
- −$2,131
- − Insurance
- −$1,542
- − Repairs & maintenance
- −$1,855
- − Management
- −$1,855
- − HOA
- −$7,164
- − Depreciation
- −$4,335
- Taxable loss
- −$4,041
- Est. tax savings @ 24.0%
- +$970
- After-tax cash flow
- $-926/yr
For passive investors: Depreciation is non-cash, so a rental often shows a tax loss while cash-flowing — sheltering income. Rental losses are passive: they offset passive income freely, and up to $25,000/yr can offset ordinary (W-2) income if you actively participate and your MAGI is under $100k (phasing out to $0 by $150k); unused losses carry forward. On sale, claimed depreciation is recaptured at up to 25%, and gains may owe capital-gains tax (a 1031 exchange can defer both). Figures are a year-1 estimate at your 24.0% rate — not tax advice; consult a CPA.
Schools (NCES district)
- District
- Indian River
- NCES district ID
- 1200930
- Math proficiency
- 48% ▼ -9.00%
- Reading proficiency
- 52% ▼ -3.00%
- Median HH income
- $46,597
- Composite
- 42.45/100
- National rank
- #3218
- State rank
- #35 of 73 in FL
Livability — Vero Beach
- Score
- 80/100
- State rank
- #116
- US rank
- #1784
Category grades
Schools grade is shown separately in the Schools card above.
Census & demographics
- Census place
- Vero Beach, FL
- County
- Indian River County · 143,738 people
- City population
- 98,707
- Metro
- Sebastian-Vero Beach, FL
- Population (ZIP)
- 25,259
- Household income
- $54,682
- Rent vs Own
- Severe rent burden
- 1166.0
Population outlook (Indian River County) Hauer SSP2
- Today (2025)
- 165,104 people
- By 2030
- 172,869 · +4.7%
- By 2040
- 185,640 · +12.4%
- By 2050
- 194,465 · +17.8%
- By 2075
- 211,115 · +27.9%
- By 2100
- 211,781 · +28.3%
Race, ethnicity, and origin ACS 2023
- Neighborhood character
- Majority White (65%)
- Race & ethnicity
- White 65% Hispanic / Latino 16% Two or more races 12% Black 10% Asian 4% Native American 1%
- Hispanic origin (detail)
- Mexican 6% Puerto Rican 3% Cuban 2%
- Common ancestry
- Italian 4% Slovak 3% Romanian 3%
- Foreign-born
- 11% · Canada, Jamaica, Vietnam
- Languages at home
- 82% English-only · Spanish 13% French/Haitian/Cajun 2% Other Asian/Pacific 1%
Political lean MEDSL · Indian River
- 2024 margin
- Strong R (+27.4) · D 36.0% · R 63.4%
- 2008→2024 swing
- -12.5pp toward R · 2008: -14.8pp · 2024: -27.4pp
- All cycles
- 2024: R+27.4 2020: R+21.6 2016: R+24.5 2012: R+22.3 2008: R+14.8
Not yet ingested
- Civics
- —
Market trends
- HPI YoY
- ▼ -103.20%
- Current HPI
- 302.0029
- Rent YoY
- ▼ -1.66%
- Metro
- Sebastian-Vero Beach, FL
- State GDP YoY
- ▲ 3.28%
- F500 in state
- 36
Industry mix (Fortune 500 HQ in FL)
| Industry | F500 HQs | Revenue |
|---|---|---|
| Industrial Technology | 2 | $29B |
|
||
| Insurance | 2 | $17B |
|
||
| Retail | 1 | $60B |
|
||
| Technology Distribution | 1 | $58B |
|
||
| Homebuilding | 1 | $35B |
|
||
| Technology Manufacturing | 1 | $35B |
|
||
Price history
+161.4% since first listed25 events — show timeline
- 2026-06-18 Listed $149,000 Beaches MLS
- 2026-06-17 Listed $149,000 RAIRCMLS
- 2026-05-05 Listed for Rent $1,650 GFLMLS
- 2025-06-27 Rental Removed $1,500 GFLMLS
- 2025-06-11 Listed for Rent $1,500 GFLMLS
- 2025-04-05 Rental Removed $1,650 GFLMLS
- 2025-03-18 Listed for Rent $1,650 GFLMLS
- 2025-03-18 Rental Removed $1,650 RAIRCMLS
- 2025-03-15 Listed for Rent $1,650 RAIRCMLS
- 2025-03-11 Listing Removed — Beaches MLS
- 2025-03-06 Price Changed $166,000 Beaches MLS
- 2025-03-06 Price Changed $166,000 RAIRCMLS
- 2025-02-10 Price Changed $168,000 Beaches MLS
- 2025-02-10 Price Changed $168,000 RAIRCMLS
- 2025-02-03 Listed $169,000 Beaches MLS
- 2024-08-25 Listed $169,000 RAIRCMLS
- 2023-08-08 Relisted — RAIRCMLS
- 2023-06-19 Contingent — RAIRCMLS
- 2023-05-12 Listed $175,000 RAIRCMLS
- 2017-08-17 Sold (Public Records) $70,500 Public Records
- 2017-08-09 Sold (MLS) $70,500 RAIRCMLS
- 2017-02-16 Sold (MLS) $65,000 RAIRCMLS
- 2015-09-09 Listed $67,800 RAIRCMLS
- 2011-11-17 Sold (MLS) $55,000 RAIRCMLS
- 1981-03-01 Sold (Public Records) $57,000 Public Records
Property tax history
+10.2%/yrLatest (2025): $2,131 · +7.2% YoY. Source: county tax records.
Cash-flow waterfall
monthlySold comps — $/sqft
last 12 mo · ≤1 miLoading sold comps…